The document is the earnings review for Itaú Unibanco Holding S.A. for 3rd quarter 2014. Key highlights include:
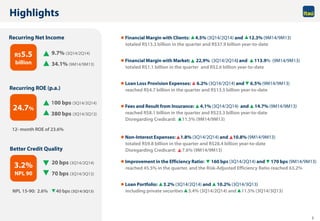
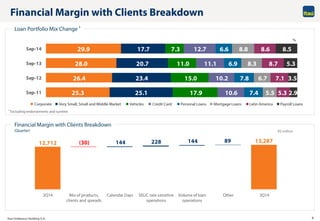
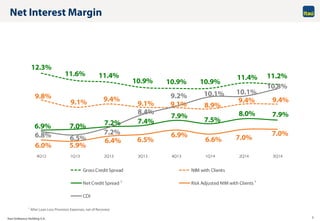
- Financial margin with clients increased 4.5% quarter-over-quarter and 12.3% year-over-year.
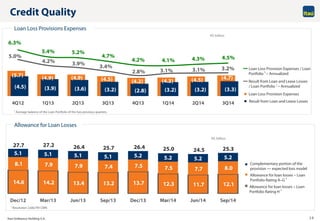
- Loan loss provision expenses increased 6.2% quarter-over-quarter and 6.5% year-over-year.
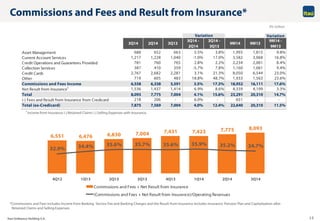
- Fees and insurance results increased 4.1% quarter-over-quarter and 14.7% year-over-year.
- Recurring net income increased 9.7% quarter-over-quarter and 35.7% year-over-year.