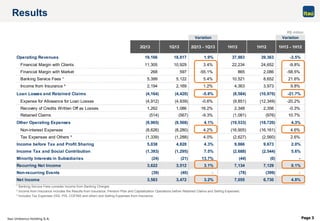
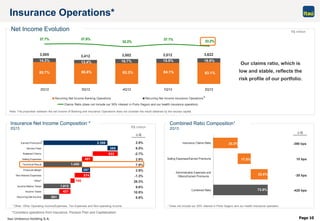
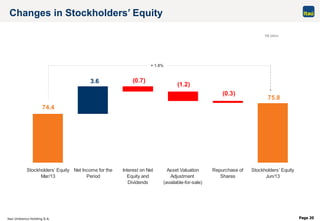
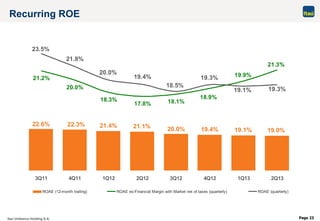
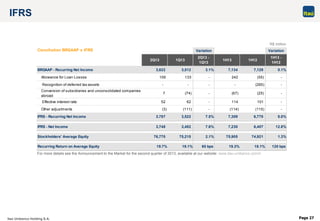
- Itaú Unibanco reported a 3.1% increase in recurring net income for the 2nd quarter of 2013 compared to the previous quarter, totaling R$3.6 billion.
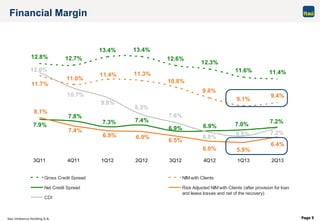
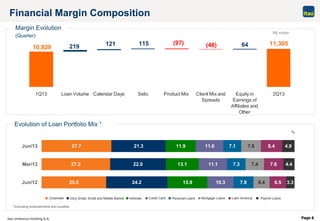
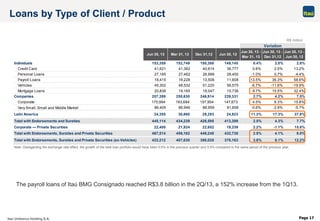
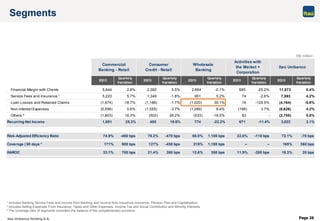
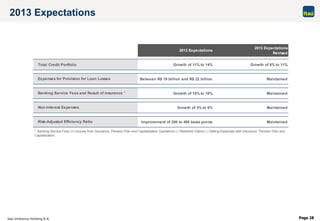
- Operational performance was positive, with the credit portfolio growing 2.5% in the quarter. Financial margin with clients grew 3.4% compared to the previous quarter.
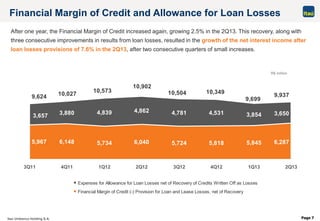
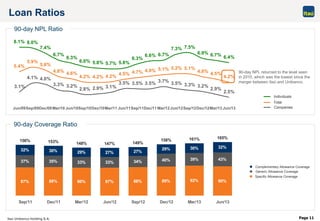
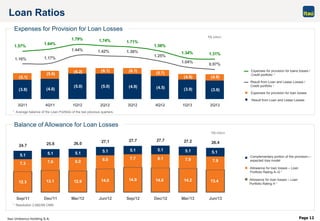
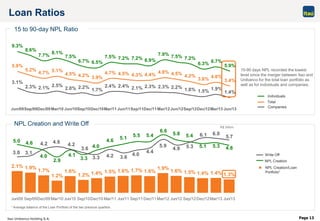
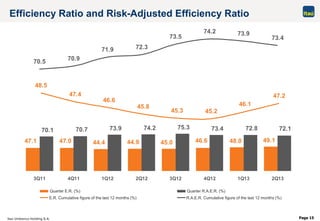
- Credit quality improved, with non-performing loans decreasing 30 basis points in the quarter and 100 basis points over 12 months. Loan loss provisions expenses were stable compared to the previous quarter.