This document provides highlights from Itaú Unibanco Holding's 1st quarter 2013 earnings call. Key points include:
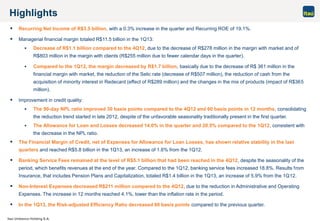
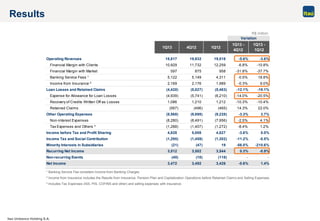
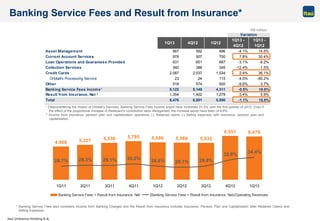
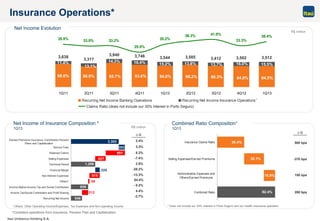
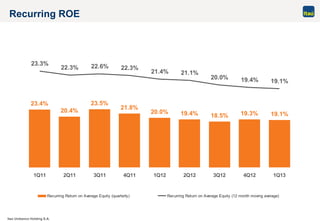
- Recurring net income increased 0.3% from the previous quarter to R$3.5 billion, with a recurring ROE of 19.1%.
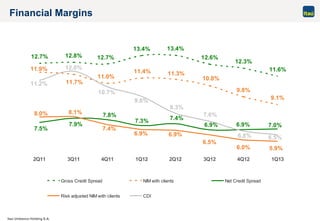
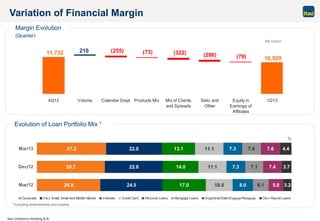
- Managerial financial margin totaled R$11.5 billion, down from R$11.7 billion in 4Q12 and R$12.6 billion in 1Q12.
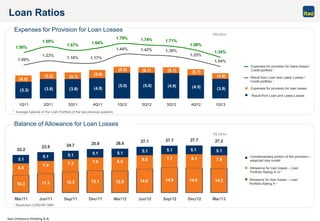
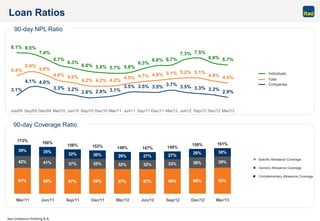
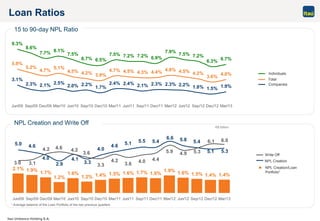
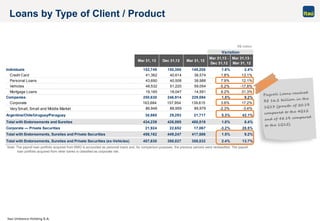
- Credit quality improved with the 90-day NPL ratio down 30 bps from 4Q12 and 60 bps from 1Q12, while allowance for loan losses decreased 14% from 4Q12.