The document summarizes the financial performance of African Banking Corporation for the first half of 2008. Key points include:
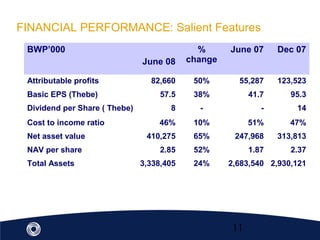
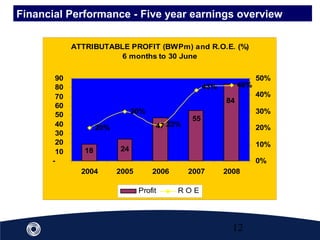
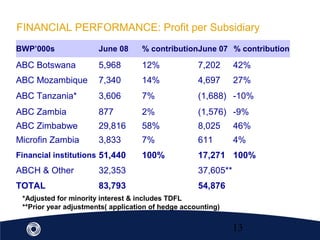
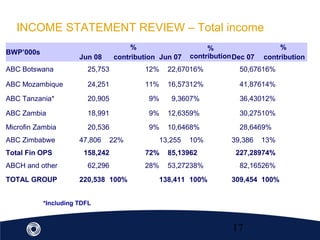
- Profit increased 50% to BWP82.6 million due to strong growth across subsidiaries.
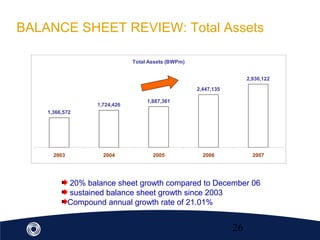
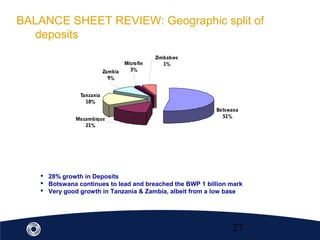
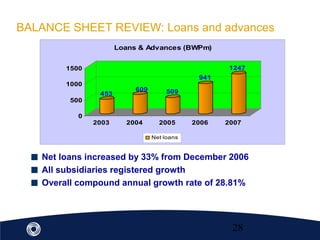
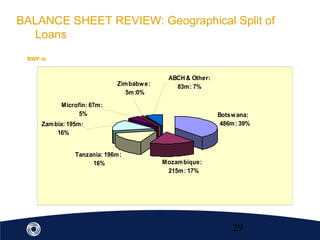
- Assets grew 24% to BWP3.338 billion as loans increased 49% and deposits rose 26%.
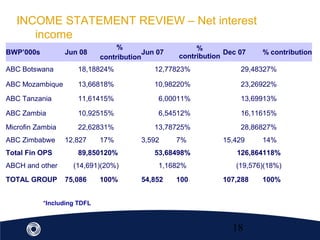
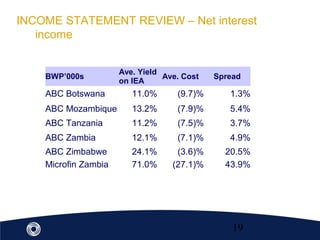
- Net interest income increased 68% and the cost to income ratio improved to 46%, down from 51% previously.
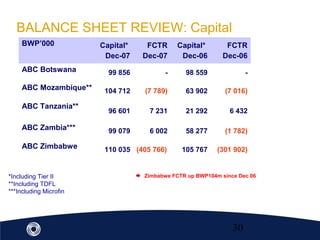
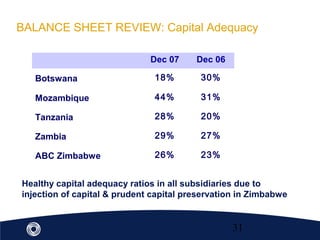
- All subsidiaries were profitable except Botswana which faced impairments, while Zimbabwe, Mozambique, and Tanzania posted strong results.