Download to read offline
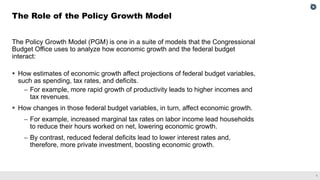
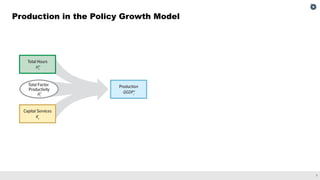

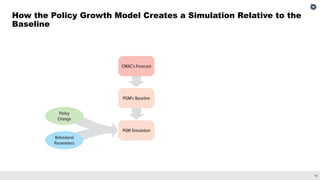
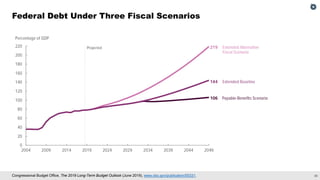
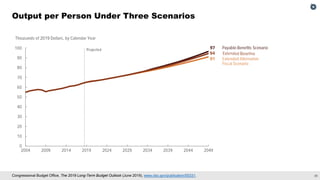

The Congressional Budget Office's Policy Growth Model (PGM) analyzes the interaction between economic growth and federal budget variables, influencing spending, tax rates, and deficits. It assesses how changes in these variables impact potential output, labor supply, and capital investment, ultimately affecting the national economy over time. Recent analyses using the PGM evaluate the effects of different fiscal policies on economic and budgetary outcomes, including productivity growth and interest rates.


