Presentation at a conference organized by the
Economic Policy Innovation Center and the Paragon Health Institute
April 25, 2024
Phillip L. Swagel
Director
The Federal Budget and
Health Care Policy
For more information about the organizers, see https://epicforamerica.org/ and https://paragoninstitute.org/.
Percent
Net interest
Noninterest
Discretionary
Major health
care programs
Social Security
Other mandatory
Total outlays
31 23
16
10
26
28
28
39
0
25
50
75
100
2024 2054
Noninterest outlays
13
87
23
77
Source: Congressional Budget Office, The Long-Term Budget Outlook: 2024 to 2054 (March 2024), Figure 2-3, www.cbo.gov/publication/59711.
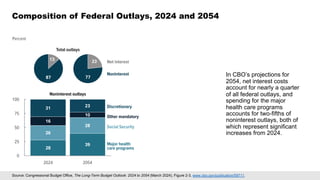
Composition of Federal Outlays, 2024 and 2054
In CBO’s projections for
2054, net interest costs
account for nearly a quarter
of all federal outlays, and
spending for the major
health care programs
accounts for two-fifths of
noninterest outlays, both of
which represent significant
increases from 2024.
Projected
0
2
4
6
8
10
2009 2014 2019 2024 2029 2034 2039 2044 2049 2054
Percentage of gross domestic product
Medicaid, CHIP, and
premium tax credits
and related spending
Medicare
Source: Congressional Budget Office, The Long-Term Budget Outlook: 2024 to 2054 (March 2024), Figure 2-4, www.cbo.gov/publication/59711.
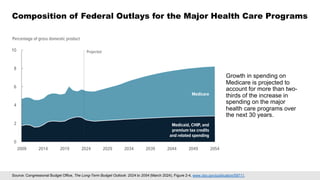
Composition of Federal Outlays for the Major Health Care Programs
Growth in spending on
Medicare is projected to
account for more than two-
thirds of the increase in
spending on the major
health care programs over
the next 30 years.
3
Medicare:
11.7
(47.0%)
Medicaid
and CHIP:
6.3
(25.1%)
Employment−
based
coverage:
5.3
(21.4%)
Nongroup coverage and the
basic health program: 1.1 (4.2%)
Other:
0.6 (2.3%)
Trillions of dollars
Total:
25.0
Source: Congressional Budget Office, Federal Subsidies for Health Insurance (September 2023), p. 3, www.cbo.gov/publication/59273.
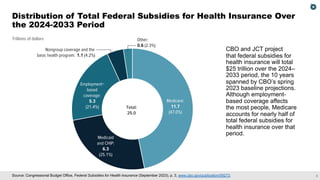
Distribution of Total Federal Subsidies for Health Insurance Over
the 2024-2033 Period
CBO and JCT project
that federal subsidies for
health insurance will total
$25 trillion over the 2024–
2033 period, the 10 years
spanned by CBO’s spring
2023 baseline projections.
Although employment-
based coverage affects
the most people, Medicare
accounts for nearly half of
total federal subsidies for
health insurance over that
period.
4
Percentage of gross domestic product
0.35
3.10
2.09
1.33
0.31
4.00
2.03
1.75
Employment-Based Coverage Medicaid and CHIP Medicare Nongroup coverage and the
basic health program
Employment-based
coverage
2023
2033
Source: Congressional Budget Office, Federal Subsidies for Health Insurance (September 2023), p. 2, www.cbo.gov/publication/59273.
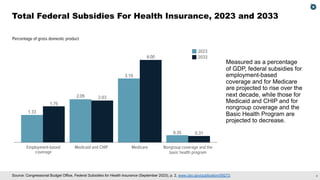
Total Federal Subsidies For Health Insurance, 2023 and 2033
Measured as a percentage
of GDP, federal subsidies for
employment-based
coverage and for Medicare
are projected to rise over the
next decade, while those for
Medicaid and CHIP and for
nongroup coverage and the
Basic Health Program are
projected to decrease.
5
Percentage of gross domestic product
6.3 6.0
1.2
2.6
6.3
9.8
5.2 4.7
1.2
5.2
5.9
Major health care programs Social Security
2024 2054 2024 2054
Outlays without effects
from additional cost
growth or aging of the
population
Aging of the population
Additional
cost growth
Source: Congressional Budget Office, The Long-Term Budget Outlook: 2024 to 2054 (March 2024), Figure 2-5, www.cbo.gov/publication/59711.
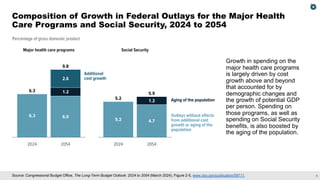
Composition of Growth in Federal Outlays for the Major Health
Care Programs and Social Security, 2024 to 2054
Growth in spending on the
major health care programs
is largely driven by cost
growth above and beyond
that accounted for by
demographic changes and
the growth of potential GDP
per person. Spending on
those programs, as well as
spending on Social Security
benefits, is also boosted by
the aging of the population.
6
Percentage of gross domestic product
0
2
4
6
8
10
2021
2021 2022
2022 2023
2023 2024
2024 2025
2025 2026
2026 2027
2027 2028
2028 2029
2029 2030
2030 2031
2031 2032
2032 2033
2033
February 2023
projection
June 2010
projection
Actual
Source: Congressional Budget Office, letter to the Honorable Sheldon Whitehouse about CBO’s projections of federal health care spending (March 17, 2023), p. 12,
www.cbo.gov/publication/58997.
CBO’s Projections of Federal Outlays for the Major
Health Care Programs
In its long-term projections
made in 2010, CBO
estimated that federal outlays
for the major health care
programs would increase
from 6.8 percent of GDP in
2023 to 8.5 percent of GDP
in 2033. In its 2023
projections, the agency
expected federal spending on
those programs, measured
as a percentage of GDP, to
grow more slowly over that
10-year period, increasing
from 5.8 percent of GDP in
2023 to 6.9 percent of GDP
in 2033.
7
CBO is assessing the role of health behaviors and preventive measures beyond
the usual 10-year budget window.
In particular, how would long-term health trajectories be affected by:
§ Expanding insurance coverage of anti-obesity medications, at different ages;
and
§ Expanding diagnosis and treatment of Hepatitis C?
Health Over the Life Cycle
8
CBO is assessing the roles of federal policies and other factors.
For example, some policies have incentives for providers to move out of
independent practices and into larger systems.
CBO is studying effects on:
§ Prices,
§ Site of care, and
§ Utilization patterns.
Competition and Related Policies
9
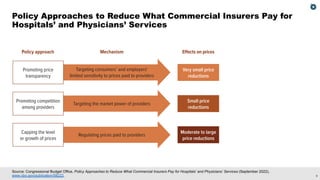
Promoting price
transparency
Promoting competition
among providers
Capping the level
or growth of prices
Targeting consumers’ and employers’
limited sensitivity to prices paid to providers
Targeting the market power of providers
Regulating prices paid to providers
Small price
reductions
Moderate to large
price reductions
Very small price
reductions
Policy approach Effects on prices
Mechanism
Source: Congressional Budget Office, Policy Approaches to Reduce What Commercial Insurers Pay for Hospitals’ and Physicians’ Services (September 2022),
www.cbo.gov/publication/58222.
Policy Approaches to Reduce What Commercial Insurers Pay for
Hospitals’ and Physicians’ Services
10
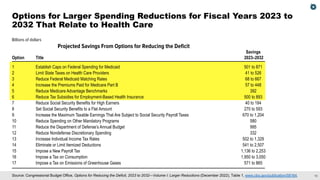
Source: Congressional Budget Office, Options for Reducing the Deficit, 2023 to 2032—Volume I: Larger Reductions (December 2022), Table 1, www.cbo.gov/publication/58164.
Options for Larger Spending Reductions for Fiscal Years 2023 to
2032 That Relate to Health Care
Savings
Option Title 2023–2032
1 Establish Caps on Federal Spending for Medicaid 501 to 871
2 Limit State Taxes on Health Care Providers 41 to 526
3 Reduce Federal Medicaid Matching Rates 68 to 667
4 Increase the Premiums Paid for Medicare Part B 57 to 448
5 Reduce Medicare Advantage Benchmarks 392
6 Reduce Tax Subsidies for Employment-Based Health Insurance 500 to 893
7 Reduce Social Security Benefits for High Earners 40 to 184
8 Set Social Security Benefits to a Flat Amount 270 to 593
9 Increase the Maximum Taxable Earnings That Are Subject to Social Security Payroll Taxes 670 to 1,204
10 Reduce Spending on Other Mandatory Programs 580
11 Reduce the Department of Defense’s Annual Budget 995
12 Reduce Nondefense Discretionary Spending 332
13 Increase Individual Income Tax Rates 502 to 1,329
14 Eliminate or Limit Itemized Deductions 541 to 2,507
15 Impose a New Payroll Tax 1,136 to 2,253
16 Impose a Tax on Consumption 1,950 to 3,050
17 Impose a Tax on Emissions of Greenhouse Gases 571 to 865
Billions of dollars
Projected Savings From Options for Reducing the Deficit