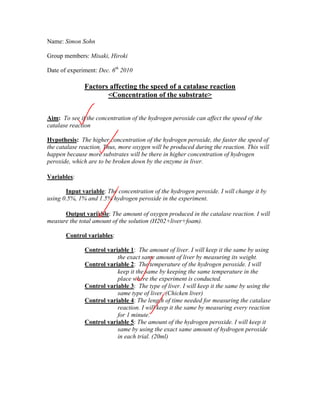
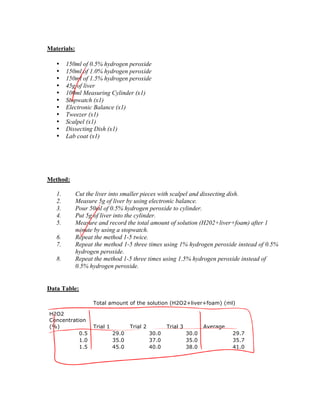
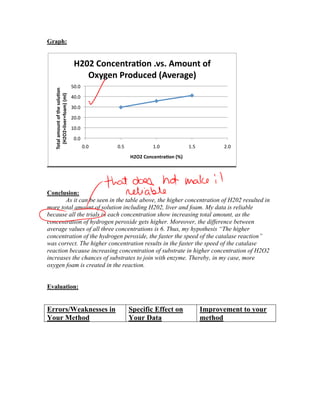
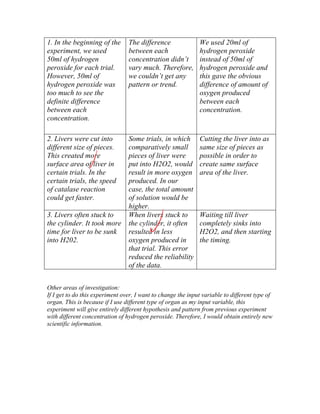
Name: Simon Sohn
Enzyme Experiment
Name: Simon Sohn

Group members: Misaki, Hiroki

Date of experiment: Dec. 6th 2010

              Factors affecting the speed of a catalase reaction
                     <Concentration of the substrate>


Aim: To see if the concentration of the hydrogen peroxide can affect the speed of the
catalase reaction

Hypothesis: The higher concentration of the hydrogen peroxide, the faster the speed of
the catalase reaction. Thus, more oxygen will be produced during the reaction. This will
happen because more substrates will be there in higher concentration of hydrogen
peroxide, which are to be broken down by the enzyme in liver.

Variables:

       Input variable: The concentration of the hydrogen peroxide. I will change it by
using 0.5%, 1% and 1.5% hydrogen peroxide in the experiment.

      Output variable: The amount of oxygen produced in the catalase reaction. I will
measure the total amount of the solution (H202+liver+foam).

       Control variables:

              Control variable 1: The amount of liver. I will keep it the same by using
                          the exact same amount of liver by measuring its weight.
              Control variable 2: The temperature of the hydrogen peroxide. I will
                          keep it the same by keeping the same temperature in the
                          place where the experiment is conducted.
              Control variable 3: The type of liver. I will keep it the same by using the
                          same type of liver. (Chicken liver)
              Control variable 4: The length of time needed for measuring the catalase
                          reaction. I will keep it the same by measuring every reaction
                          for 1 minute.
              Control variable 5: The amount of the hydrogen peroxide. I will keep it
                          same by using the exact same amount of hydrogen peroxide
                          in each trial. (20ml)
Materials:

   •    150ml of 0.5% hydrogen peroxide
   •    150ml of 1.0% hydrogen peroxide
   •    150ml of 1.5% hydrogen peroxide
   •    45g of liver
   •    100ml Measuring Cylinder (x1)
   •    Stopwatch (x1)
   •    Electronic Balance (x1)
   •    Tweezer (x1)
   •    Scalpel (x1)
   •    Dissecting Dish (x1)
   •    Lab coat (x1)


Method:

   1.        Cut the liver into smaller pieces with scalpel and dissecting dish.
   2.        Measure 5g of liver by using electronic balance.
   3.        Pour 50ml of 0.5% hydrogen peroxide to cylinder.
   4.        Put 5g of liver into the cylinder.
   5.        Measure and record the total amount of solution (H202+liver+foam) after 1
             minute by using a stopwatch.
   6.        Repeat the method 1-5 twice.
   7.        Repeat the method 1-5 three times using 1% hydrogen peroxide instead of 0.5%
             hydrogen peroxide.
   8.        Repeat the method 1-5 three times using 1.5% hydrogen peroxide instead of
             0.5% hydrogen peroxide.
 
 
Data Table:

                   Total amount of the solution (H2O2+liver+foam) (ml)

H2O2
Concentration
(%)                Trial 1          Trial 2          Trial 3          Average
           0.5               29.0             30.0             30.0             29.7
           1.0               35.0             37.0             35.0             35.7
           1.5               45.0             40.0             38.0             41.0
Graph:


                                   H202 Concentra.on .vs. Amount of 
                                      Oxygen Produced (Average) 
                                  50.0 
   Total amount of the solu.on 
     (H2O2+liver+foam) (ml)  


                                  40.0 
                                  30.0 
                                  20.0 
                                  10.0 
                                   0.0 
                                          0.0    0.5             1.0             1.5          2.0 
                                                        H2O2 Concentra.on (%) 


Conclusion:
       As it can be seen in the table above, the higher concentration of H202 resulted in
more total amount of solution including H202, liver and foam. My data is reliable
because all the trials in each concentration show increasing total amount, as the
concentration of hydrogen peroxide gets higher. Moreover, the difference between
average values of all three concentrations is 6. Thus, my hypothesis “The higher
concentration of the hydrogen peroxide, the faster the speed of the catalase reaction”
was correct. The higher concentration results in the faster the speed of the catalase
reaction because increasing concentration of substrate in higher concentration of H2O2
increases the chances of substrates to join with enzyme. Thereby, in my case, more
oxygen foam is created in the reaction.


Evaluation:


Errors/Weaknesses in                                    Specific Effect on              Improvement to your
Your Method                                             Your Data                       method
1. In the beginning of the       The difference               We used 20ml of
experiment, we used              between each                 hydrogen peroxide
50ml of hydrogen                 concentration didn’t         instead of 50ml of
peroxide for each trial.         vary much. Therefore,        hydrogen peroxide and
However, 50ml of                 we couldn’t get any          this gave the obvious
hydrogen peroxide was            pattern or trend.            difference of amount of
too much to see the                                           oxygen produced
definite difference                                           between each
between each                                                  concentration.
concentration.

2. Livers were cut into          Some trials, in which        Cutting the liver into as
different size of pieces.        comparatively small          same size of pieces as
This created more                pieces of liver were         possible in order to
surface area of liver in         put into H2O2, would         create same surface
certain trials. In the           result in more oxygen        area of the liver.
certain trials, the speed        produced. In our
of catalase reaction             case, the total amount
could get faster.                of solution would be
                                 higher.
3. Livers often stuck to         When livers stuck to         Waiting till liver
the cylinder. It took more       the cylinder, it often       completely sinks into
time for liver to be sunk        resulted in less             H2O2, and then starting
into H202.                       oxygen produced in           the timing.
                                 that trial. This error
                                 reduced the reliability
                                 of the data.


Other areas of investigation:
If I get to do this experiment over, I want to change the input variable to different type of
organ. This is because if I use different type of organ as my input variable, this
experiment will give entirely different hypothesis and pattern from previous experiment
with different concentration of hydrogen peroxide. Therefore, I would obtain entirely new
scientific information.

Catalase simon

  • 1.
  • 3.
    Name: Simon Sohn Groupmembers: Misaki, Hiroki Date of experiment: Dec. 6th 2010 Factors affecting the speed of a catalase reaction <Concentration of the substrate> Aim: To see if the concentration of the hydrogen peroxide can affect the speed of the catalase reaction Hypothesis: The higher concentration of the hydrogen peroxide, the faster the speed of the catalase reaction. Thus, more oxygen will be produced during the reaction. This will happen because more substrates will be there in higher concentration of hydrogen peroxide, which are to be broken down by the enzyme in liver. Variables: Input variable: The concentration of the hydrogen peroxide. I will change it by using 0.5%, 1% and 1.5% hydrogen peroxide in the experiment. Output variable: The amount of oxygen produced in the catalase reaction. I will measure the total amount of the solution (H202+liver+foam). Control variables: Control variable 1: The amount of liver. I will keep it the same by using the exact same amount of liver by measuring its weight. Control variable 2: The temperature of the hydrogen peroxide. I will keep it the same by keeping the same temperature in the place where the experiment is conducted. Control variable 3: The type of liver. I will keep it the same by using the same type of liver. (Chicken liver) Control variable 4: The length of time needed for measuring the catalase reaction. I will keep it the same by measuring every reaction for 1 minute. Control variable 5: The amount of the hydrogen peroxide. I will keep it same by using the exact same amount of hydrogen peroxide in each trial. (20ml)
  • 4.
    Materials: • 150ml of 0.5% hydrogen peroxide • 150ml of 1.0% hydrogen peroxide • 150ml of 1.5% hydrogen peroxide • 45g of liver • 100ml Measuring Cylinder (x1) • Stopwatch (x1) • Electronic Balance (x1) • Tweezer (x1) • Scalpel (x1) • Dissecting Dish (x1) • Lab coat (x1) Method: 1. Cut the liver into smaller pieces with scalpel and dissecting dish. 2. Measure 5g of liver by using electronic balance. 3. Pour 50ml of 0.5% hydrogen peroxide to cylinder. 4. Put 5g of liver into the cylinder. 5. Measure and record the total amount of solution (H202+liver+foam) after 1 minute by using a stopwatch. 6. Repeat the method 1-5 twice. 7. Repeat the method 1-5 three times using 1% hydrogen peroxide instead of 0.5% hydrogen peroxide. 8. Repeat the method 1-5 three times using 1.5% hydrogen peroxide instead of 0.5% hydrogen peroxide.     Data Table: Total amount of the solution (H2O2+liver+foam) (ml) H2O2 Concentration (%) Trial 1 Trial 2 Trial 3 Average 0.5 29.0 30.0 30.0 29.7 1.0 35.0 37.0 35.0 35.7 1.5 45.0 40.0 38.0 41.0
  • 5.
    Graph: H202 Concentra.on .vs. Amount of  Oxygen Produced (Average)  50.0  Total amount of the solu.on  (H2O2+liver+foam) (ml)   40.0  30.0  20.0  10.0  0.0  0.0  0.5  1.0  1.5  2.0  H2O2 Concentra.on (%)  Conclusion: As it can be seen in the table above, the higher concentration of H202 resulted in more total amount of solution including H202, liver and foam. My data is reliable because all the trials in each concentration show increasing total amount, as the concentration of hydrogen peroxide gets higher. Moreover, the difference between average values of all three concentrations is 6. Thus, my hypothesis “The higher concentration of the hydrogen peroxide, the faster the speed of the catalase reaction” was correct. The higher concentration results in the faster the speed of the catalase reaction because increasing concentration of substrate in higher concentration of H2O2 increases the chances of substrates to join with enzyme. Thereby, in my case, more oxygen foam is created in the reaction. Evaluation: Errors/Weaknesses in Specific Effect on Improvement to your Your Method Your Data method
  • 6.
    1. In thebeginning of the The difference We used 20ml of experiment, we used between each hydrogen peroxide 50ml of hydrogen concentration didn’t instead of 50ml of peroxide for each trial. vary much. Therefore, hydrogen peroxide and However, 50ml of we couldn’t get any this gave the obvious hydrogen peroxide was pattern or trend. difference of amount of too much to see the oxygen produced definite difference between each between each concentration. concentration. 2. Livers were cut into Some trials, in which Cutting the liver into as different size of pieces. comparatively small same size of pieces as This created more pieces of liver were possible in order to surface area of liver in put into H2O2, would create same surface certain trials. In the result in more oxygen area of the liver. certain trials, the speed produced. In our of catalase reaction case, the total amount could get faster. of solution would be higher. 3. Livers often stuck to When livers stuck to Waiting till liver the cylinder. It took more the cylinder, it often completely sinks into time for liver to be sunk resulted in less H2O2, and then starting into H202. oxygen produced in the timing. that trial. This error reduced the reliability of the data. Other areas of investigation: If I get to do this experiment over, I want to change the input variable to different type of organ. This is because if I use different type of organ as my input variable, this experiment will give entirely different hypothesis and pattern from previous experiment with different concentration of hydrogen peroxide. Therefore, I would obtain entirely new scientific information.