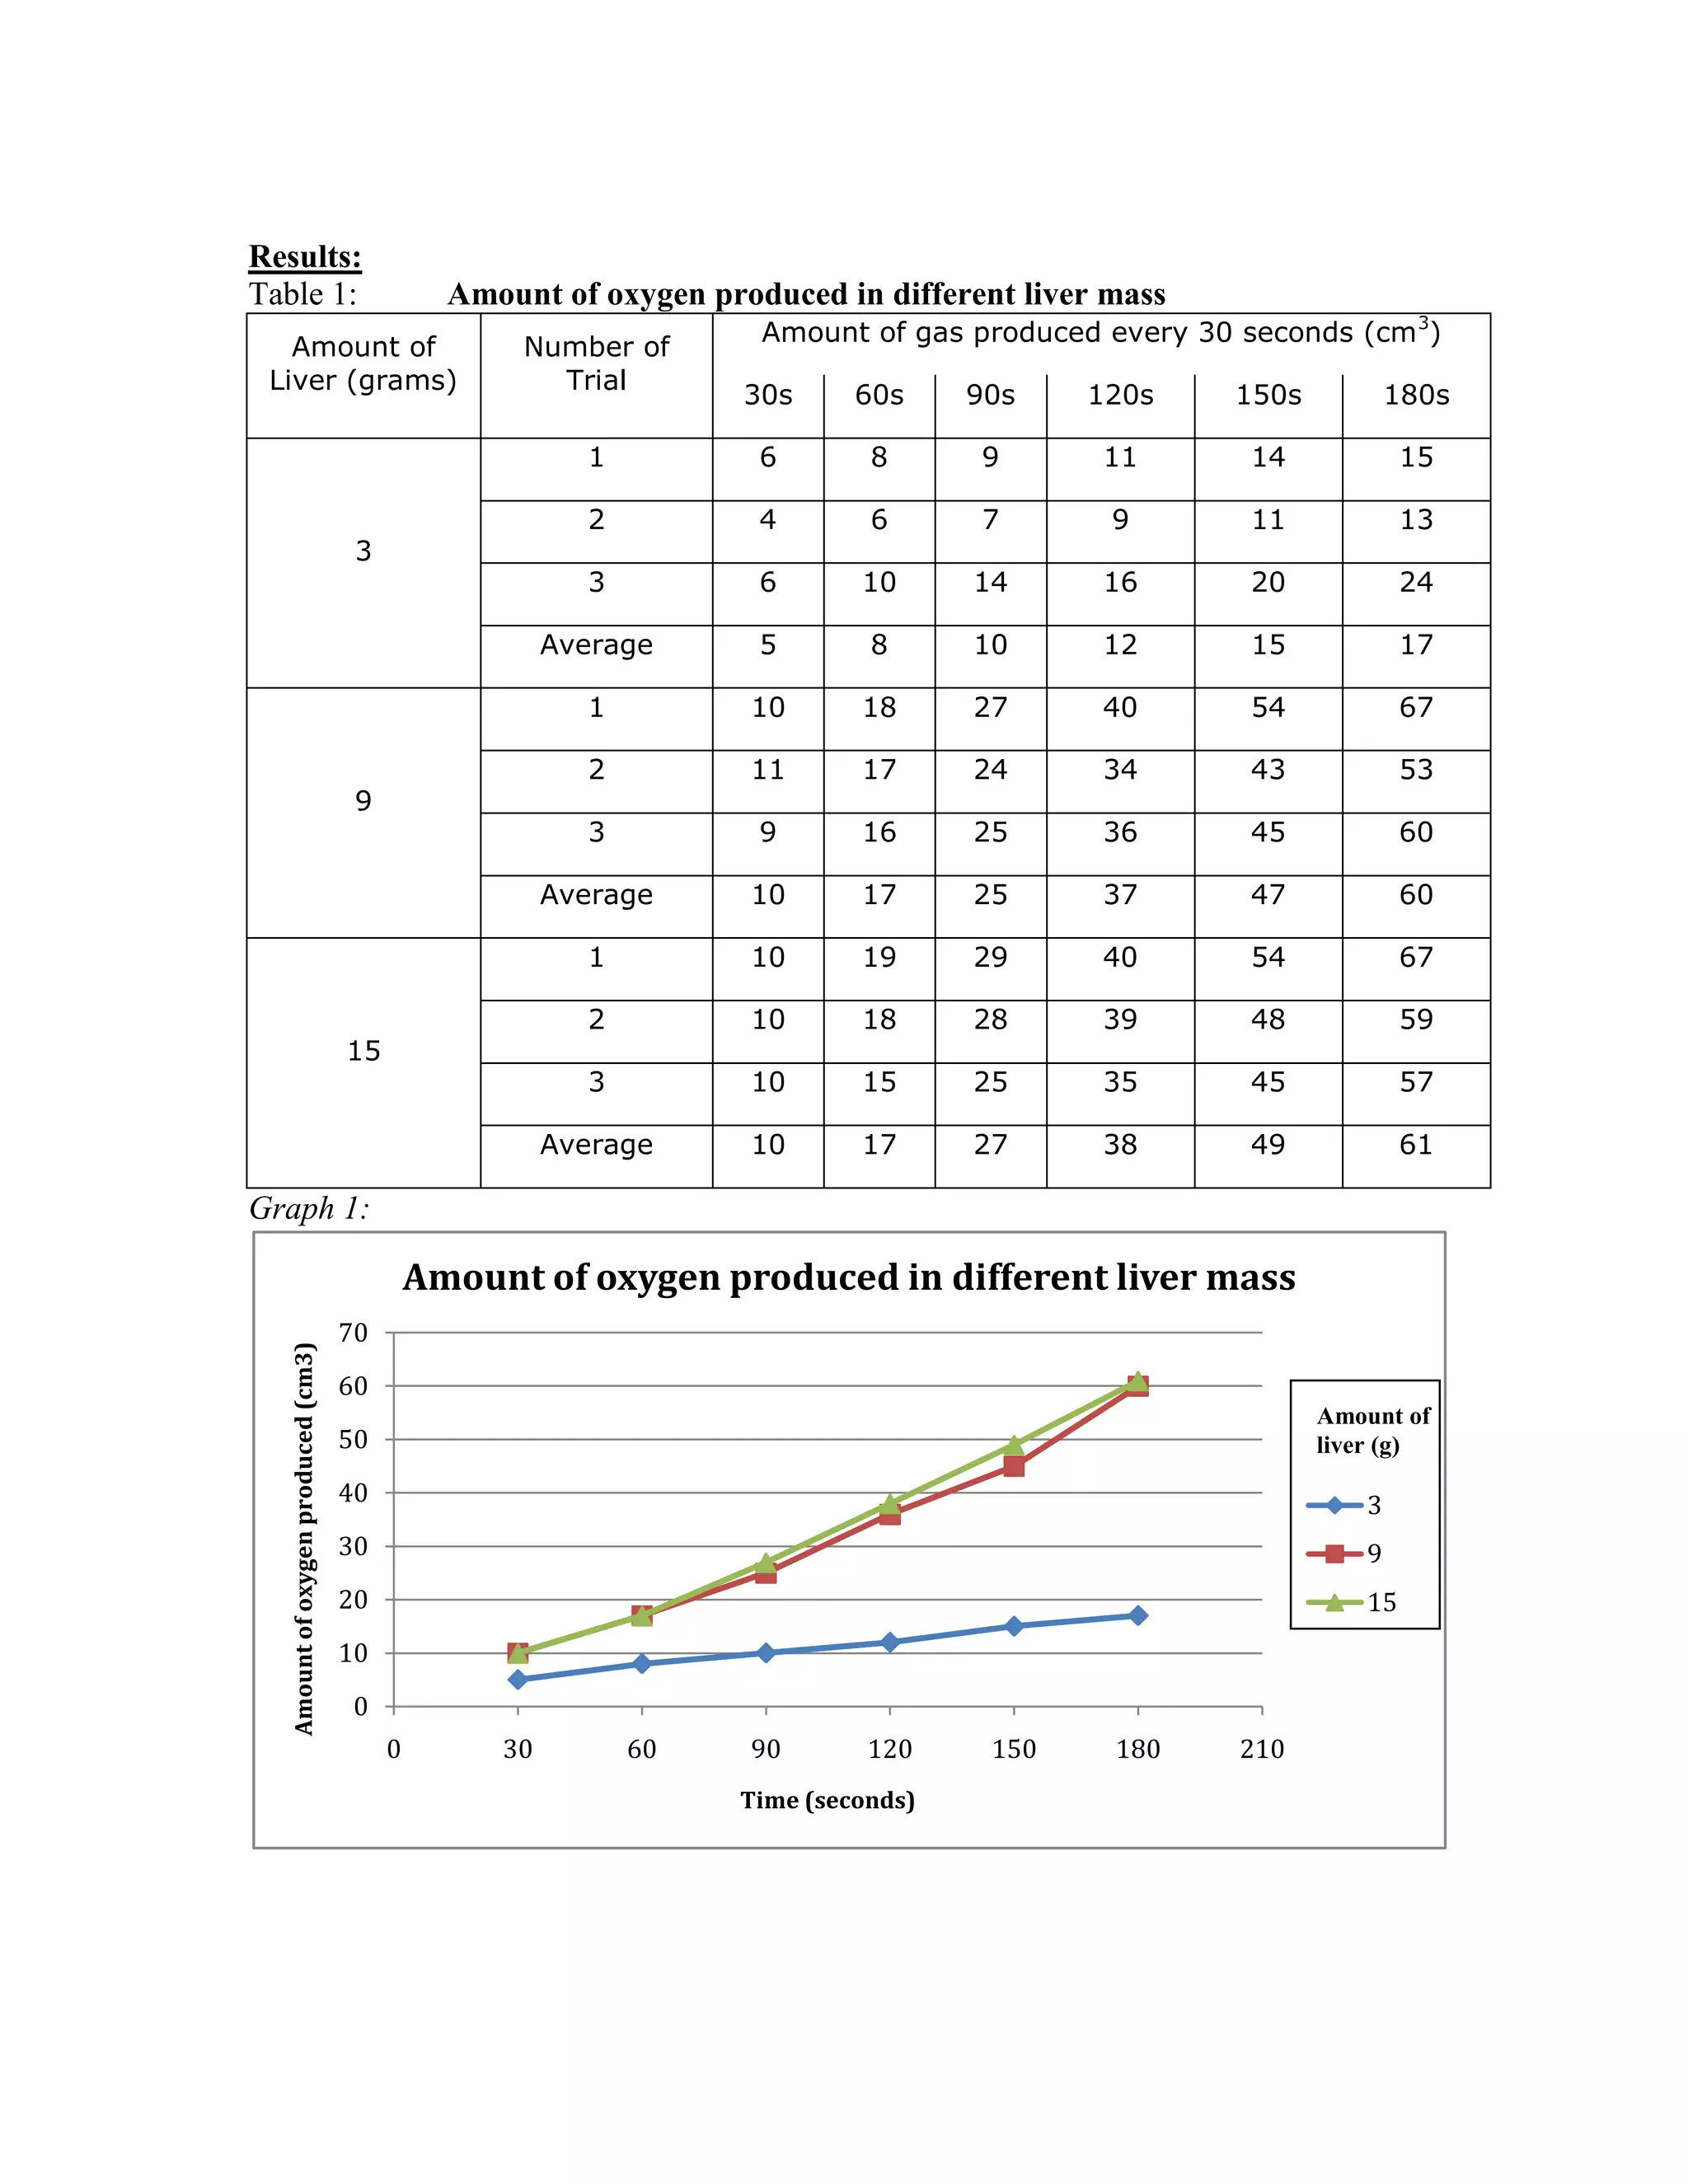
12. Repeat 2~11 with 9g and 15g of liverResults:<br />Table 1: Amount of oxygen produced in different liver mass<br />Amount of Liver (grams)Number of TrialAmount of gas produced every 30 seconds (cm3)30s60s90s120s150s180s31689111415246791113361014162024Average5810121517911018274054672111724344353391625364560Average10172537476015110192940546721018283948593101525354557Average101727384961<br />Graph 1:<br />Amount of liver (g)<br />Conclusion:<br />In the graph shown above we could see that there was a clear difference of amount of Hydrogen Peroxide between 3 grams with 9 grams and 3 grams with 15. However there wasn’t a big difference between 9 grams and 15 grams of liver. We could see that on average, there wasn't a difference until 1 minute but after 1 minute there were one or two cm3 differences. Although there wasn’t a great difference on average between 9 grams of liver and 15 grams of liver we could see that the more the amount of liver the more the oxygen was produced. There were about 1~2cm3 increase from 9 to 15 grams. Because if we increase the amount of liver there will be more catalase reacting with Hydrogen Peroxide more oxygen was produced. I think there wasn’t a great difference between the result of 9 grams and 15 grams because of the amount of Hydrogen Peroxide. Although there was more catalase in 15 grams of liver I think there was little amount of Hydrogen Peroxide to react with. Another reason I think is because of the surface area of the liver that is touching the Hydrogen Peroxide. Although the liver was heavier the surface are that touched the Hydrogen Peroxide could have had not much difference. Therefore our hypothesis is somewhat correct. The amount of oxygen produced increased from 3 grams to 9 grams, but there wasn’t a great difference from 9 to 15 grams.<br />I don’t think my data is reliable enough because of the way we have measured the amount of oxygen produced. When we put the rubber tubing on the conical flask I have figured out that there was a 3~5 cm3 increase in the gas law syringe. Every trial the amount of gas increased differed. Sometimes the gas increased by 3cm3, sometimes the gas increased by 4cm3, and at most it increased by 5cm3 when we put the rubber tubing on to the conical flask. On average they increased by 4cm3. Because the data isn’t reliable the conclusion is not reliable also. There were only one or two cm3 difference between 9 grams and 15 grams. The one or two difference could have been from when we have put the rubber tubing on to the conical flask.<br />Evaluation:<br />I think overall our method is a reliable method to collect data however; there are some parts that are not reliable. The method may not give a reliable data because when we put the glass tubing the oxygen inside the conical flask may move to the gas collection cylinder and increase the value. The increased amount may vary depending on how hard we have pressed the rubber tubing. The method may not be reliable because on step 7 it is said to put the rubber tubing on as soon as we put the liver inside. The method does not specify whether ‘inside’ means inside the conical flask or when the liver touched the hydrogen peroxide. There were some errors that occurred during our experiment. When we did our experiment, we have left out the Hydrogen Peroxide in the sun for quite a long time. This could have had an effect on our data because when Hydrogen Peroxide is left in the sun the Hydrogen Peroxide can become dilute and slower the reaction. This will cause the amount of oxygen produced to be lower than what it should. Another error is that we sometimes used one piece or two pieces of liver. This could have had an effect on our data. This could have cause more oxygen to be produced because the more the pieces, the larger the surface area and the more the catalase reacts with Hydrogen Peroxide. <br />To improve the method I think we should first clarify the word inside. I think step 7 should be changed to ‘as soon as the liver touched the Hydrogen Peroxide’, put the rubber tubing on to the conical flask (air tight). I think to make our data reliable we should take note of the increase of gas when we put the rubber tubing on to the conical flask and subtract the value to each recording. For example for 3grams of liver trial 1 if the increase value on the gas collection cylinder was 4cm3, we should subtract to each recording by 4. Therefore the result would be 2, 4, 5, 7, 10, 11. By subtracting the increased value of the gas law syringe when the rubber tubing was put on the conical flask we could increase the reliability of our result. To solve the errors occurred during the experiment, I think we should state in the method to cover Hydrogen Peroxide with dark cloth to stop the reaction with the light when we are not using the Hydrogen Peroxide. To solve the problem with different surface areas, I think we should state in the method to cut the liver in one piece. By doing this we could solve the problem with larger surface area, which could have caused the value to be higher.<br />We could test different factors that affect the speed of the catalase. We could test whether the amount of Hydrogen Peroxide affects the speed of the catalase. We could also test different types of livers. We could test which animal’s liver has the fastest reaction. We could also test the concentration of the Hydrogen peroxide.<br />