Download as PDF, PPTX

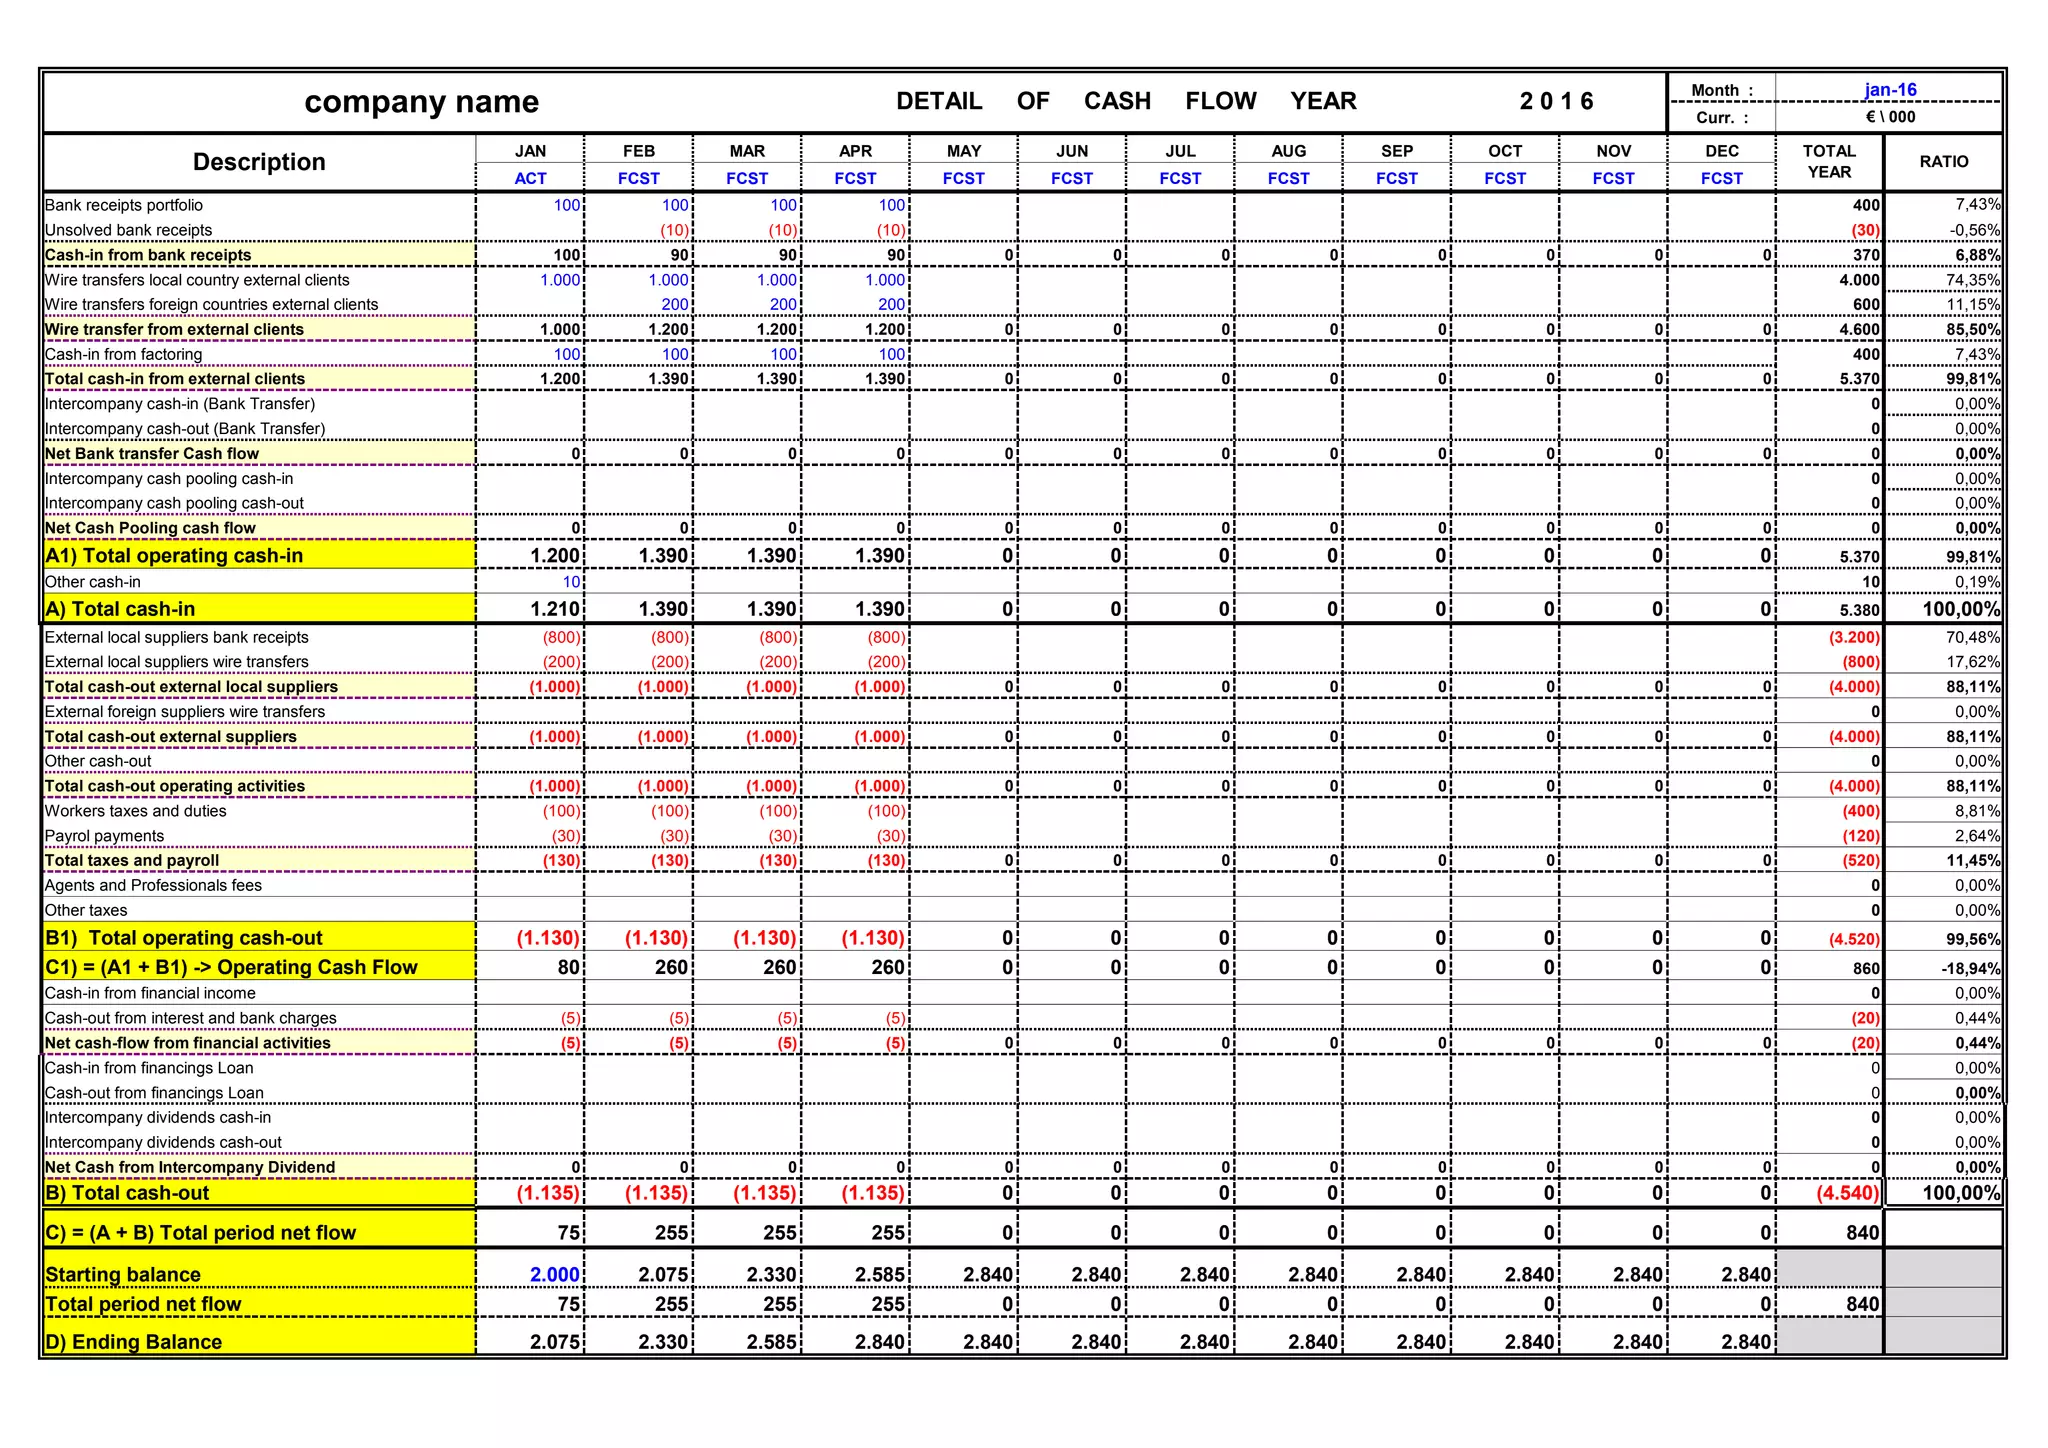

The document shows the projected cash flow statement for a company for the year 2016 broken down by month. It includes projections for cash inflows from various sources like bank receipts, wire transfers from external clients, and cash outflows like payments to external suppliers, taxes and payroll. The total projected net cash flow for the year is €840,000 with an ending cash balance of €2,840,000 in December 2016. Major cash inflows are expected from wire transfers from external clients totaling €4,600,000 while major cash outflows are payments to external local suppliers of €4,000,000.