Downloaded 213 times
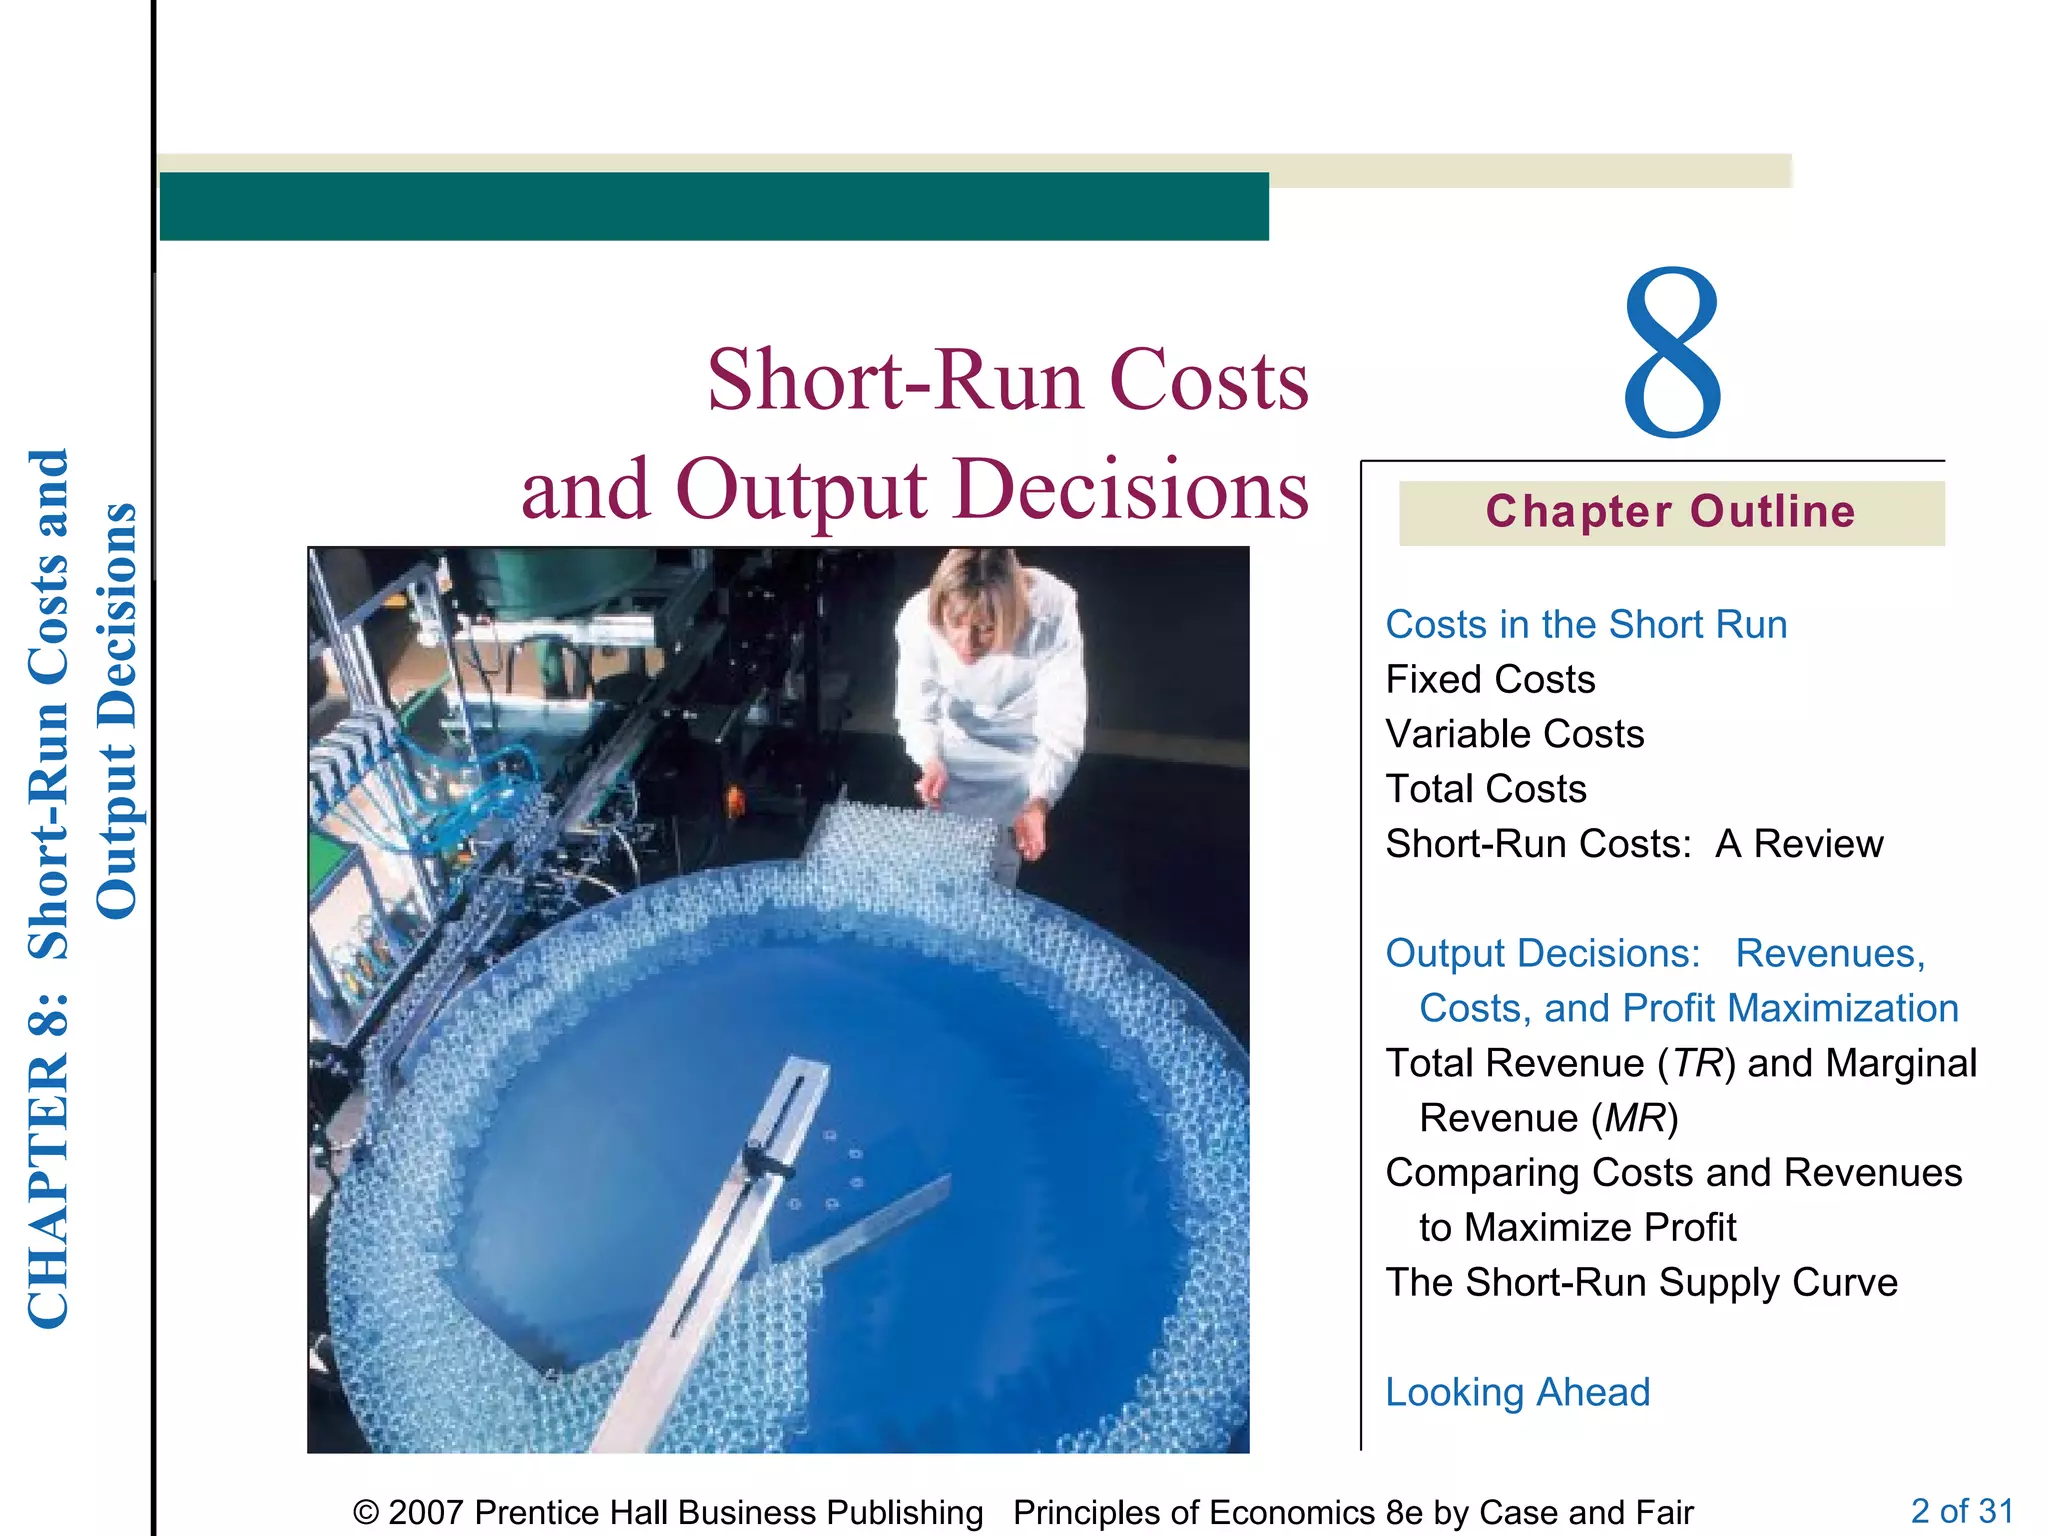
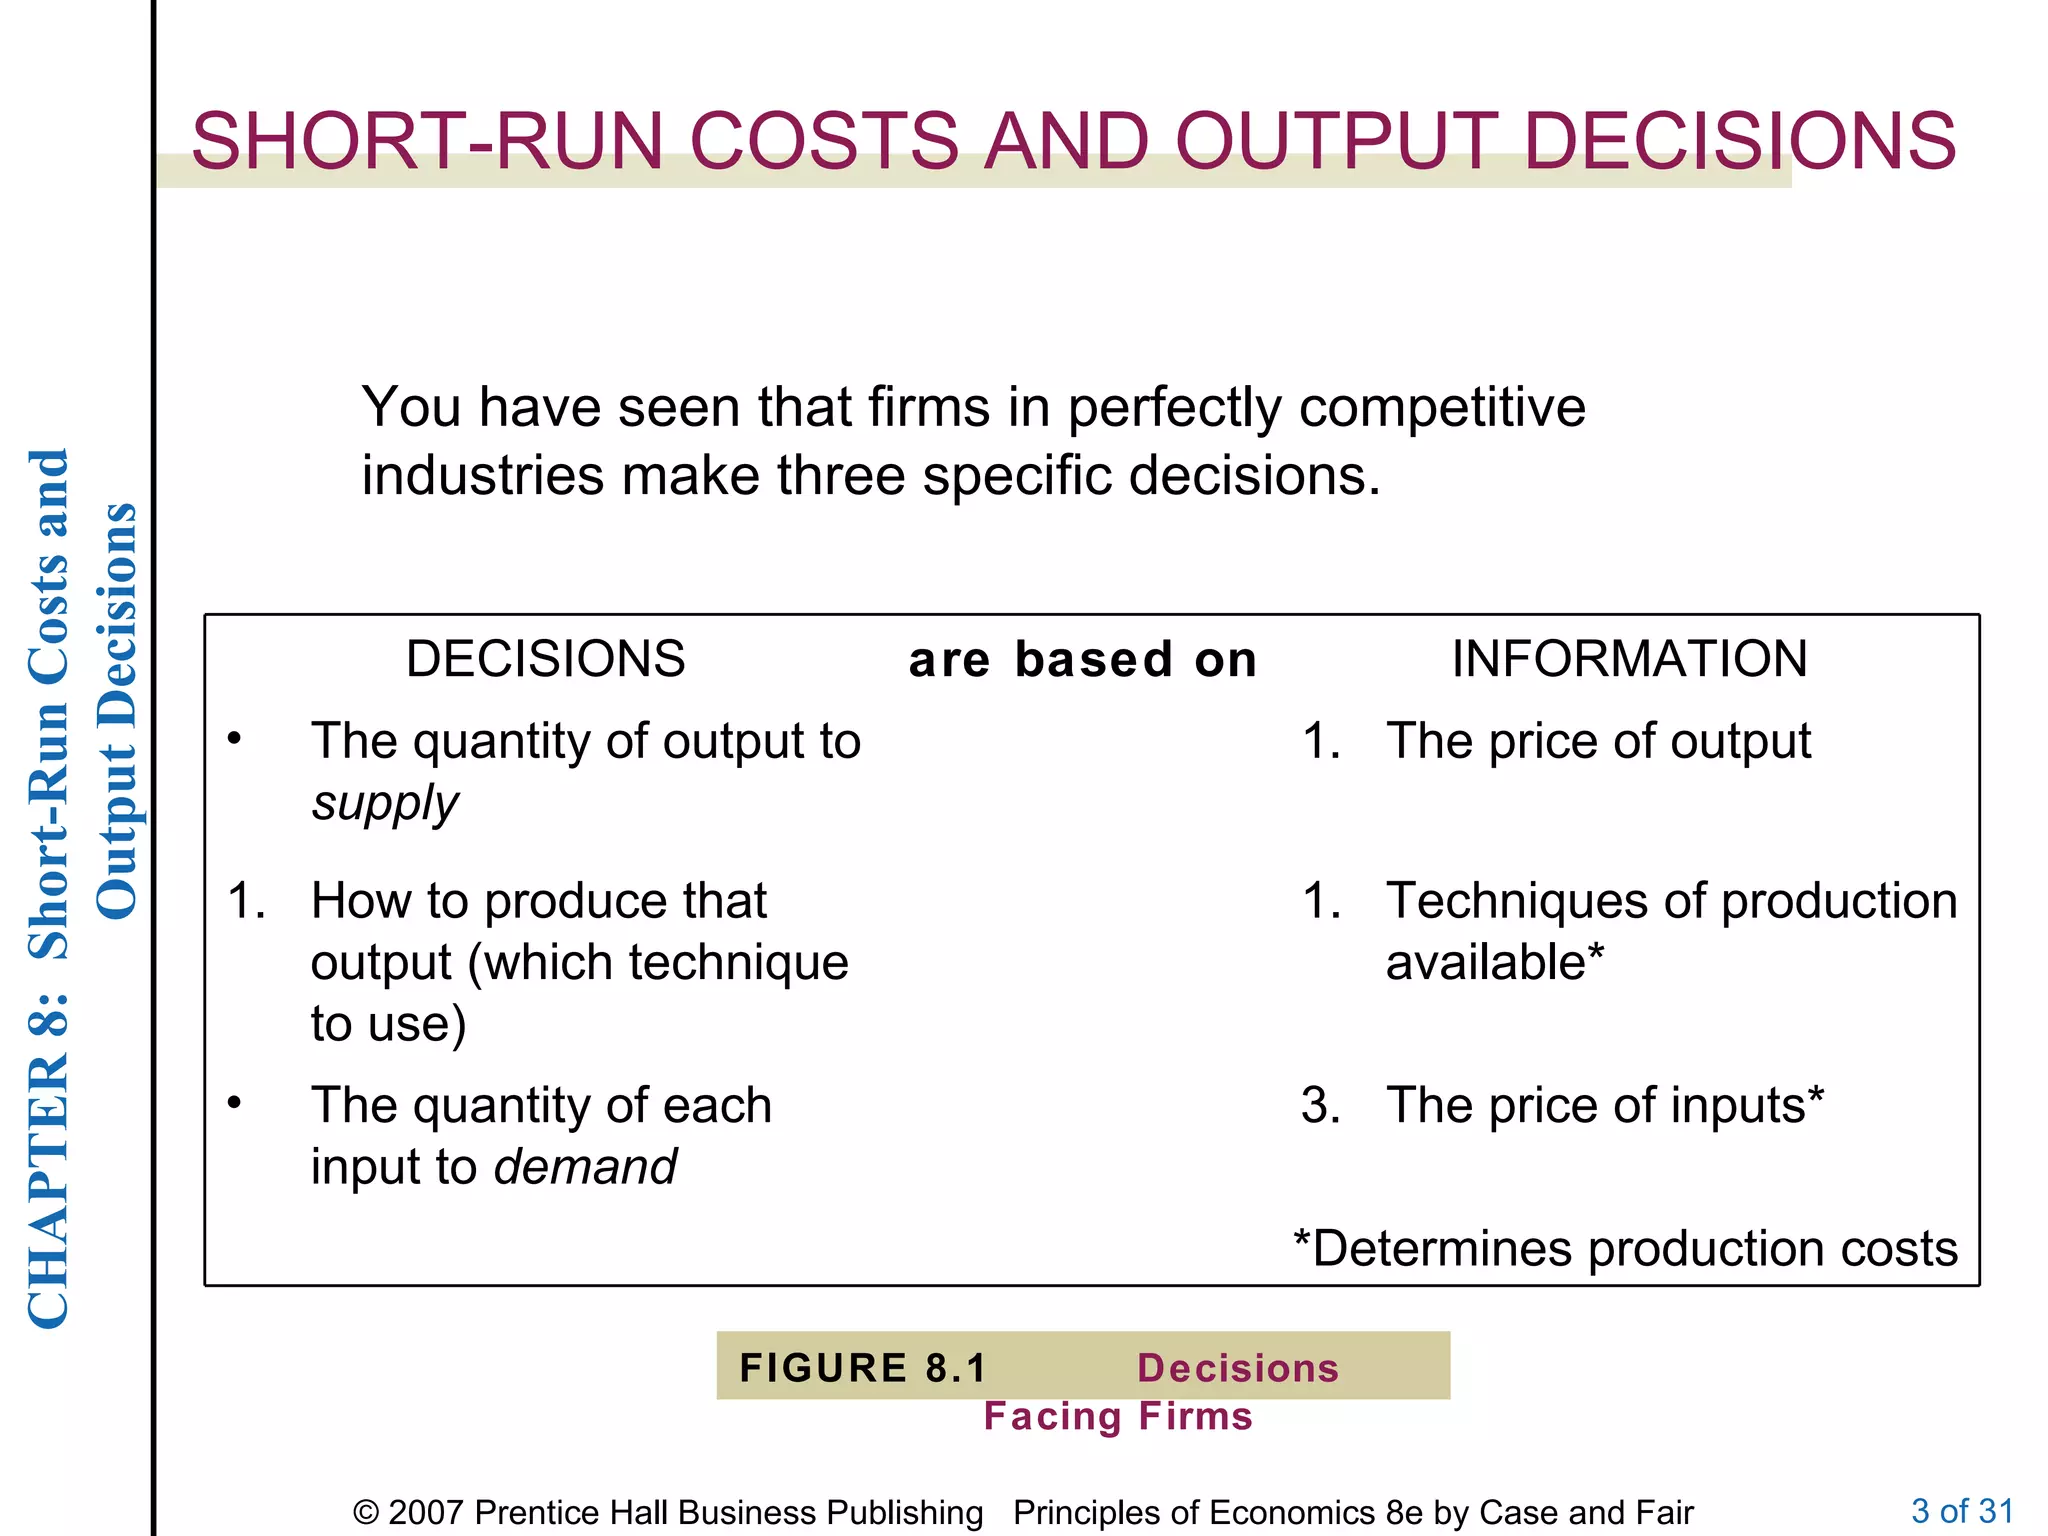
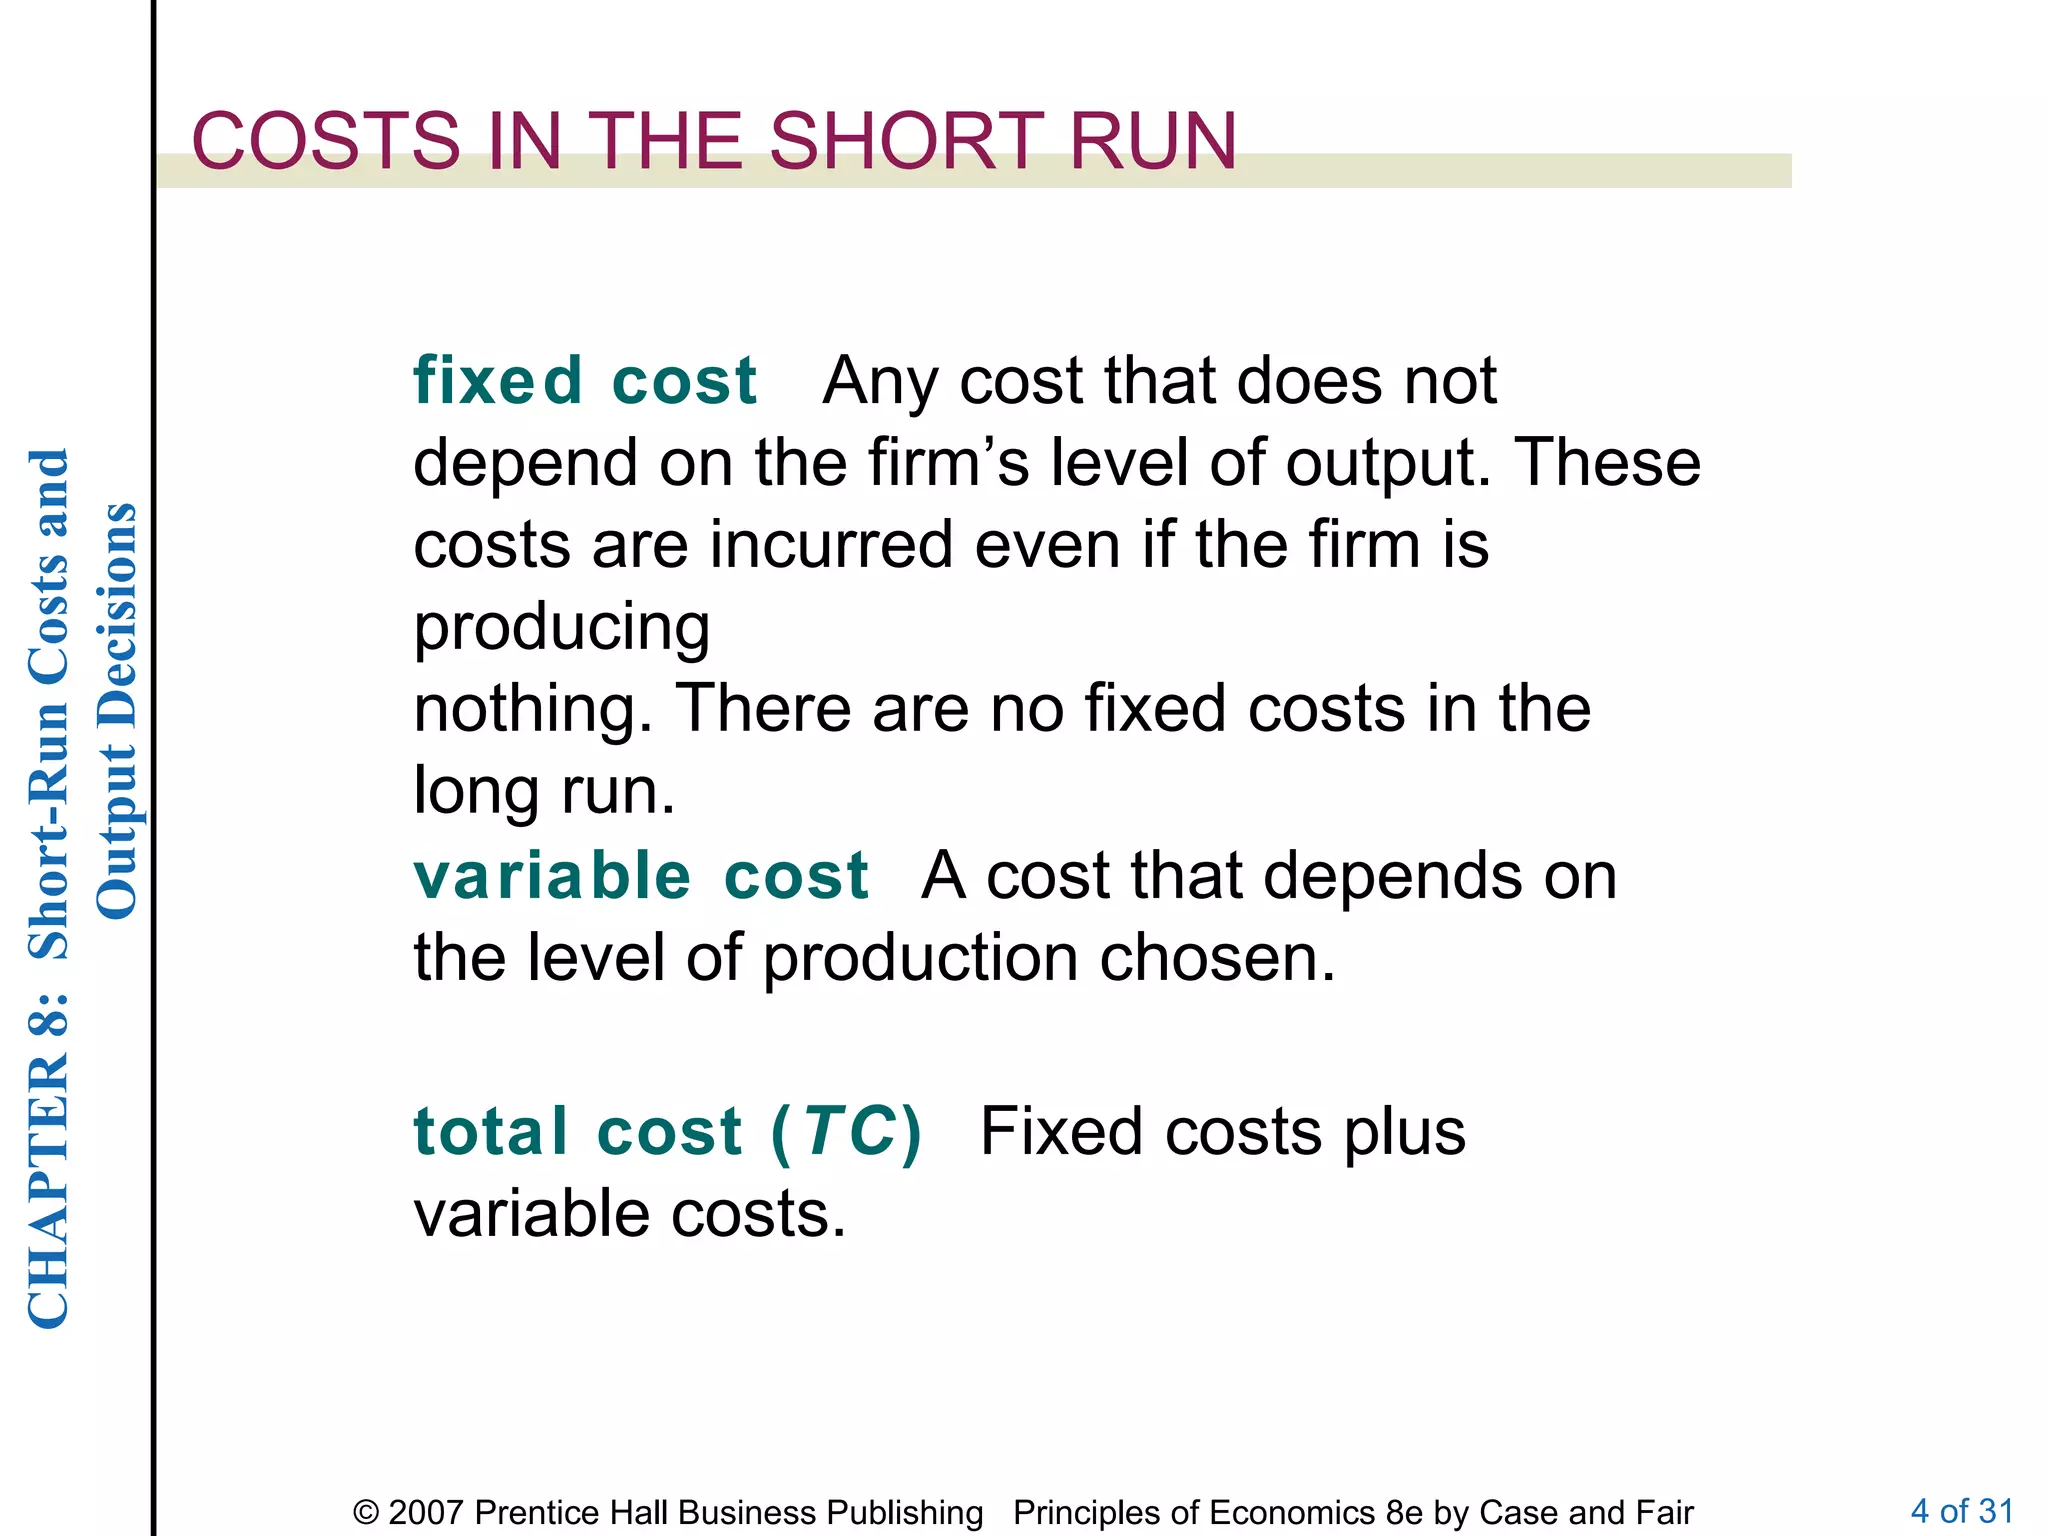
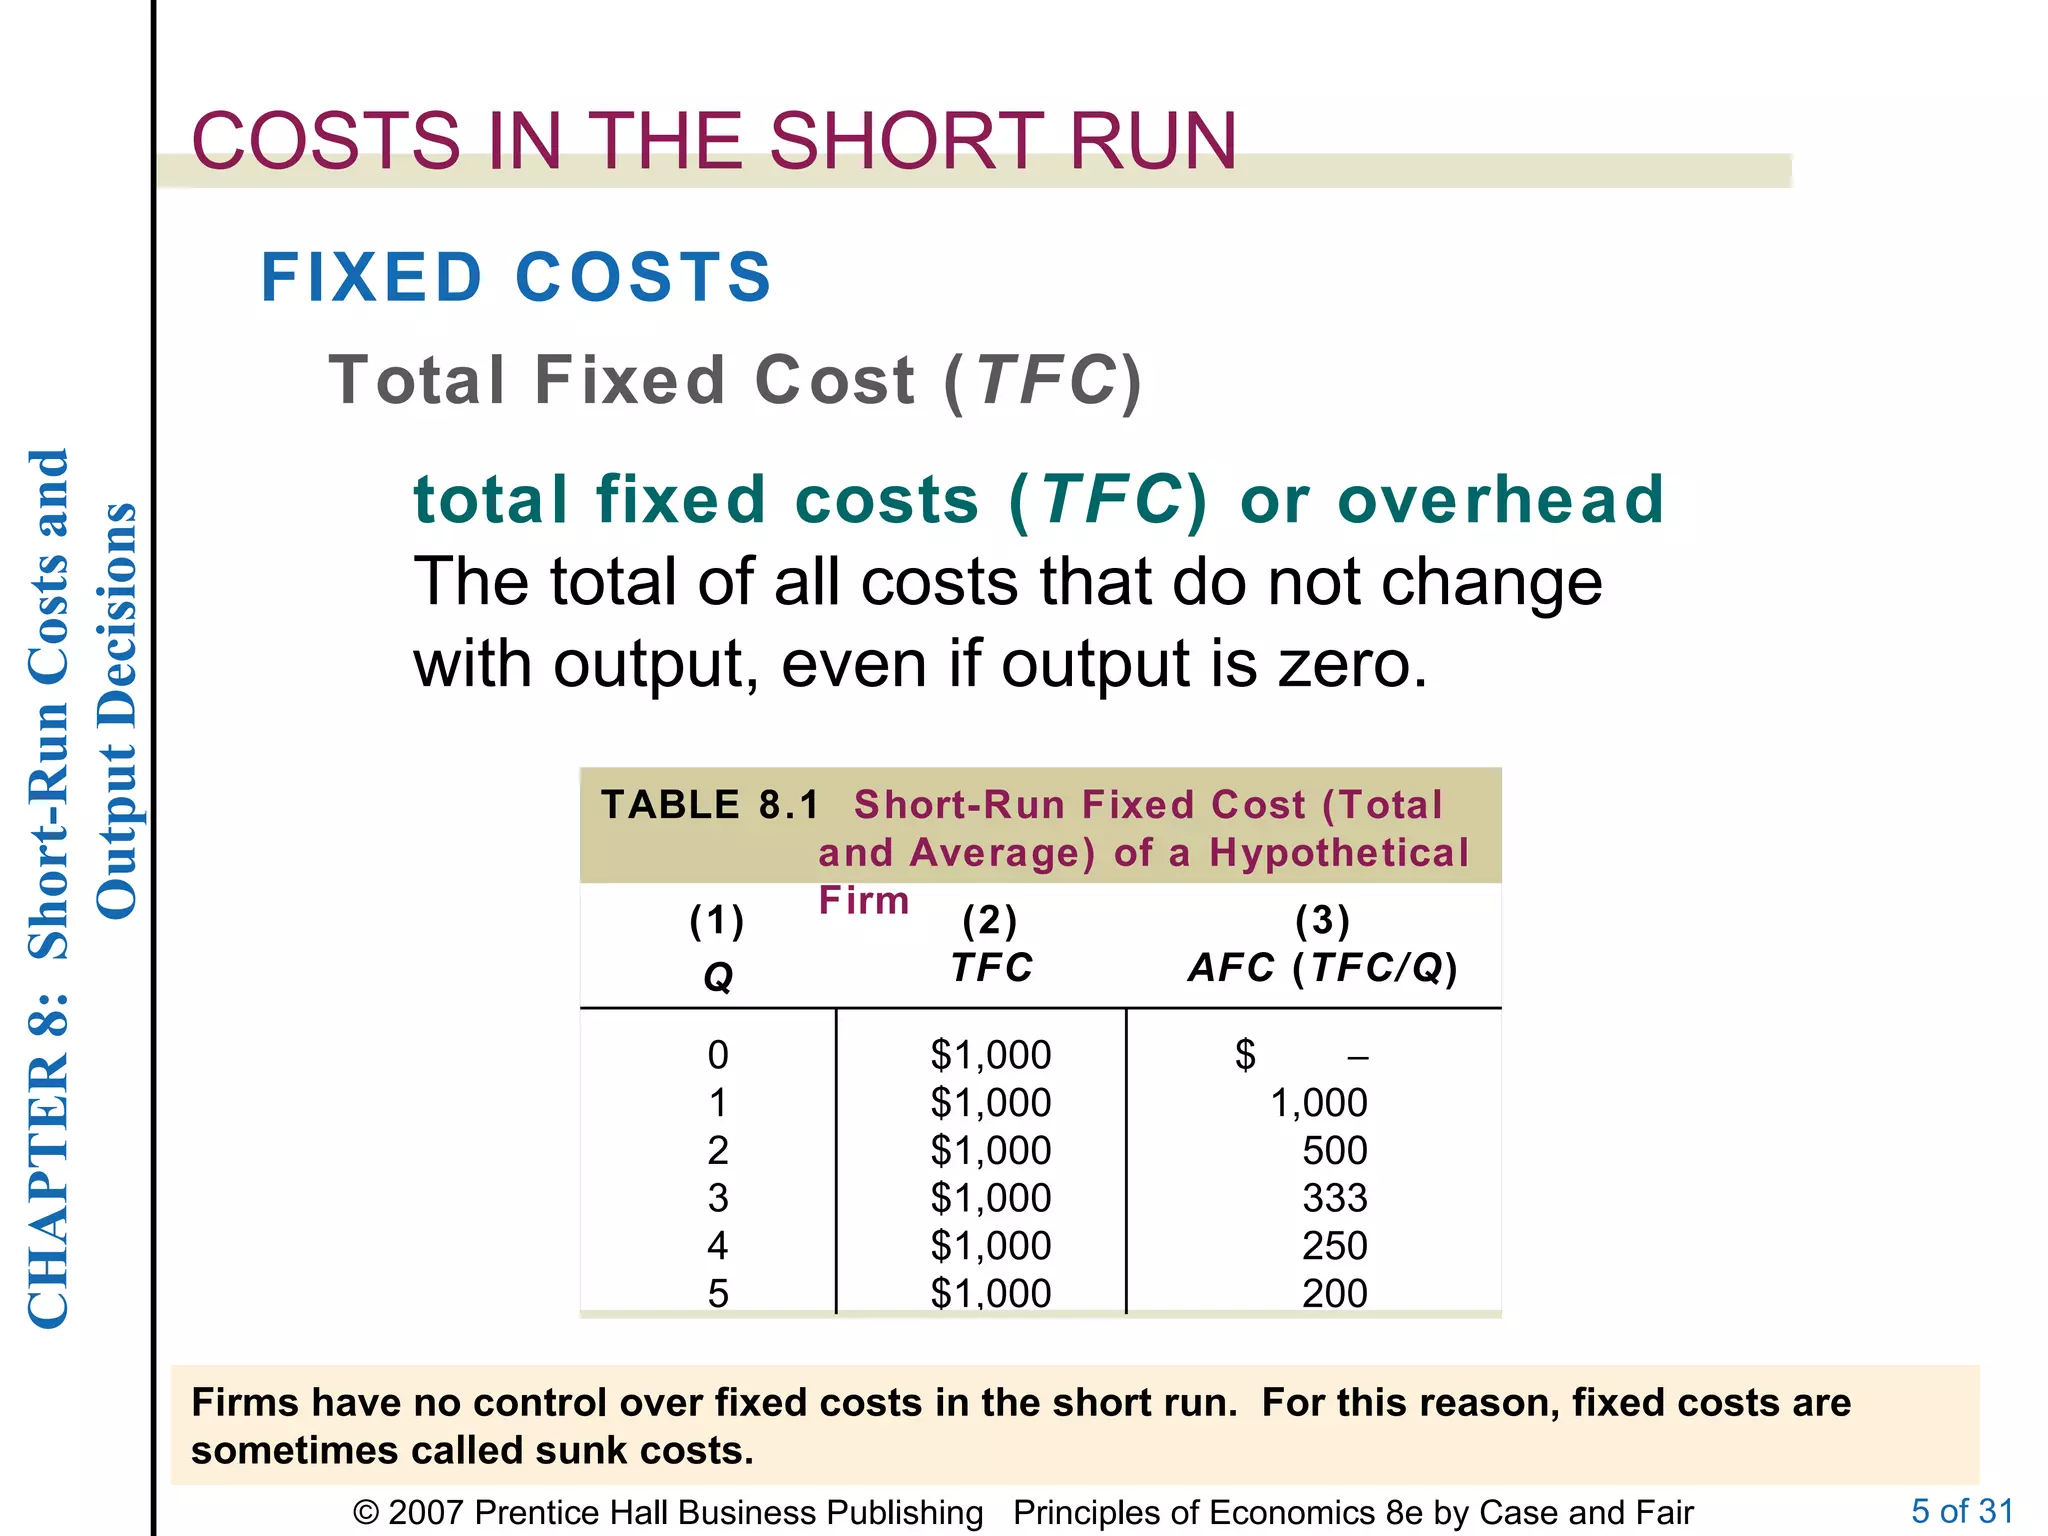
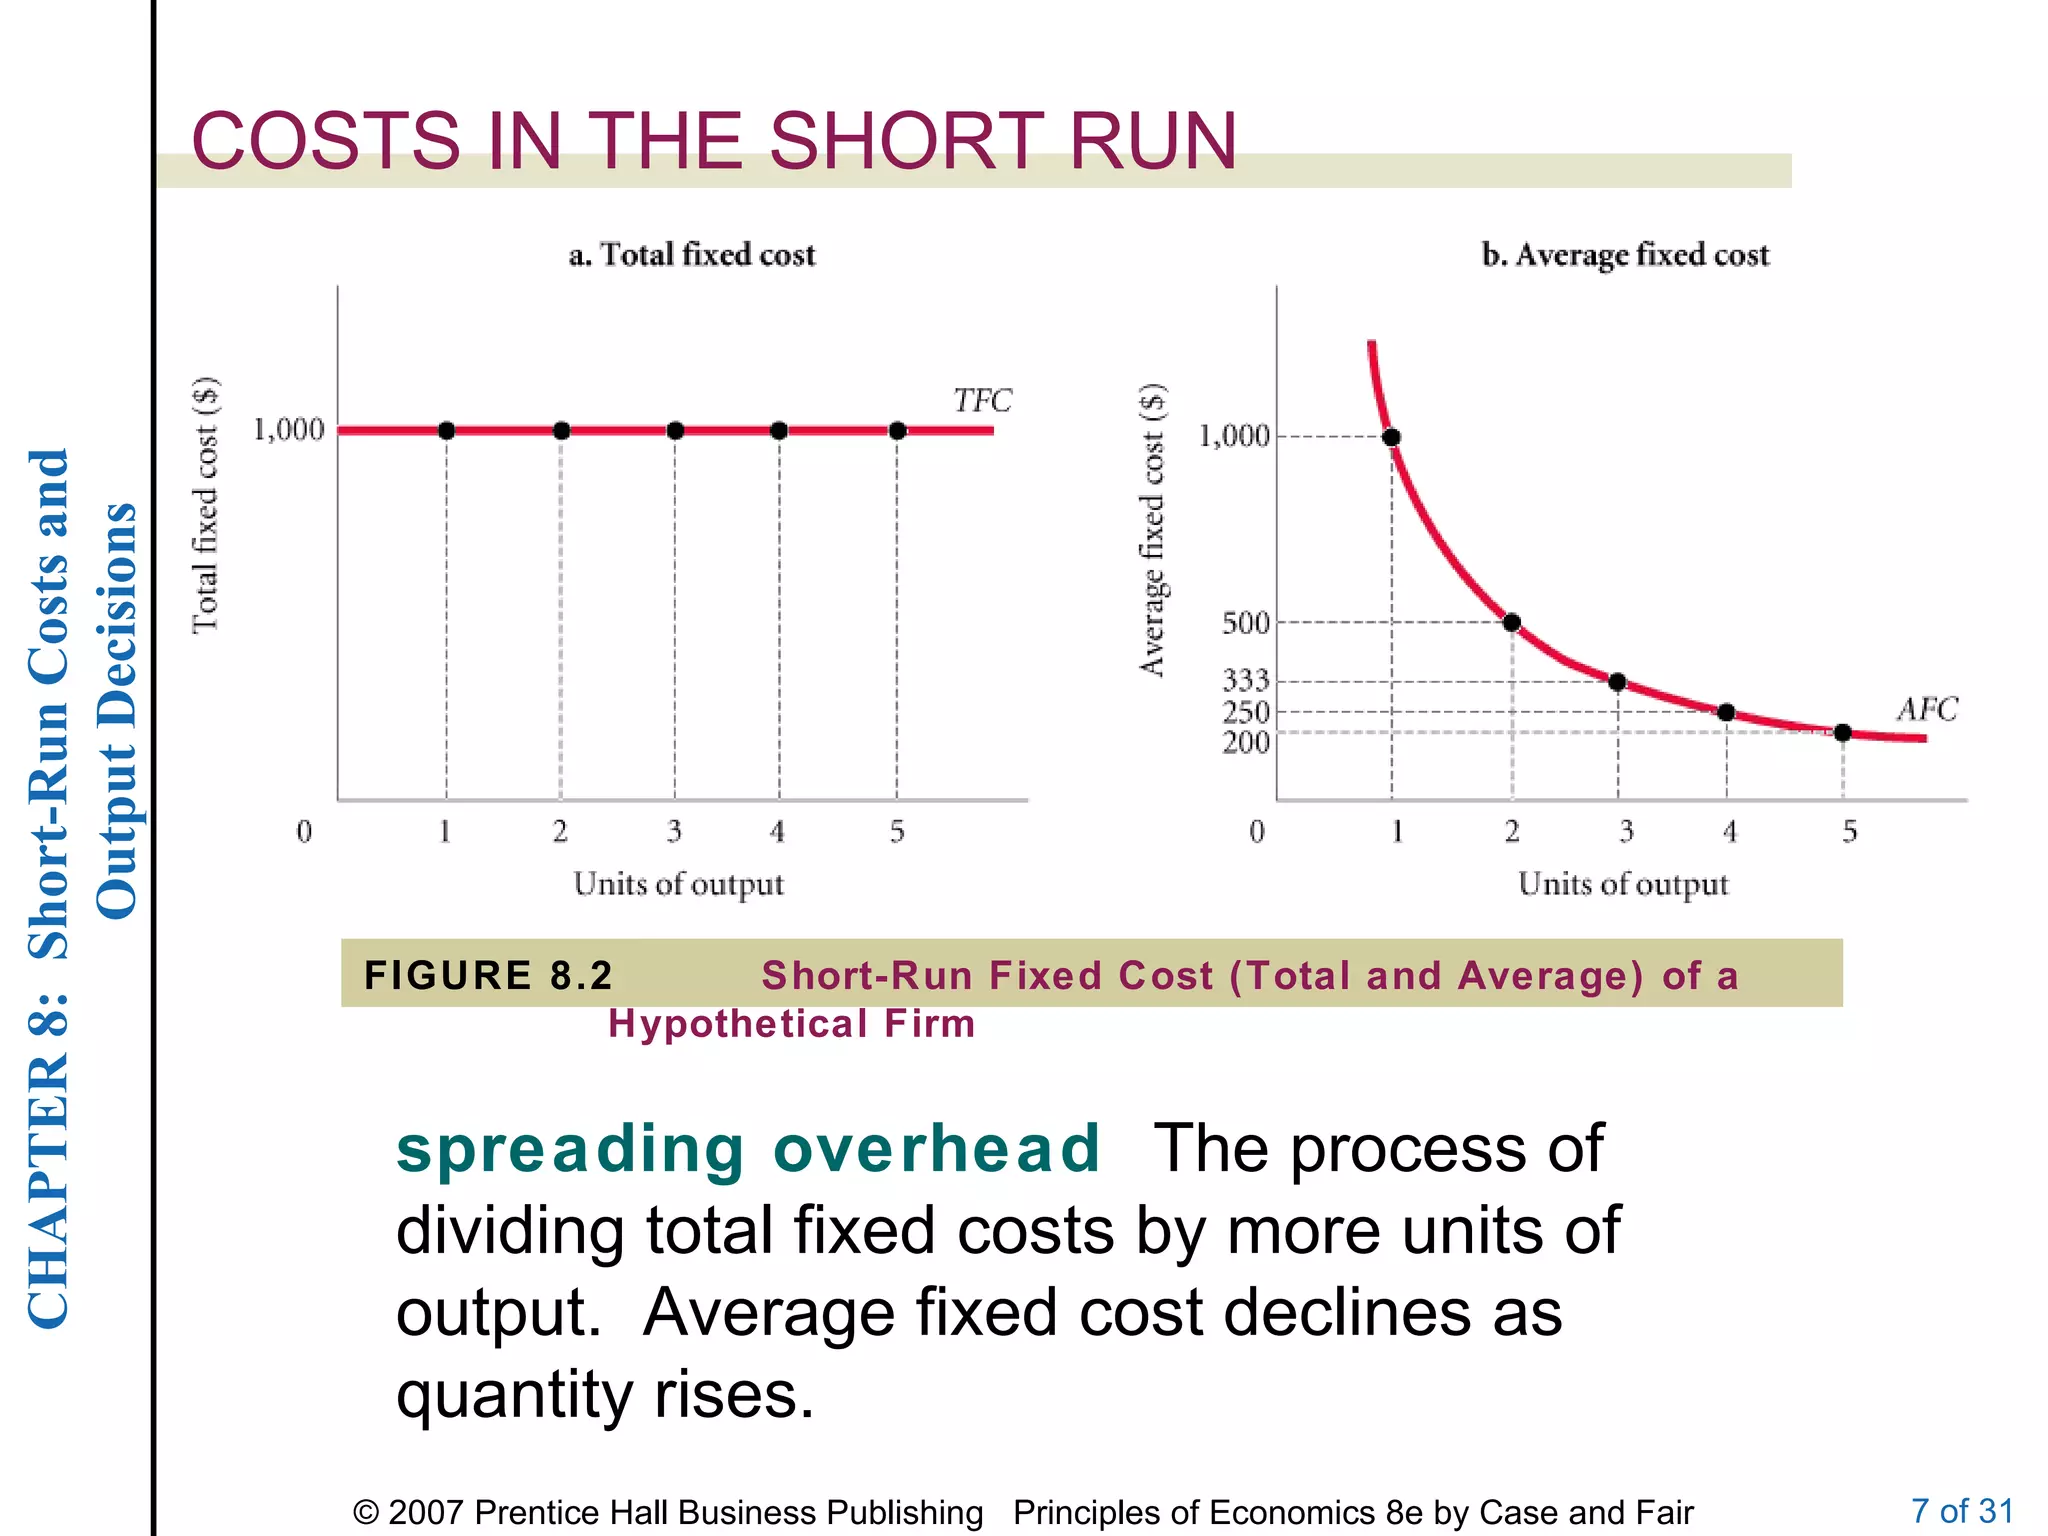
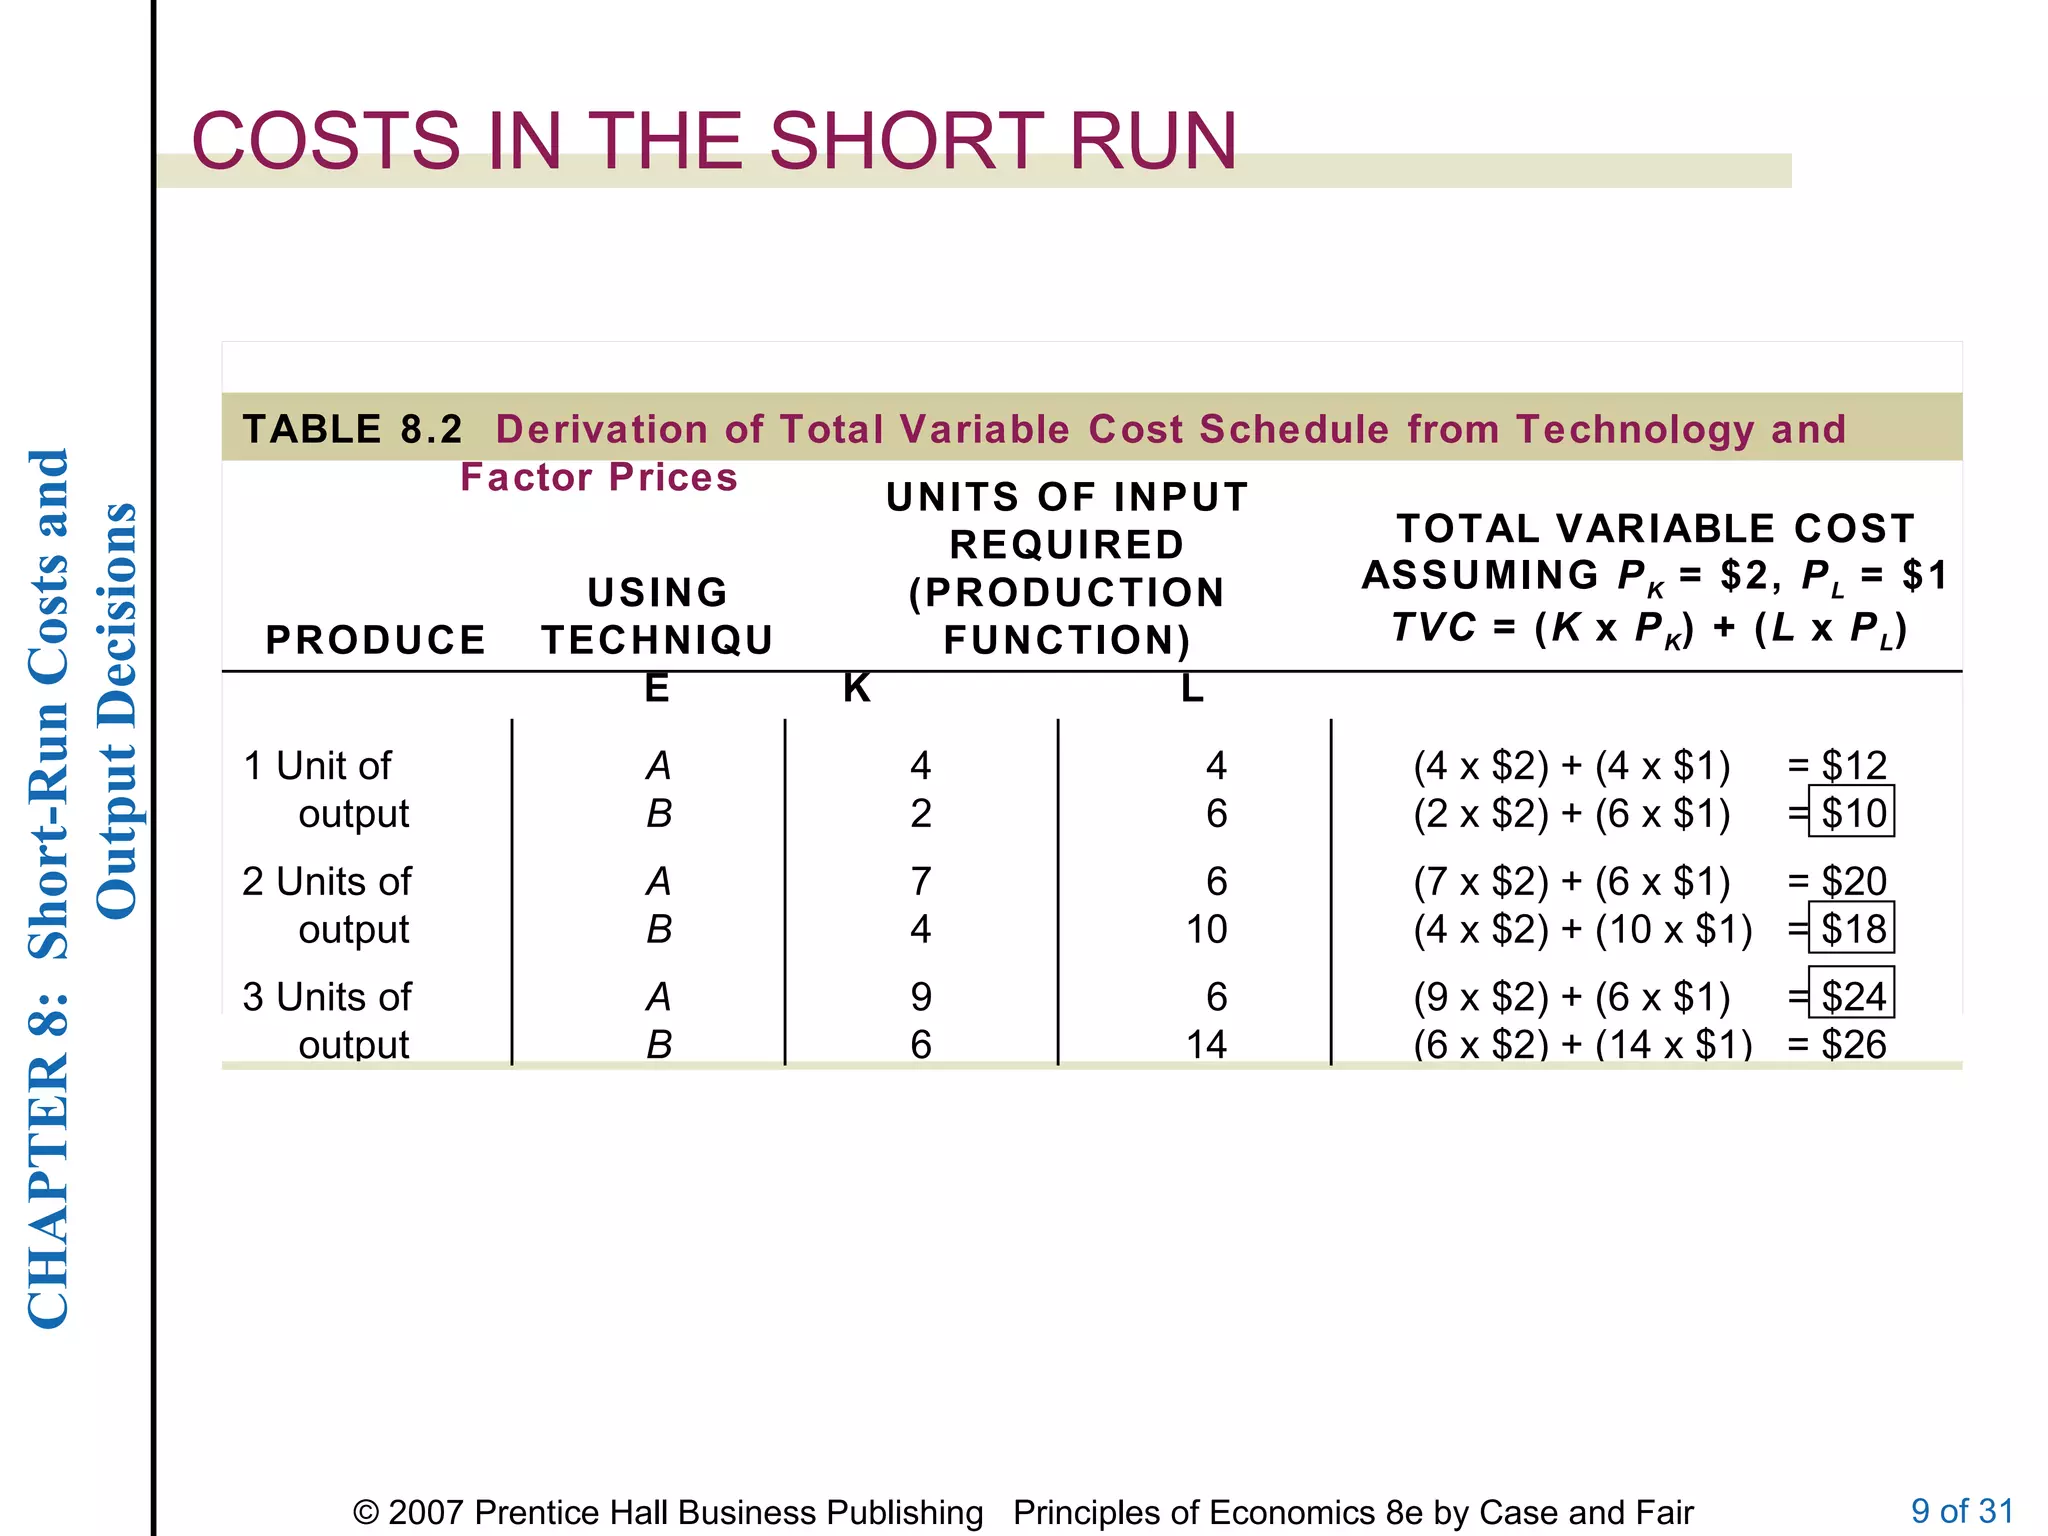
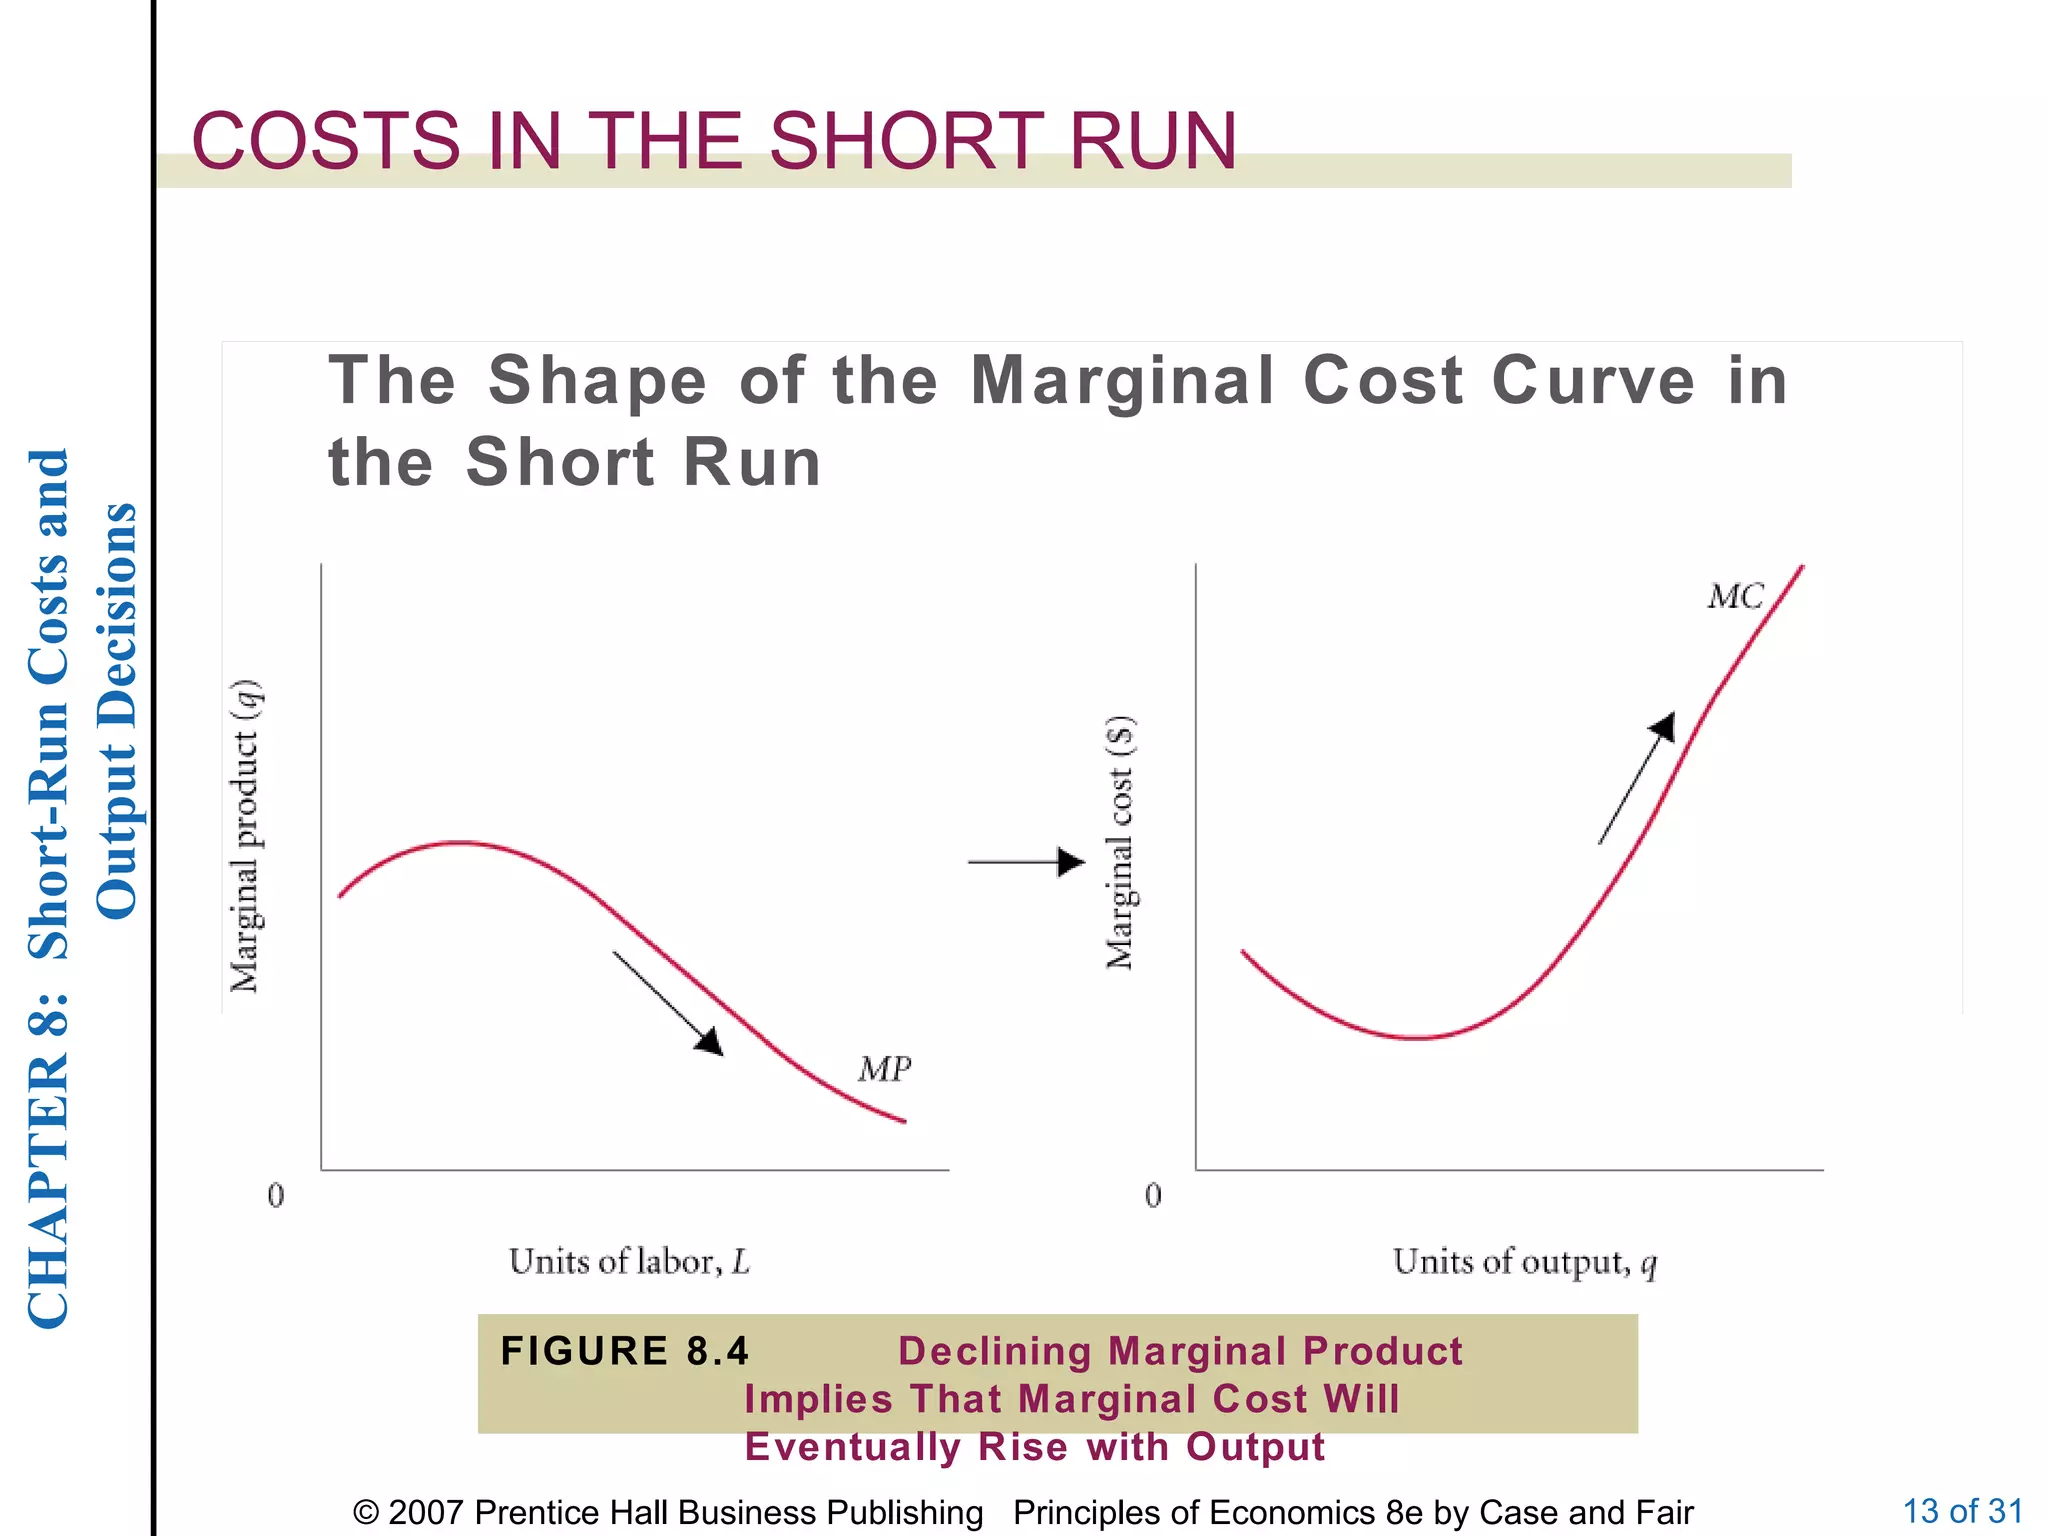
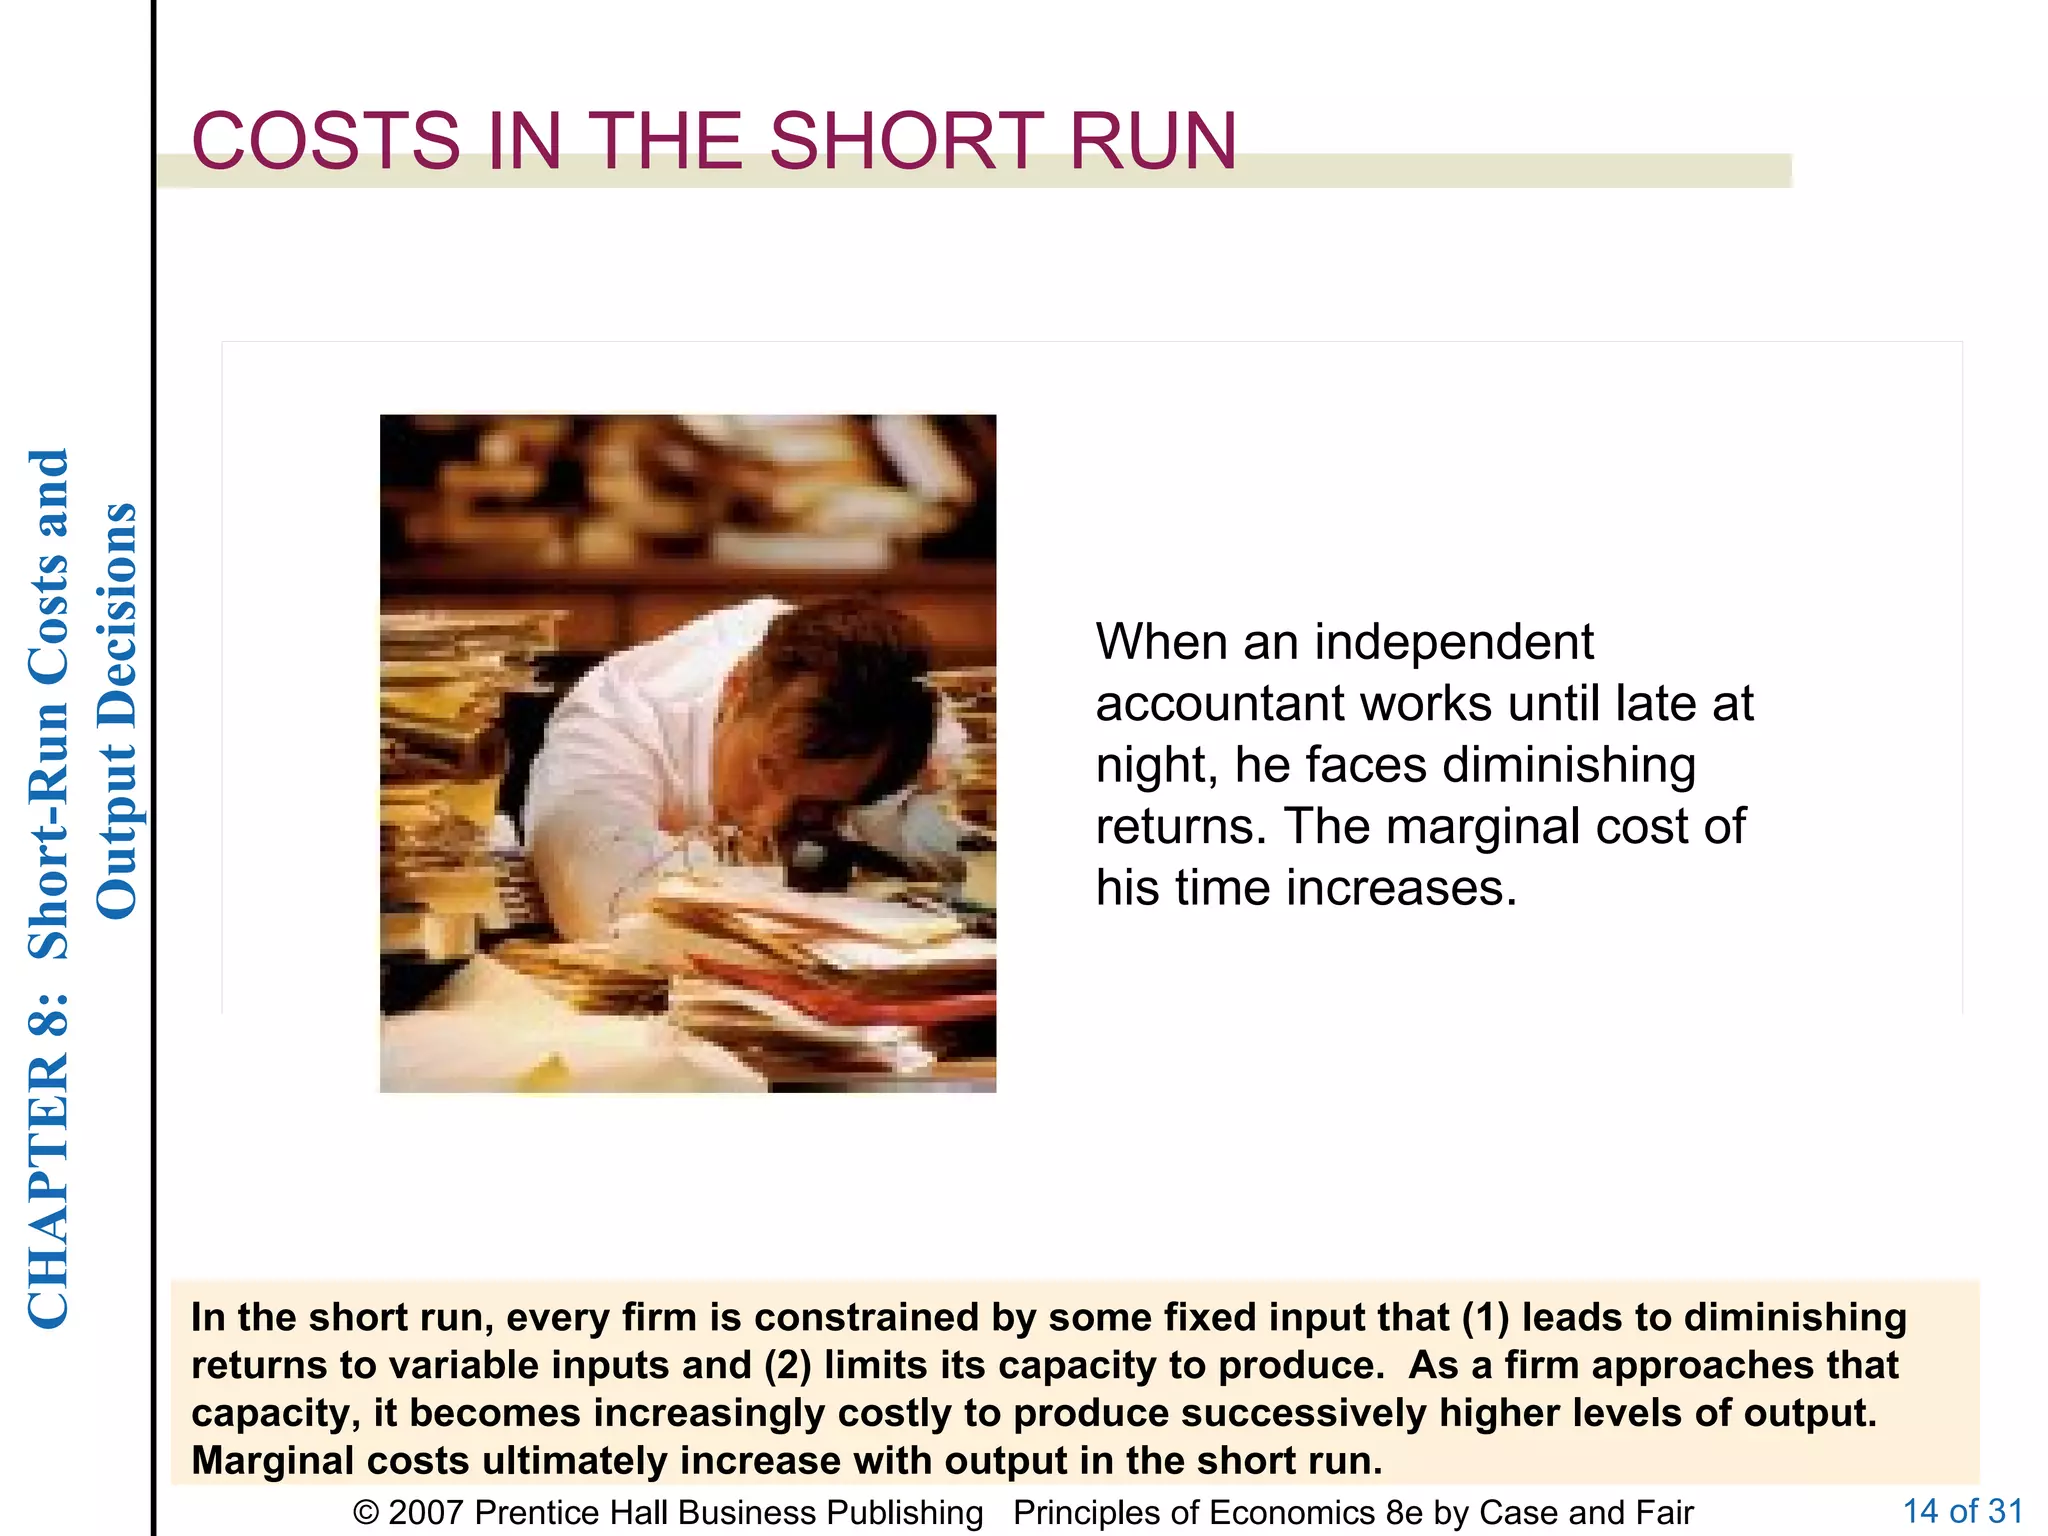
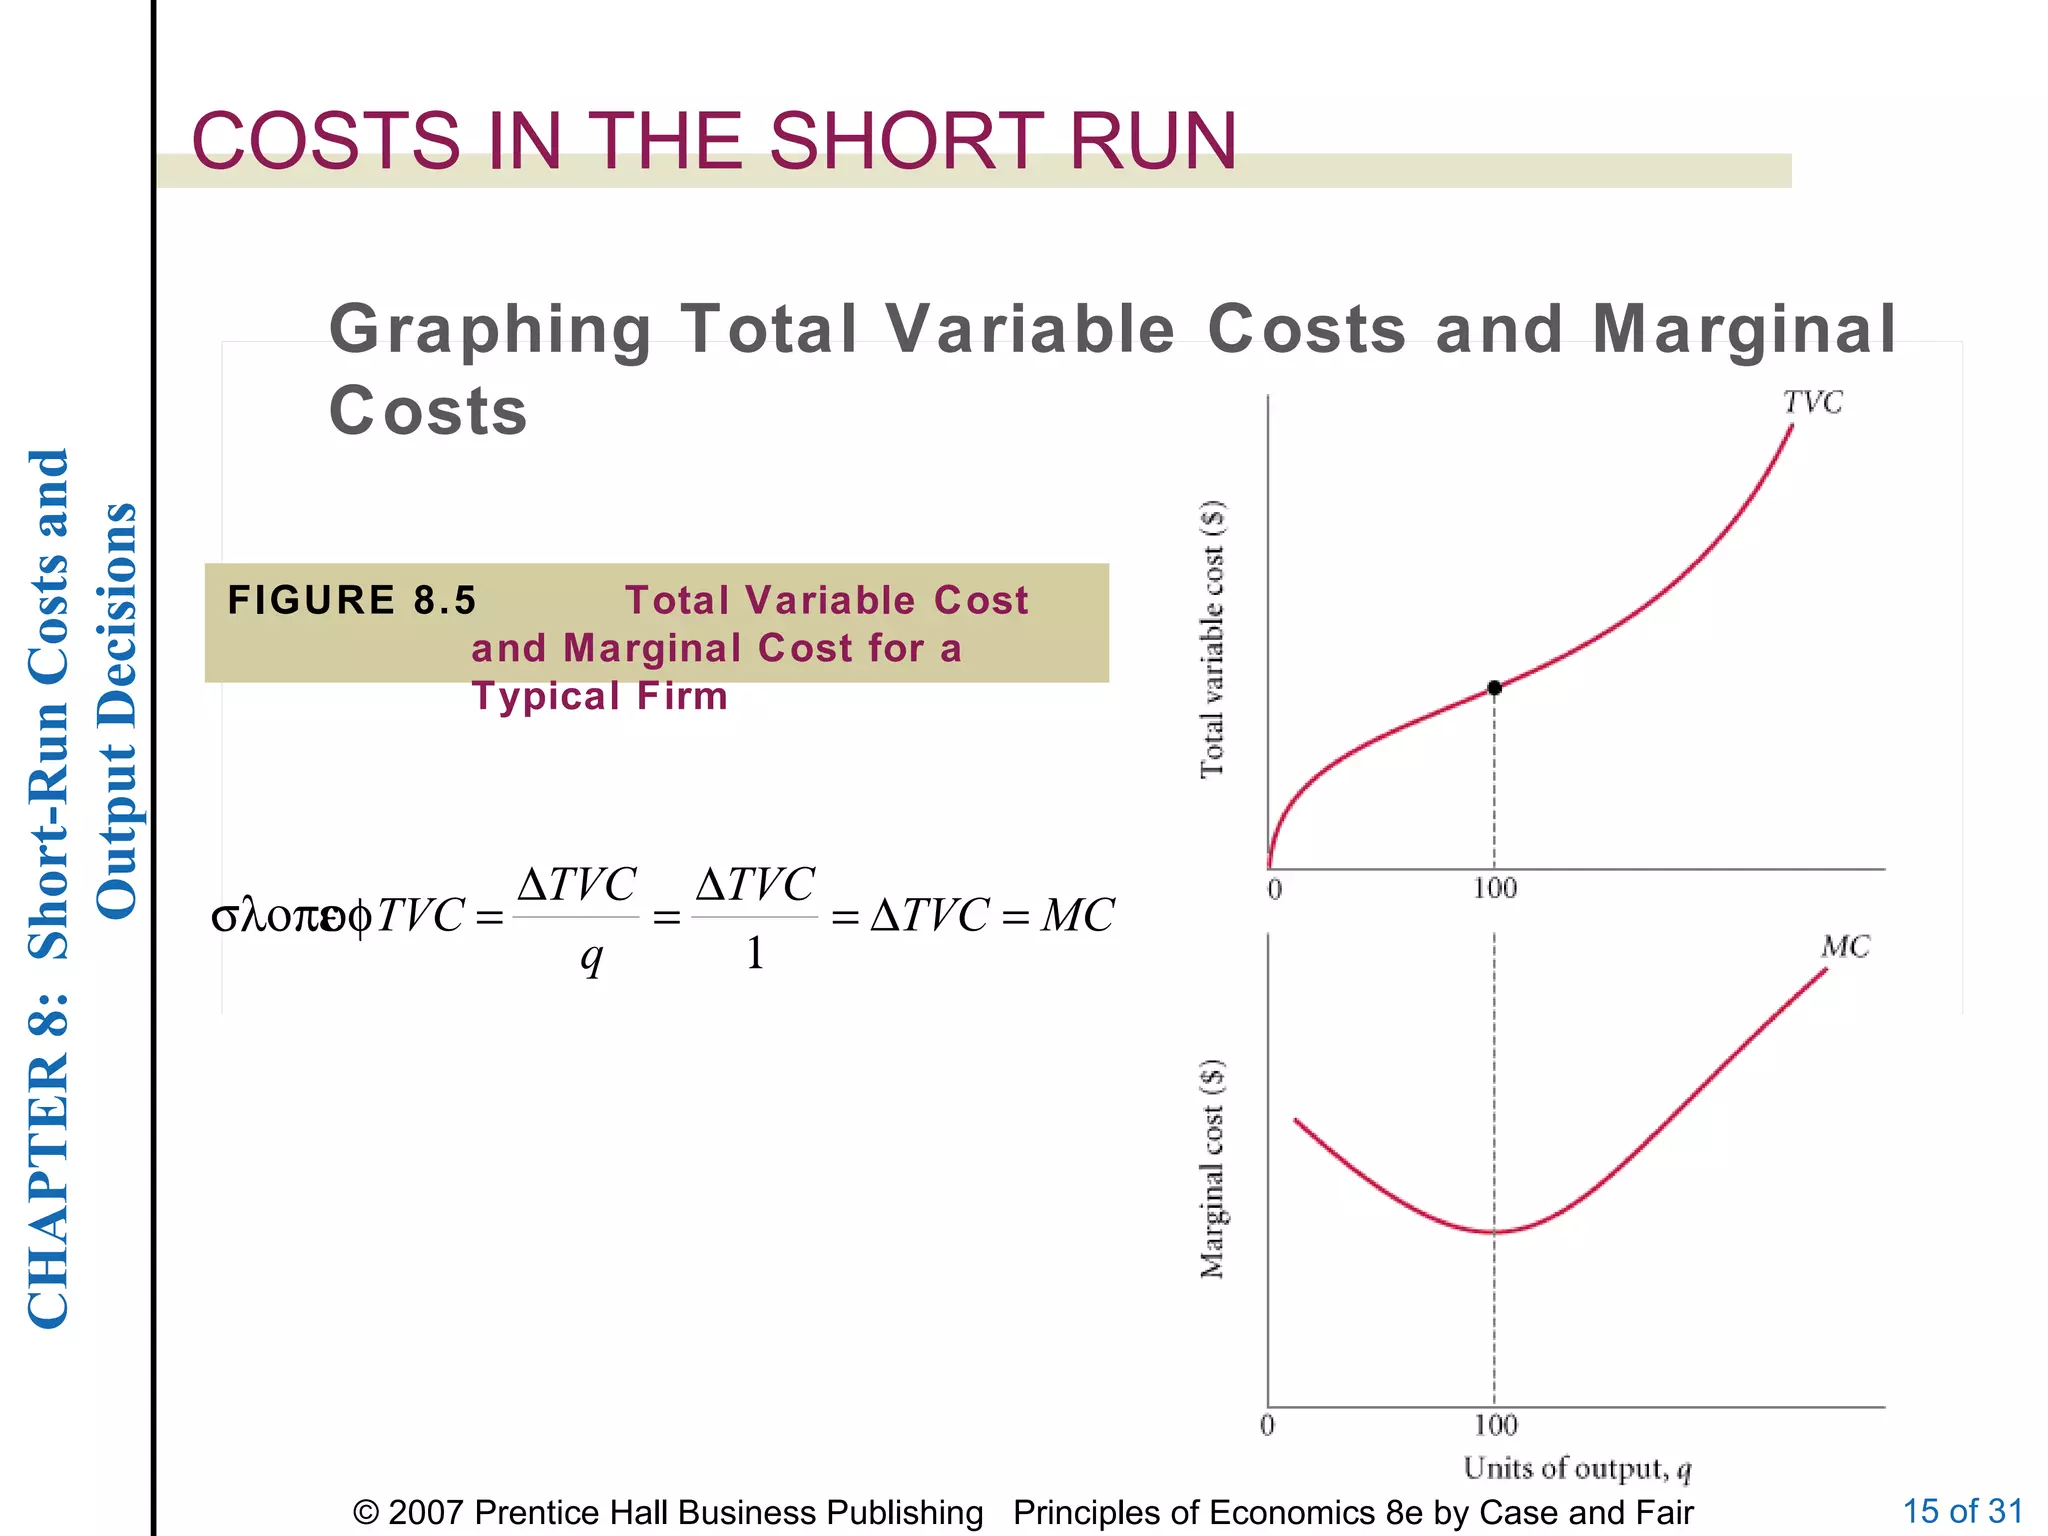
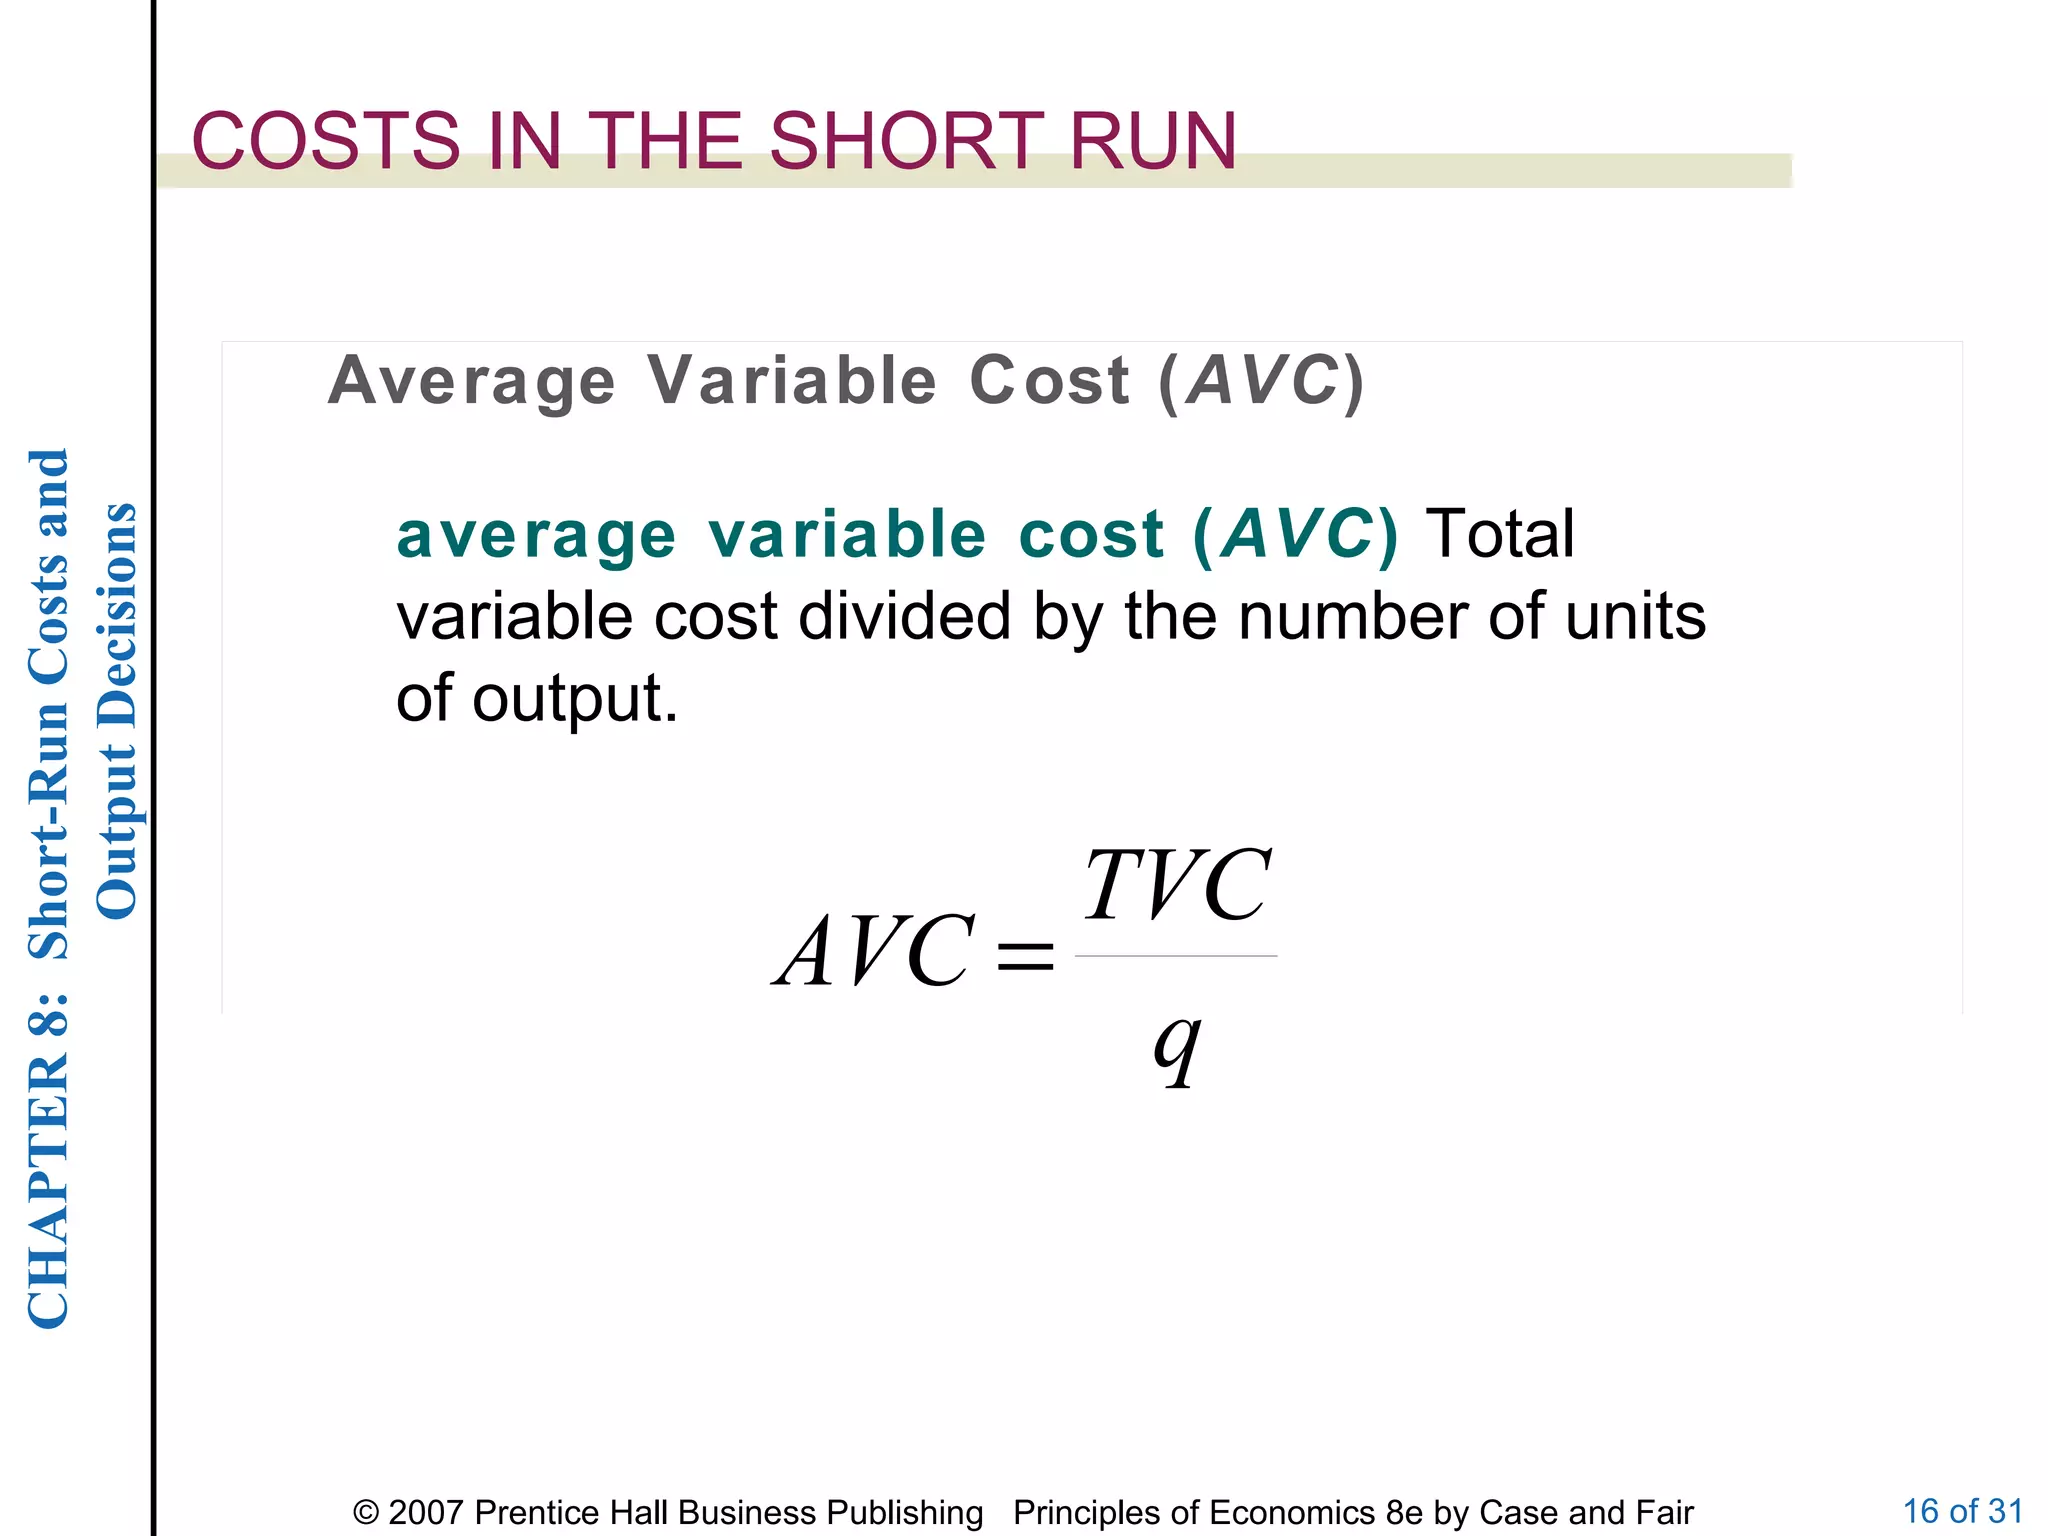
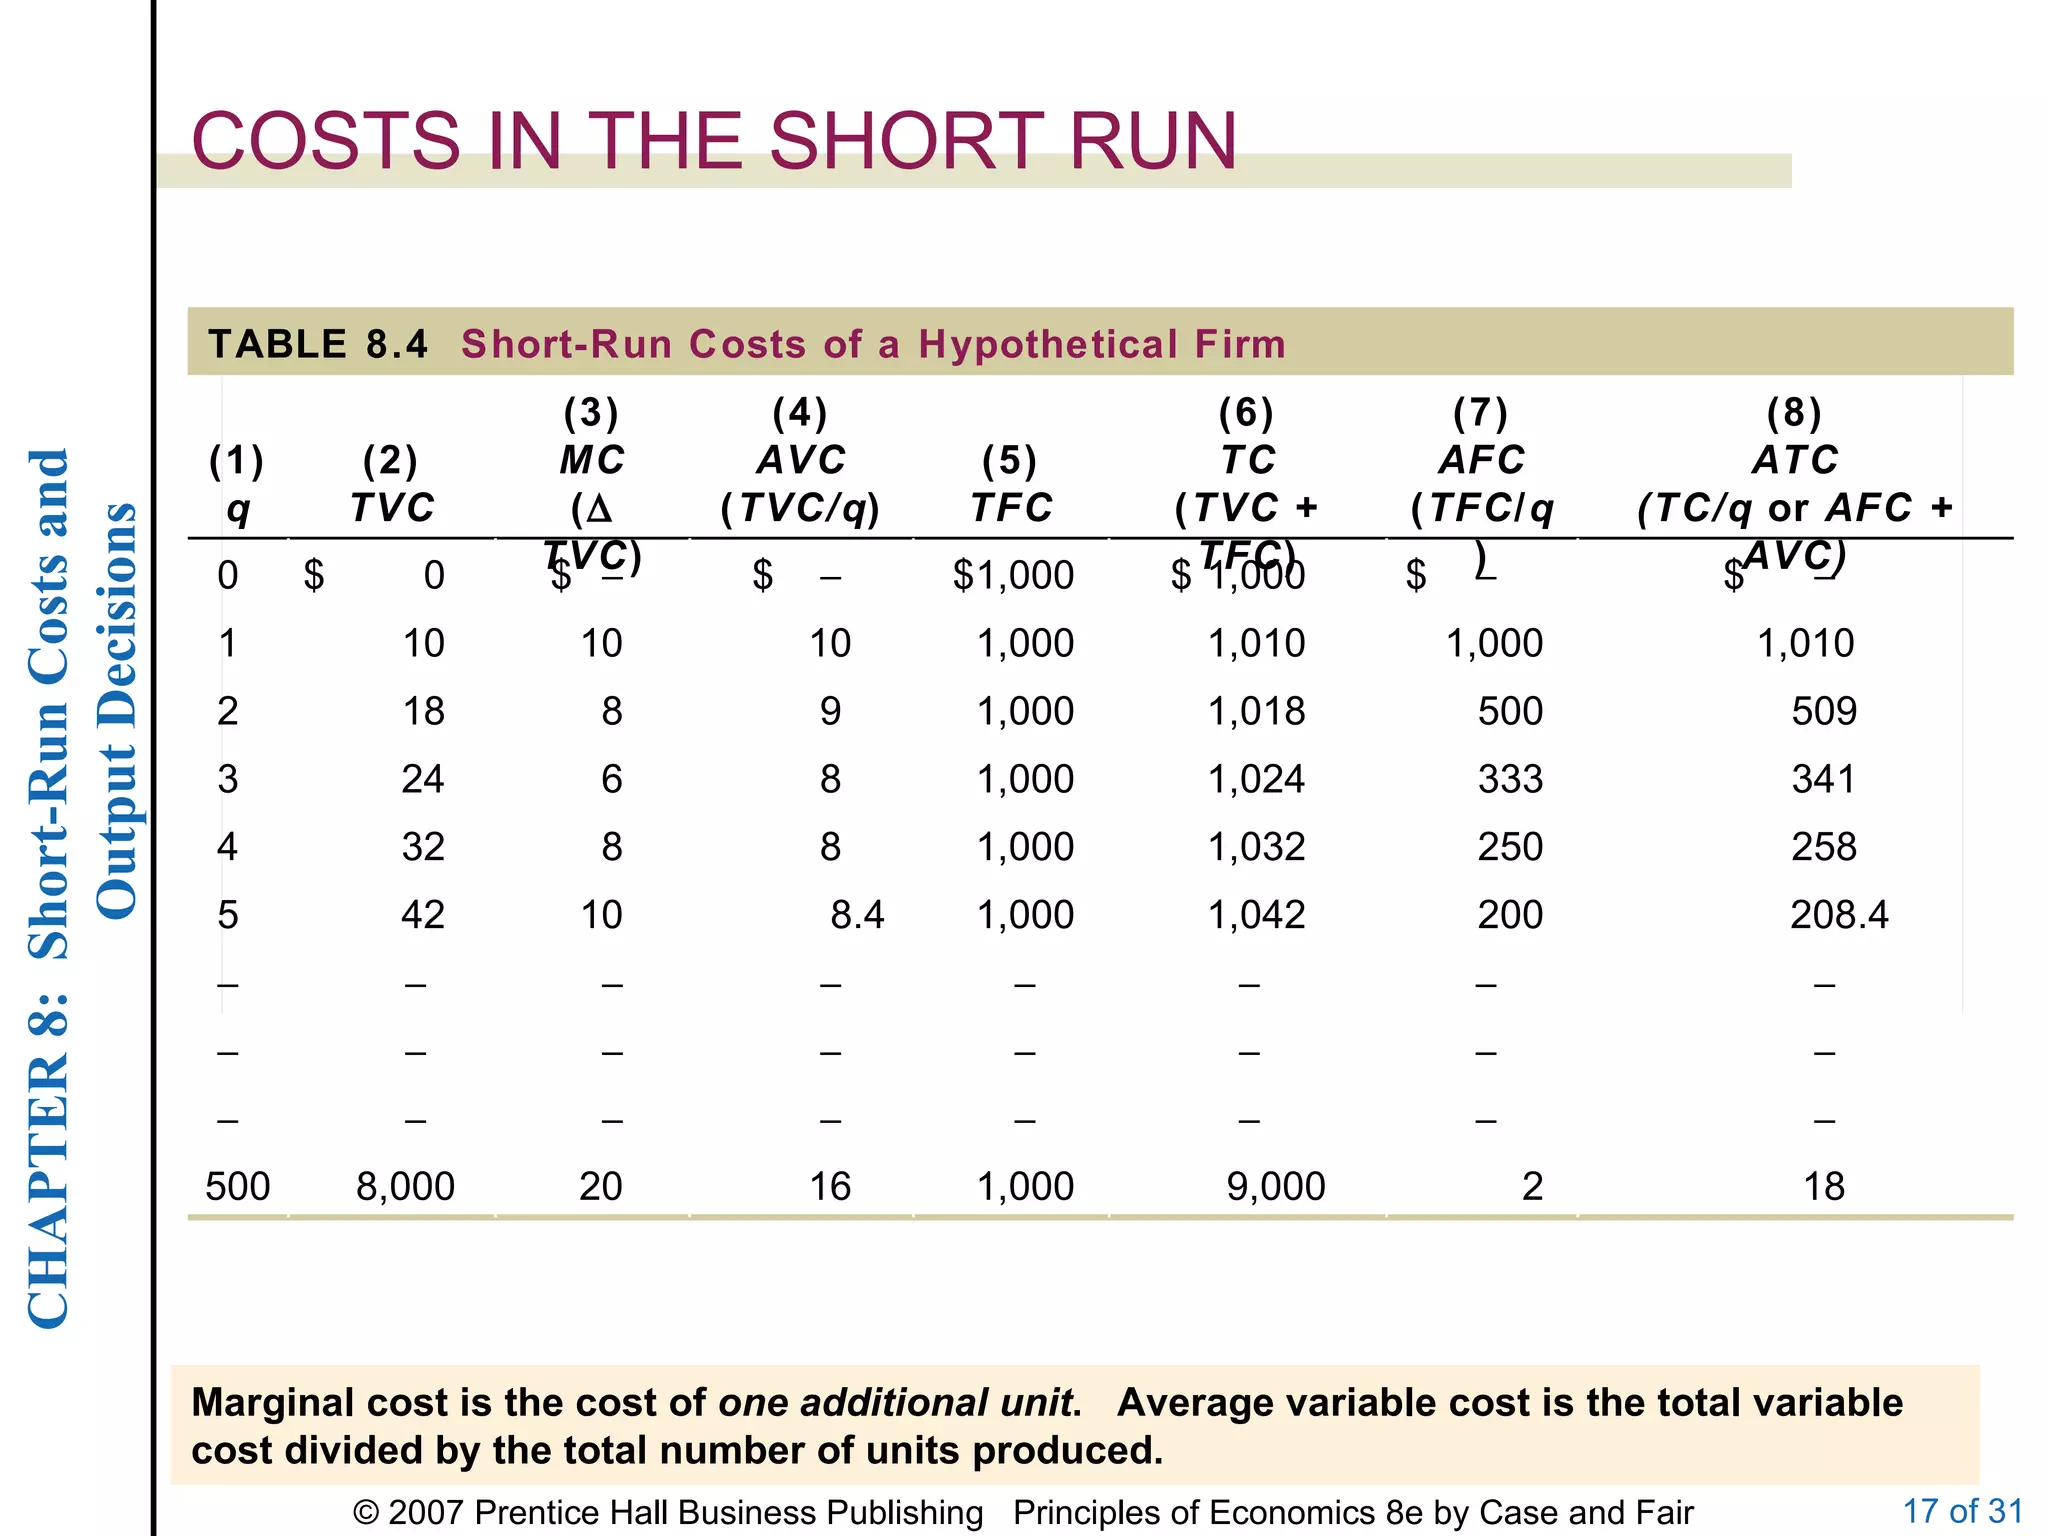
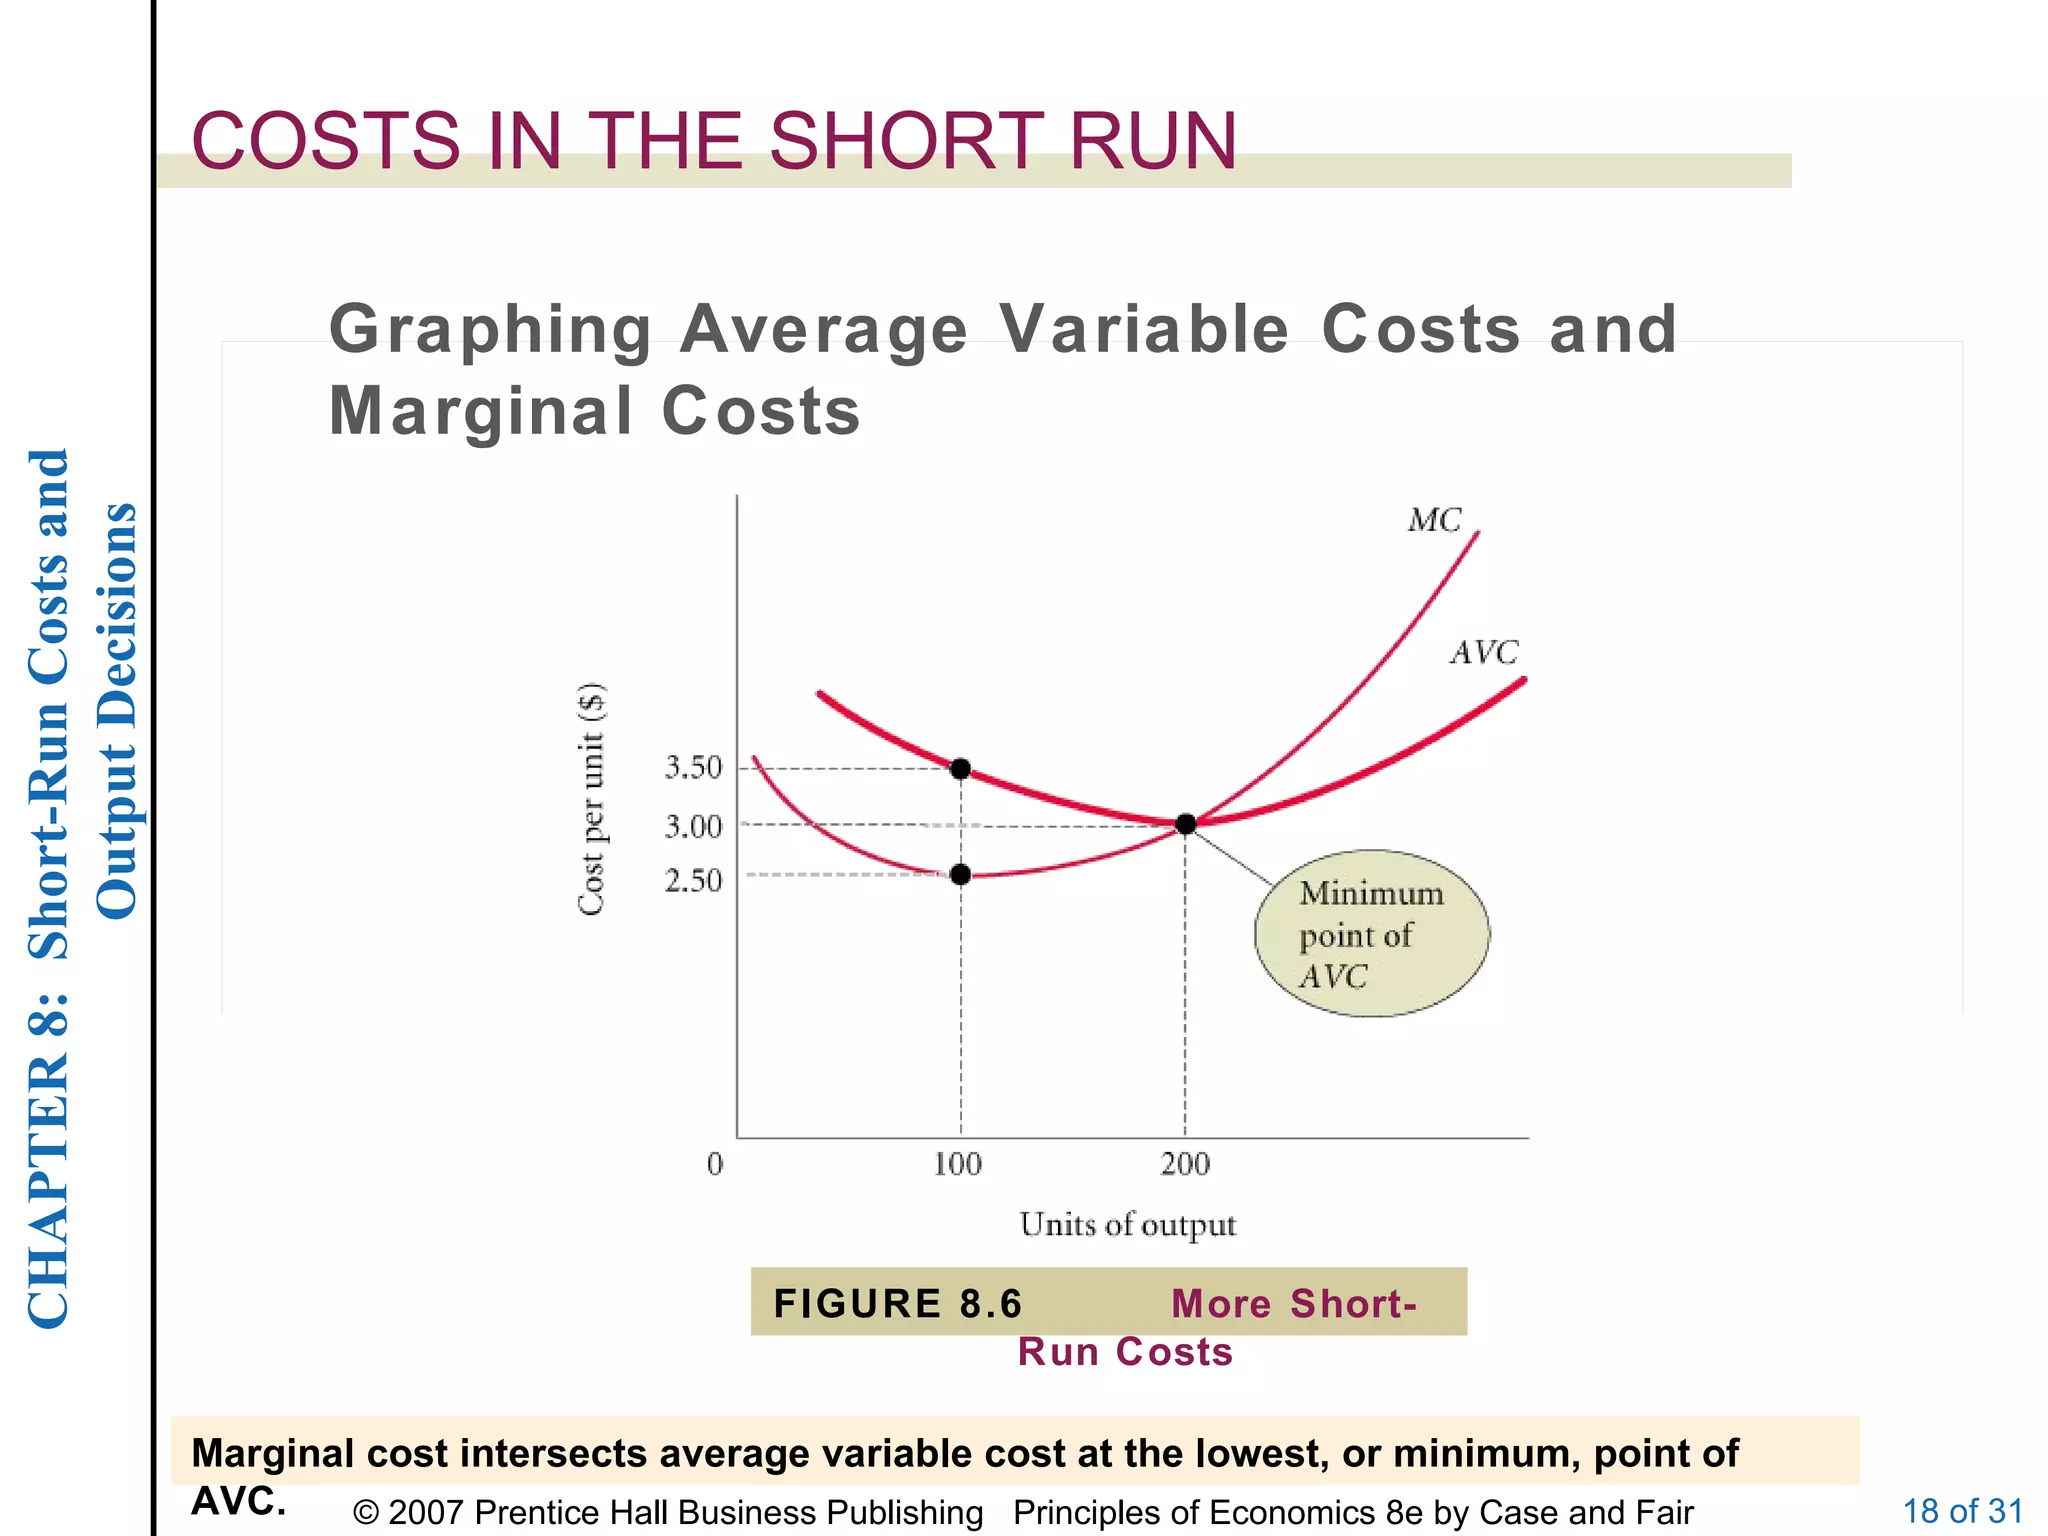
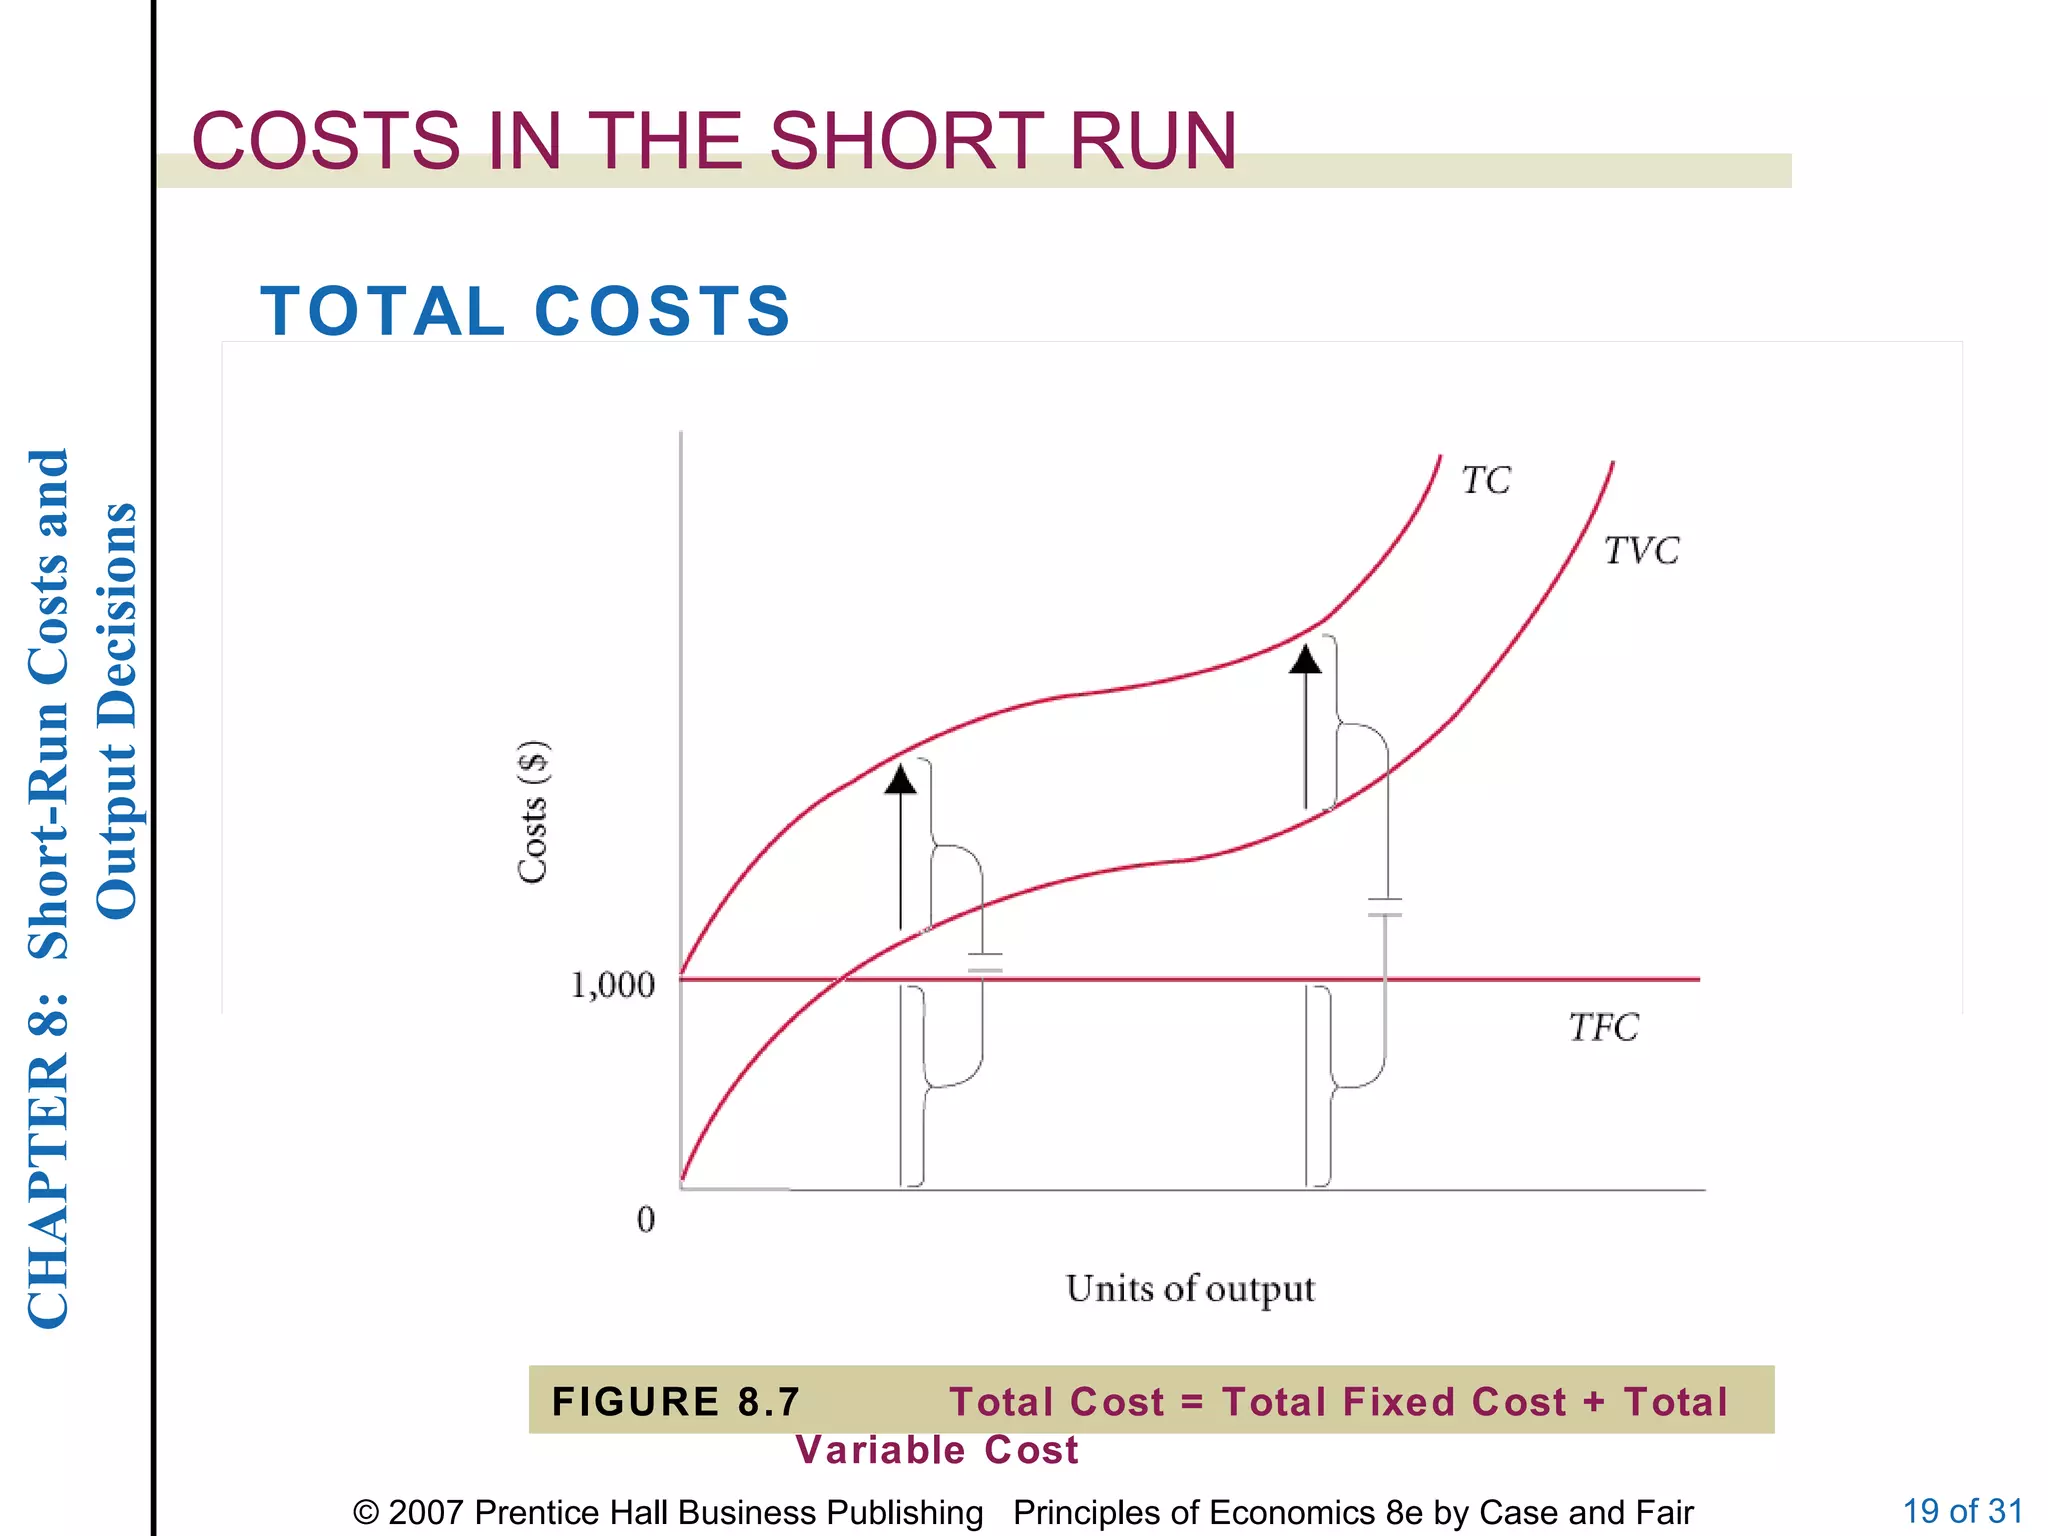
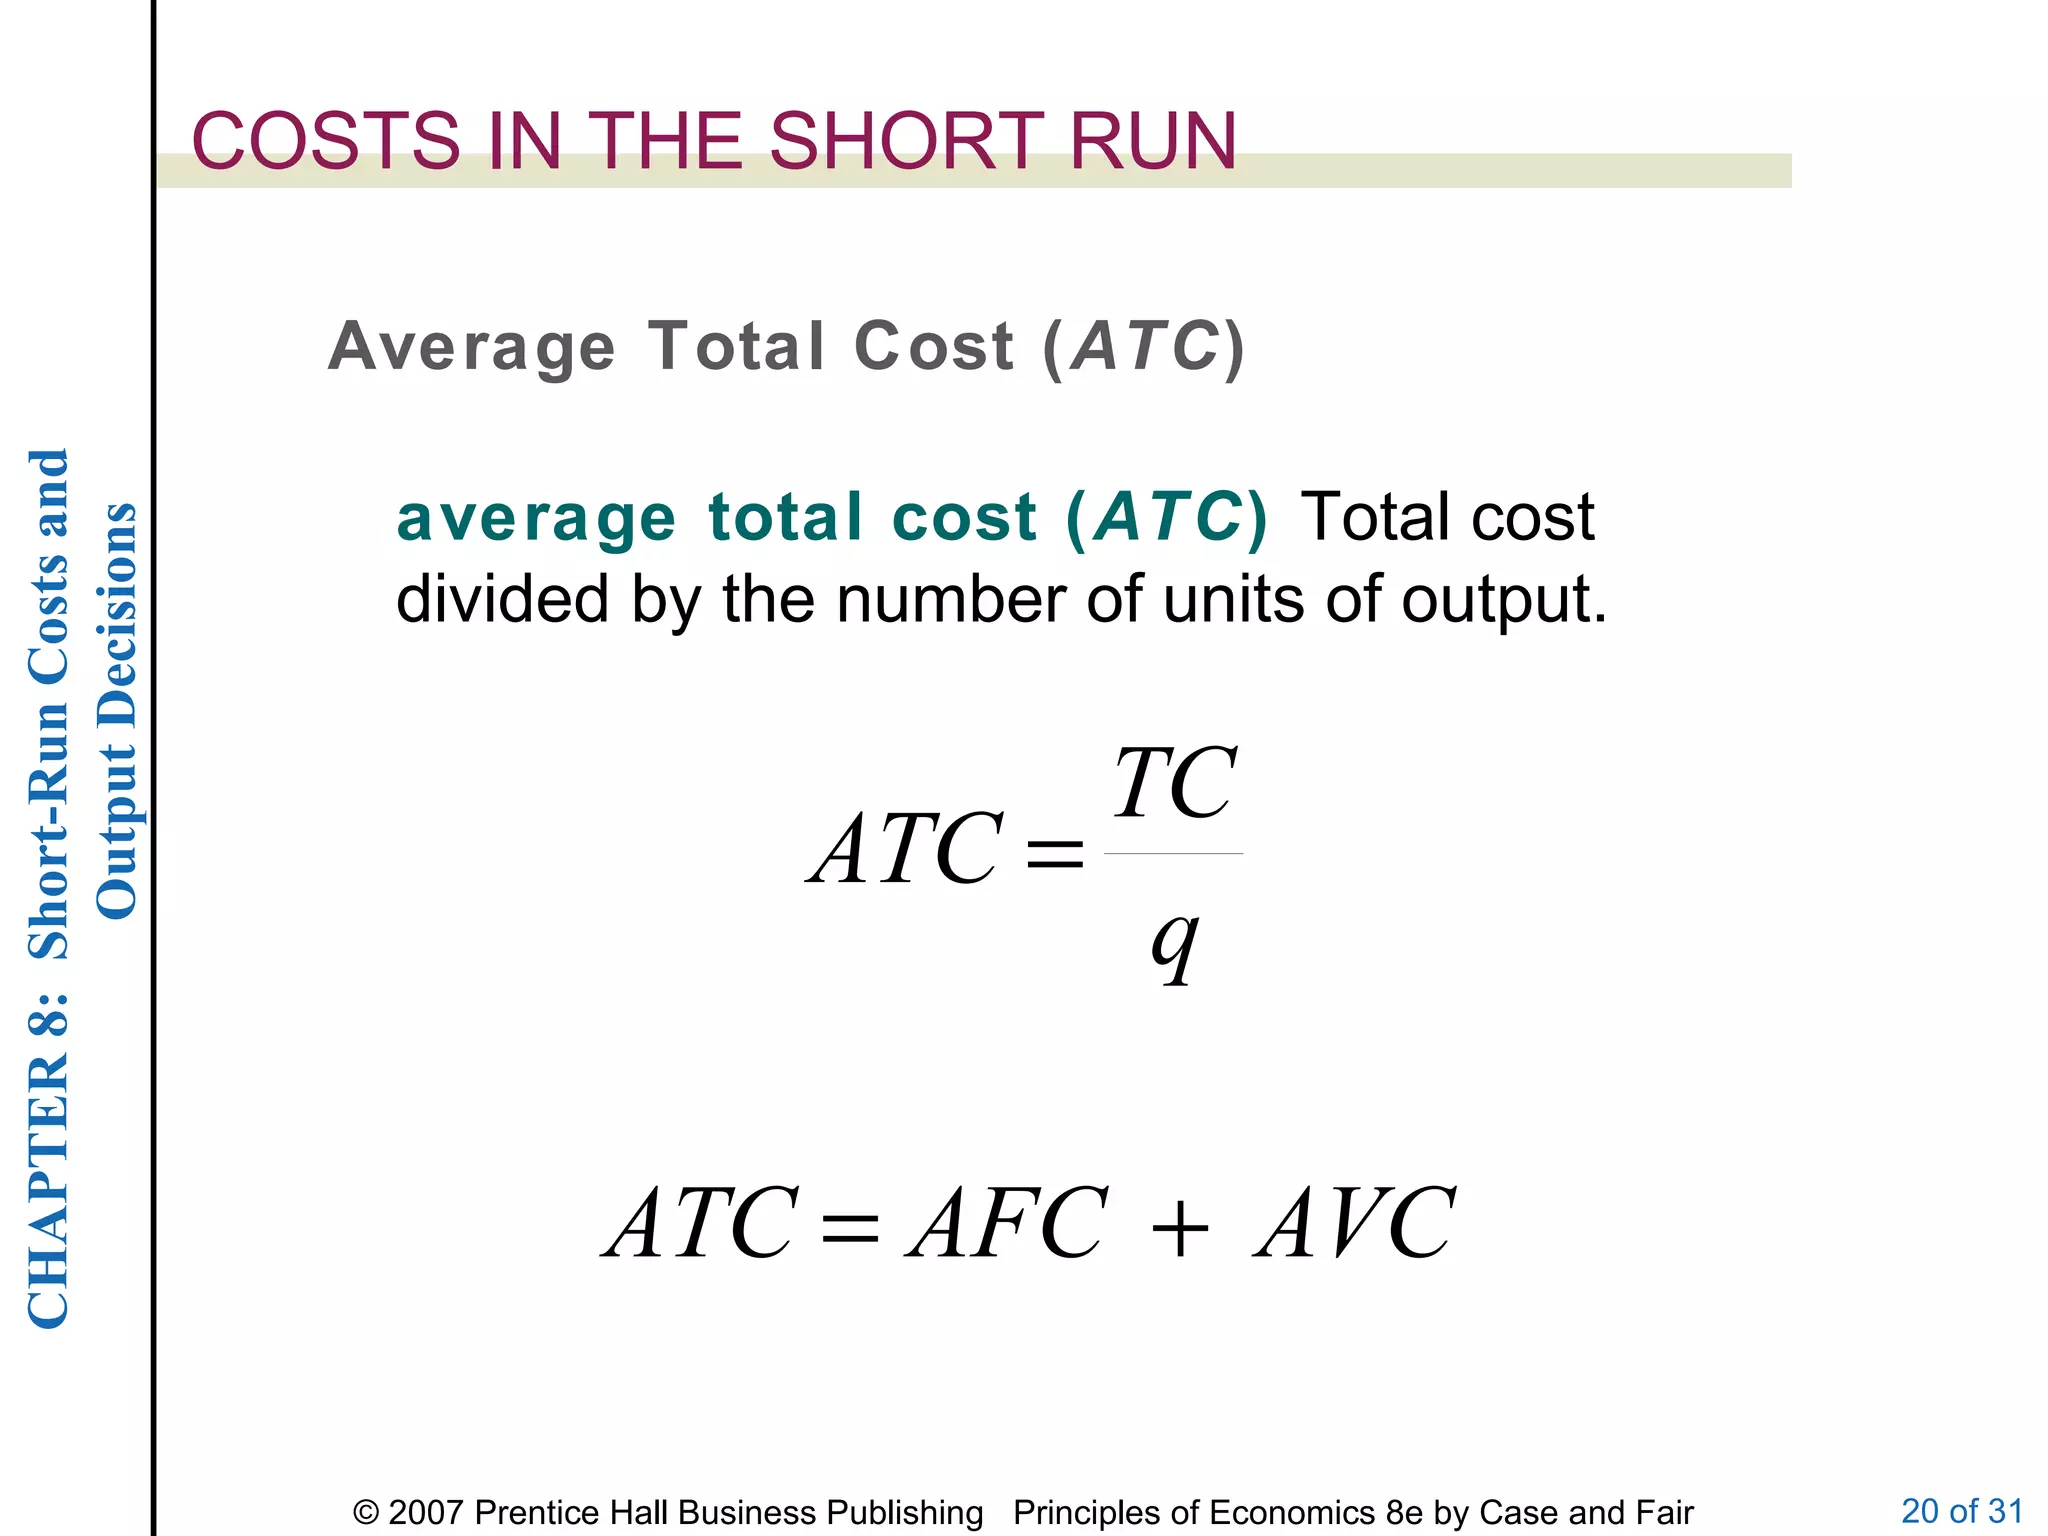
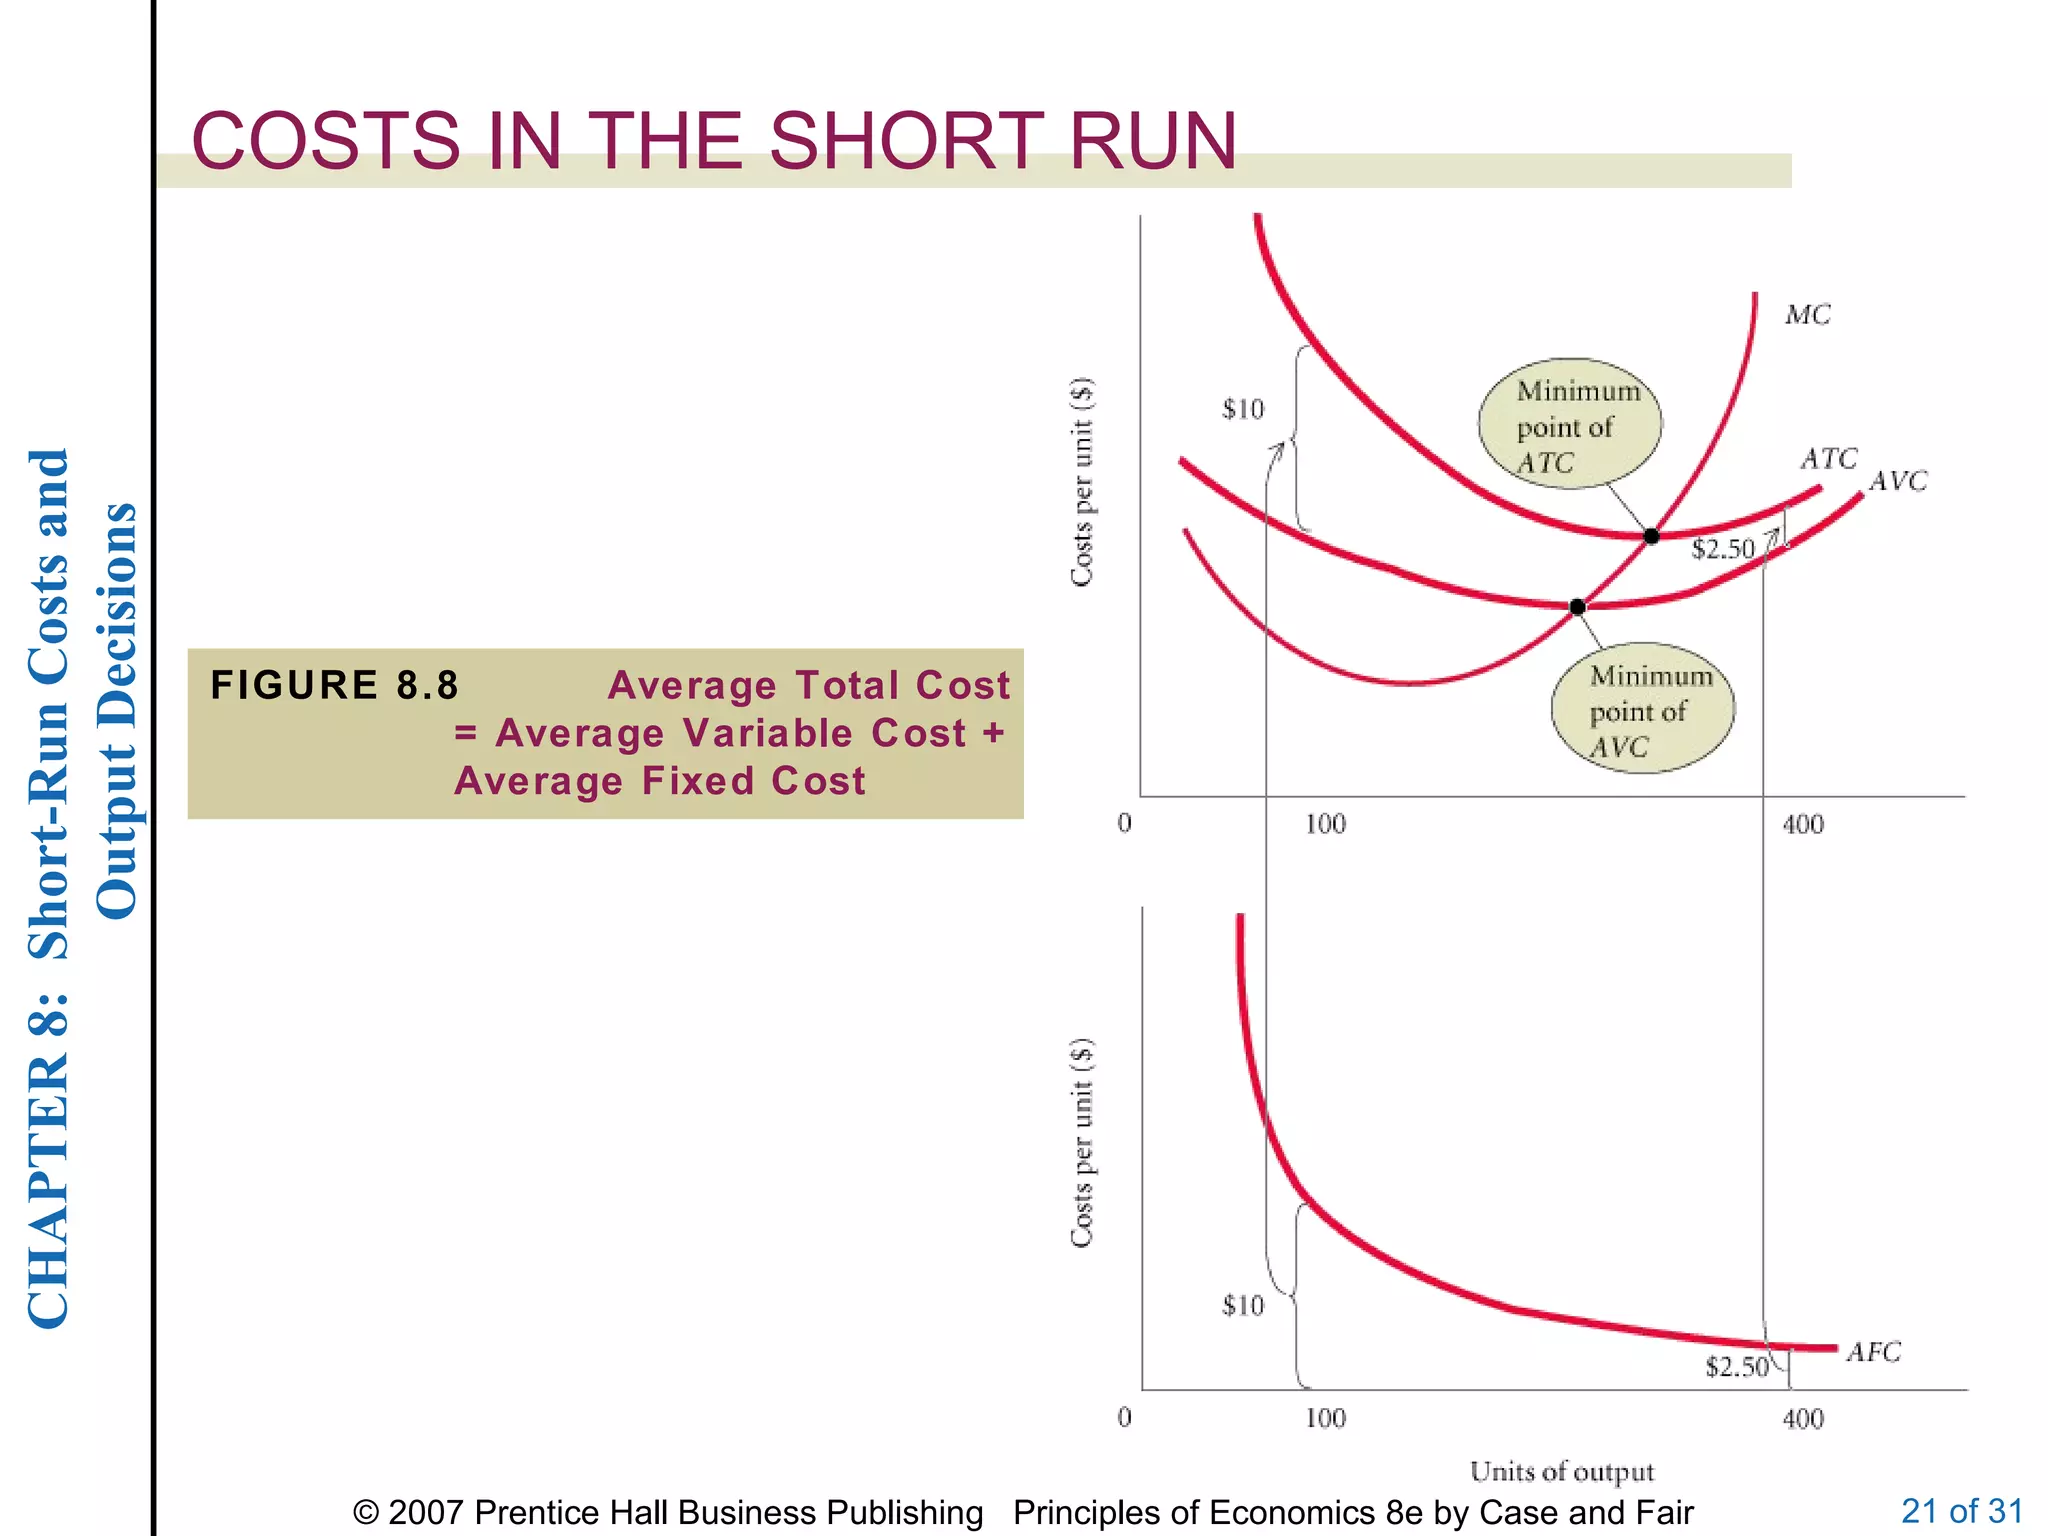
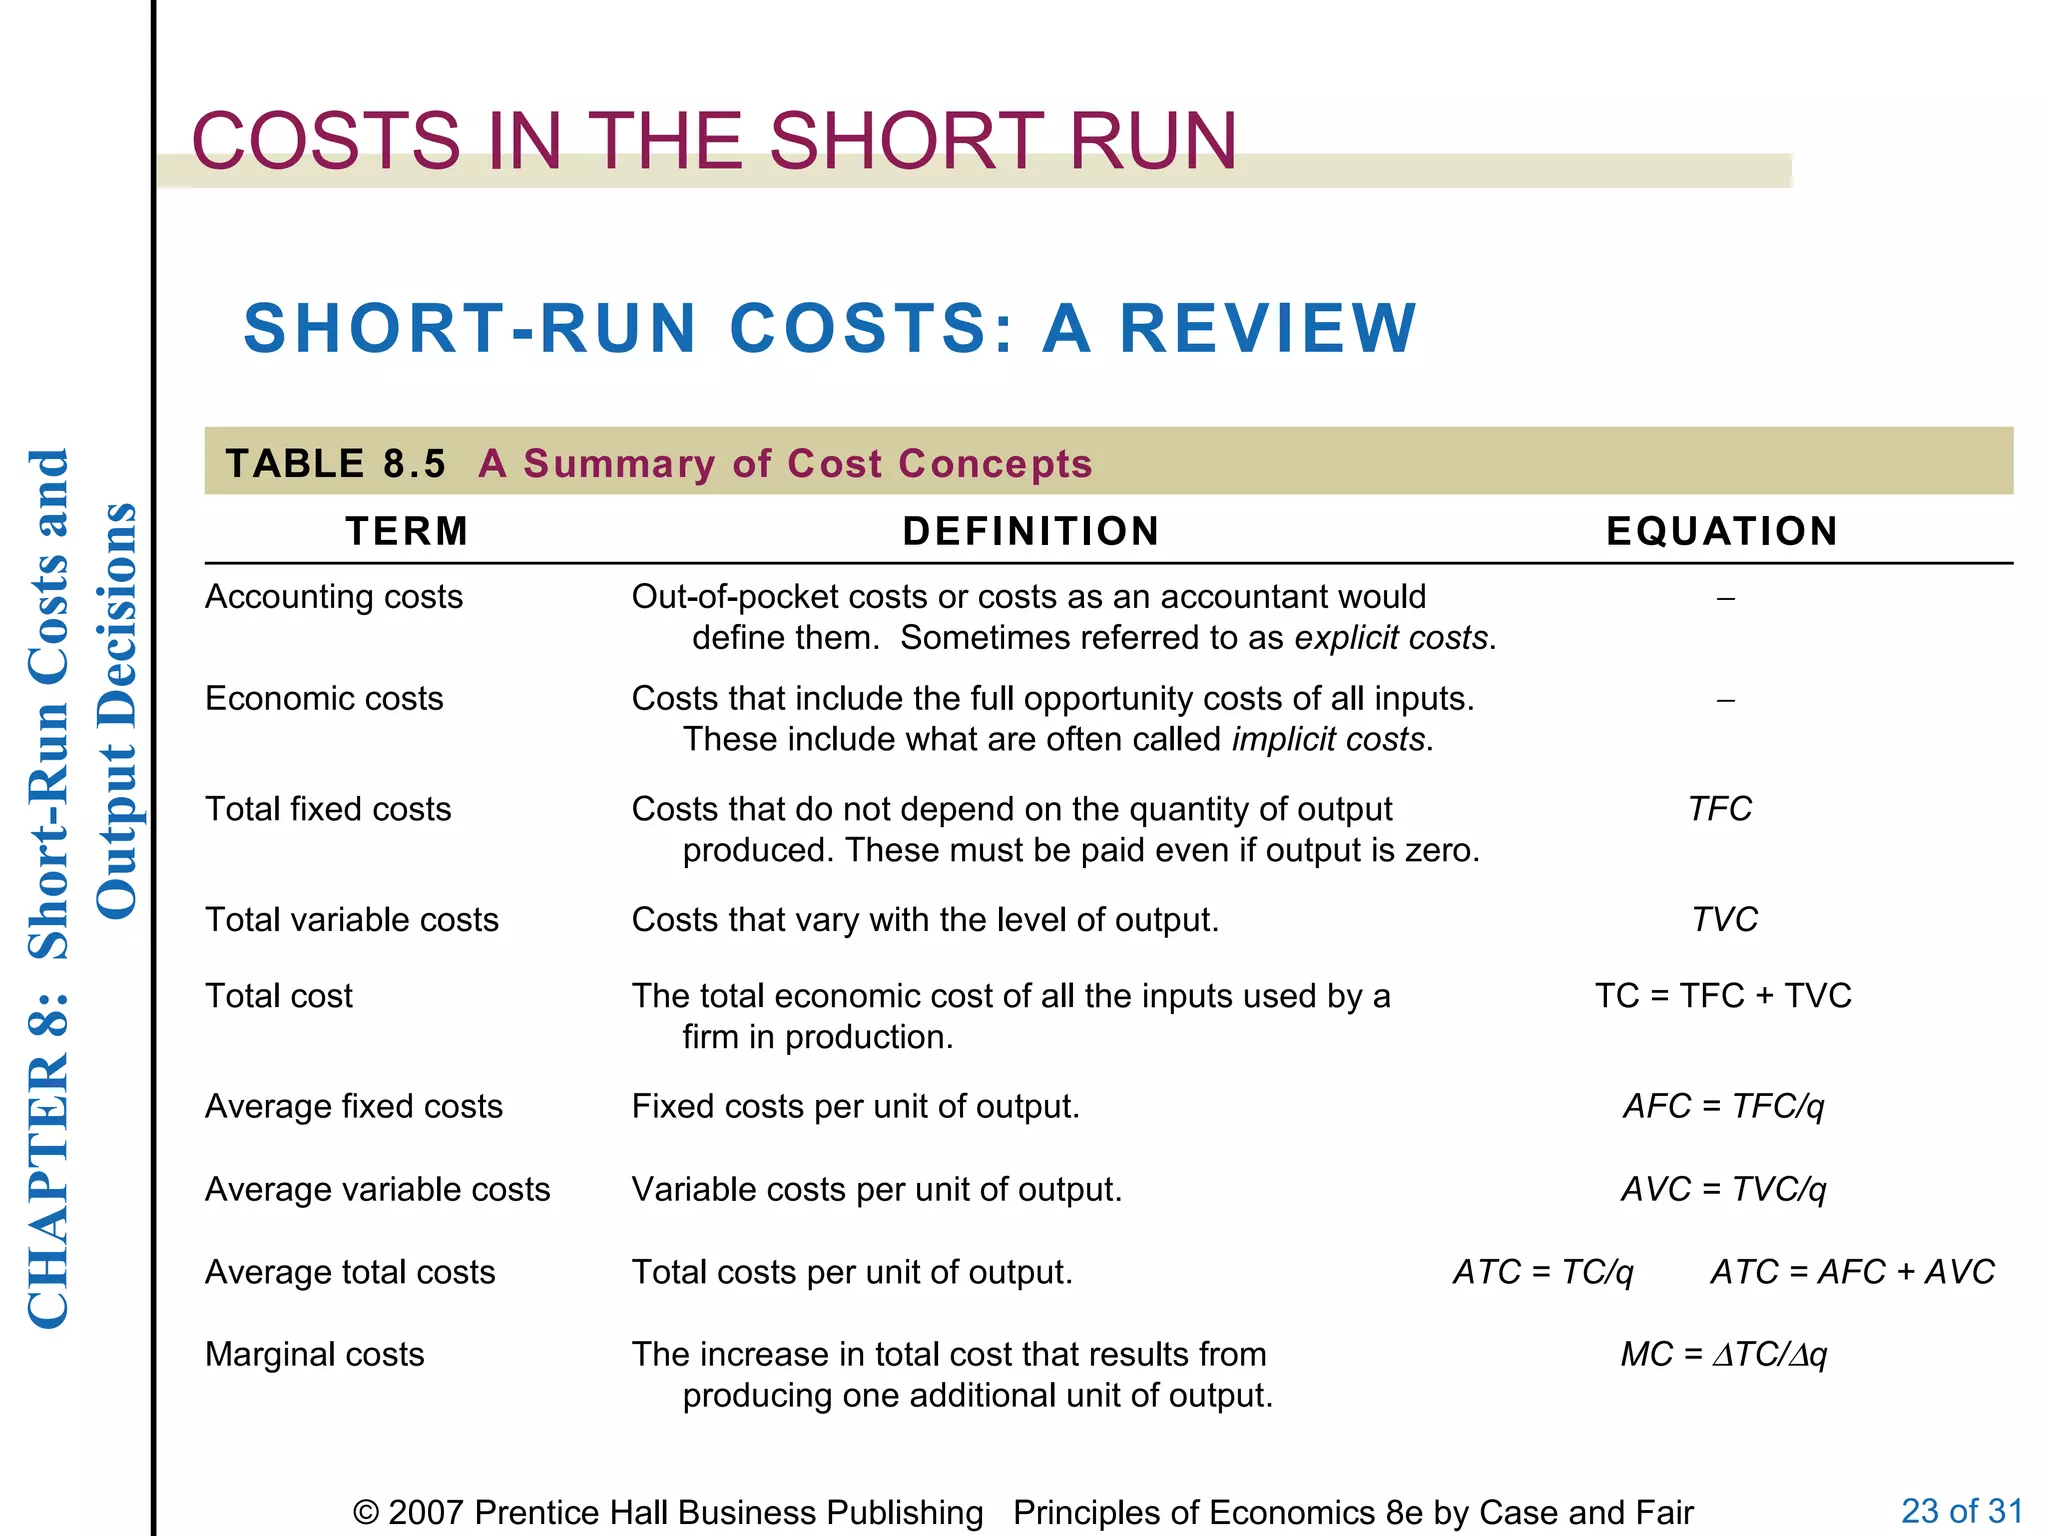
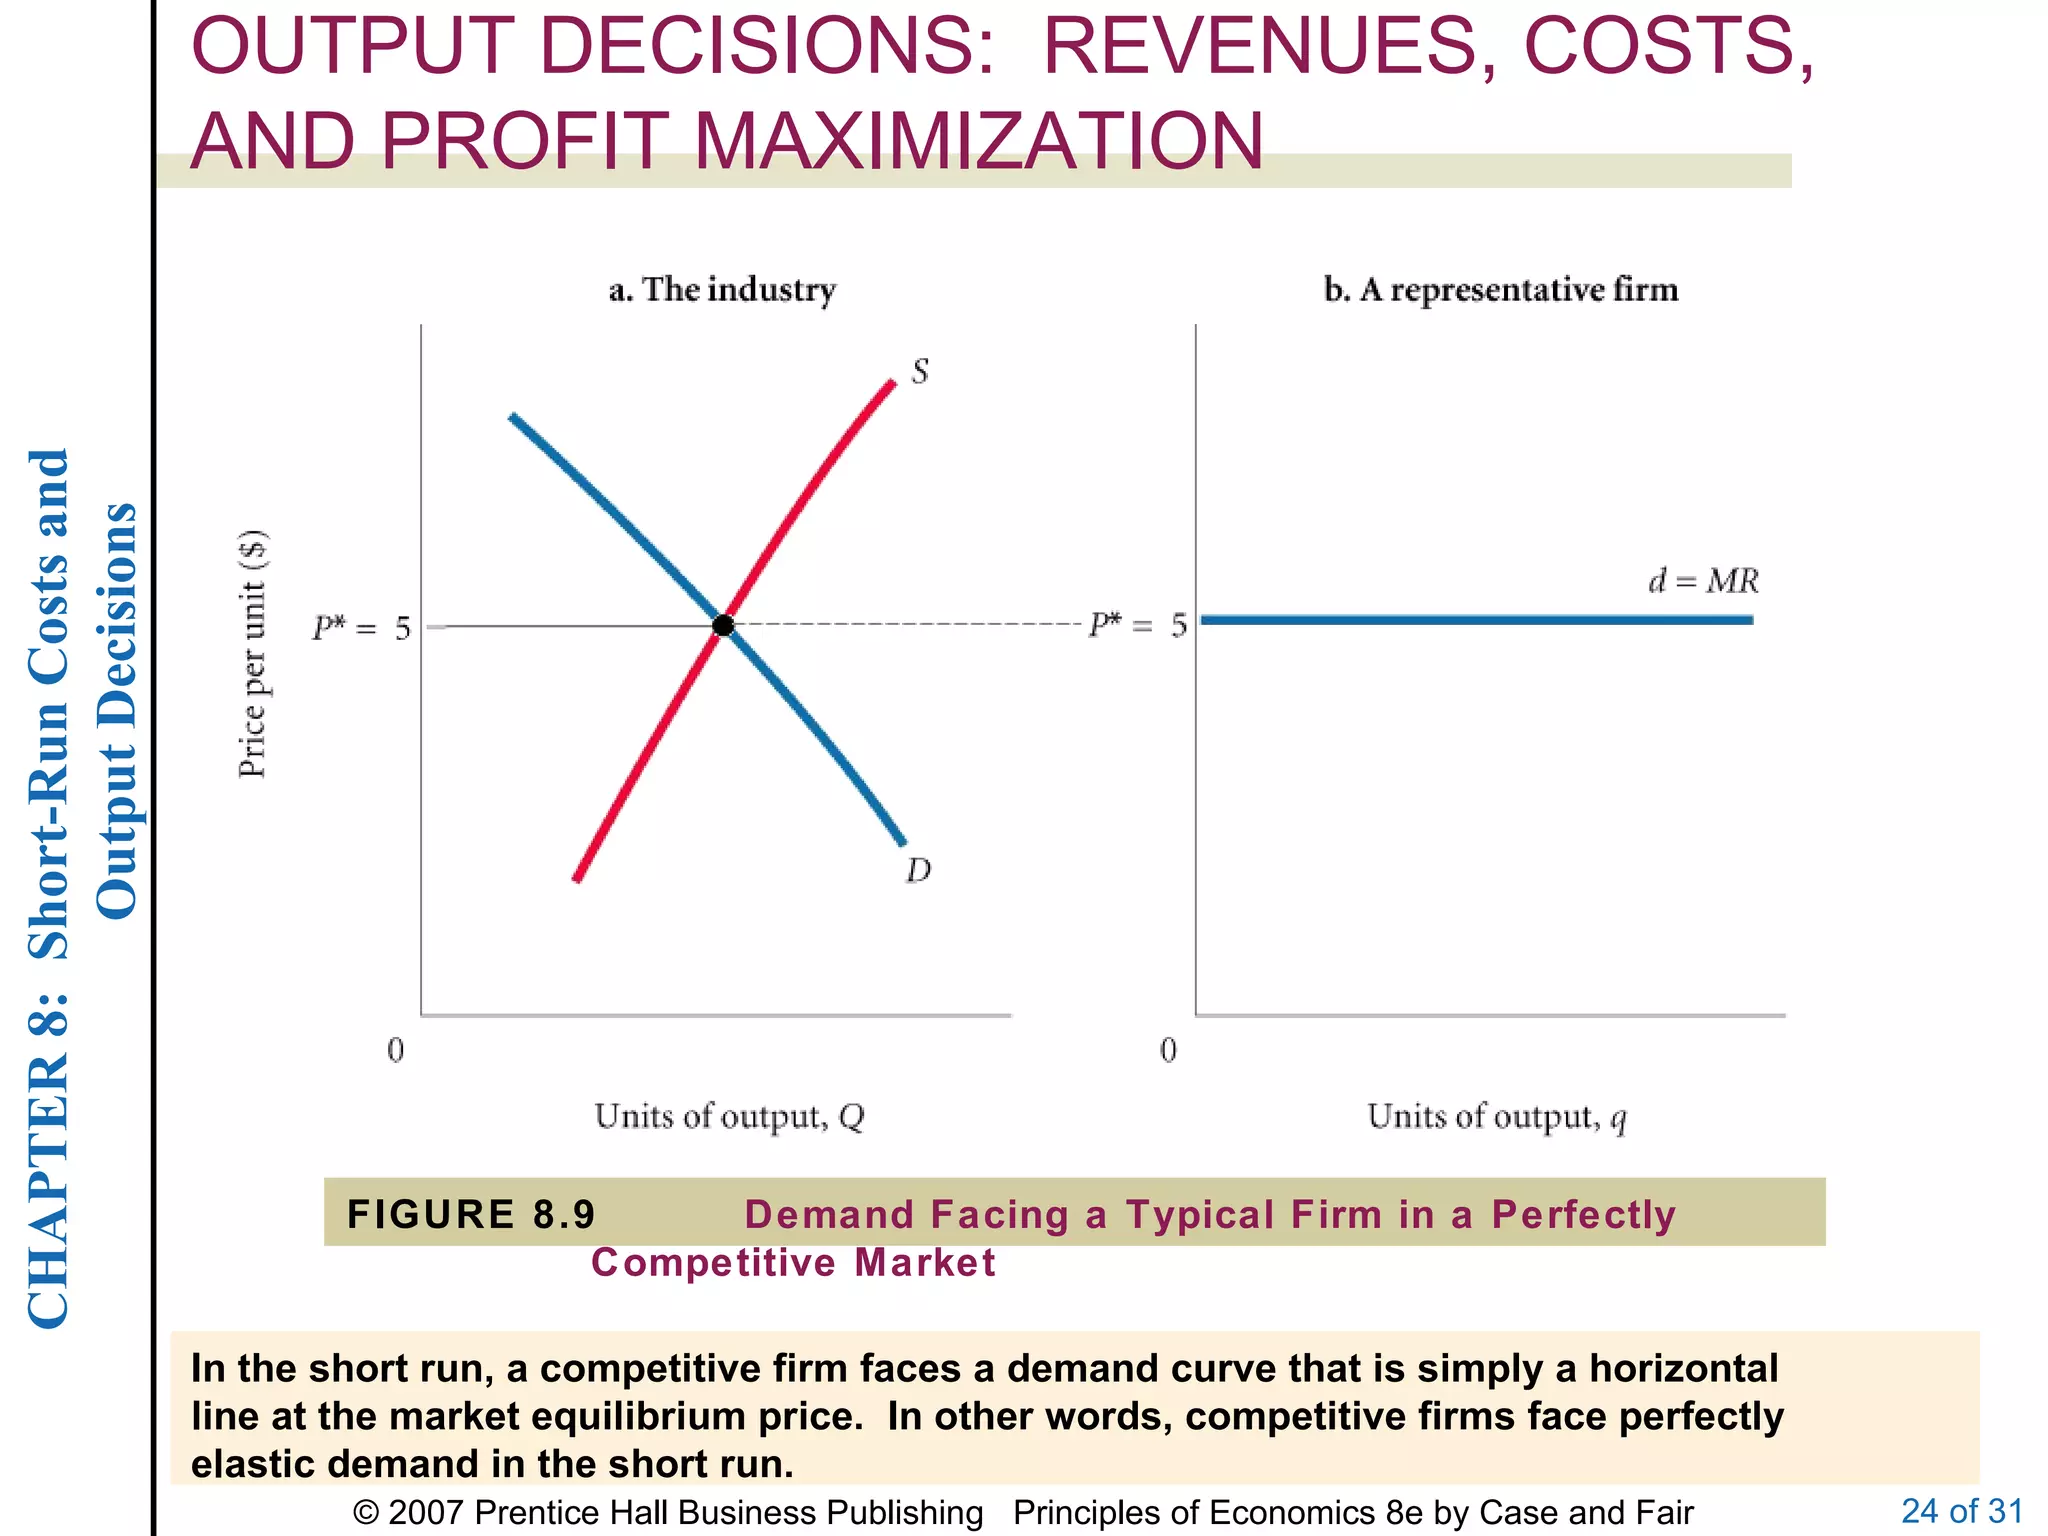
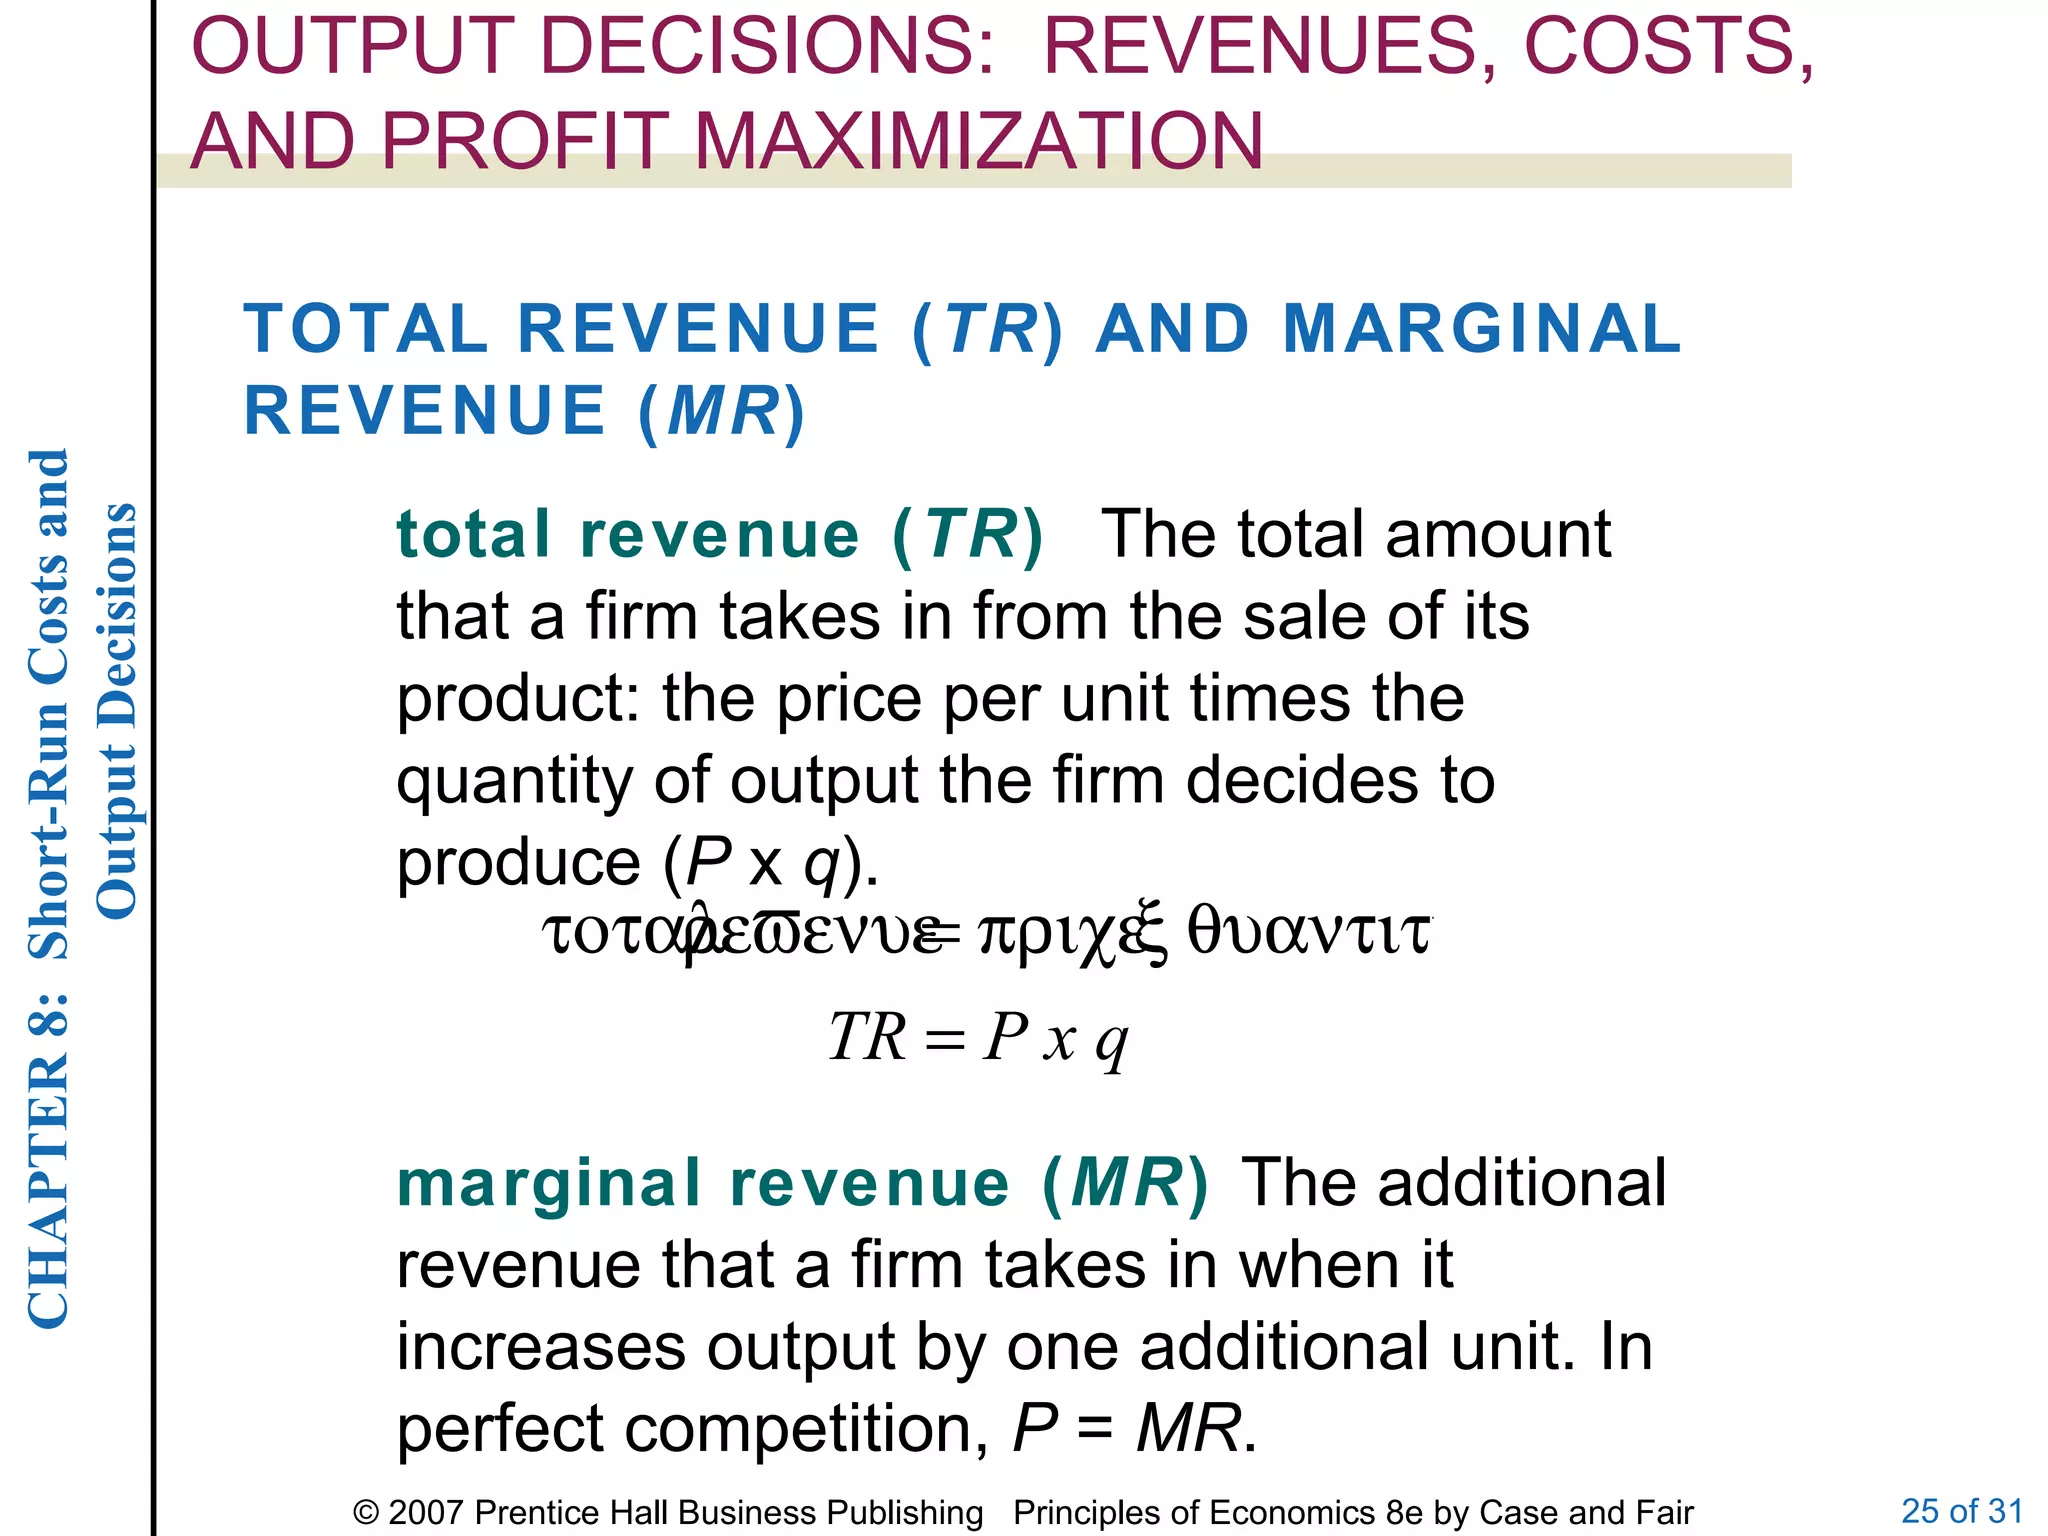
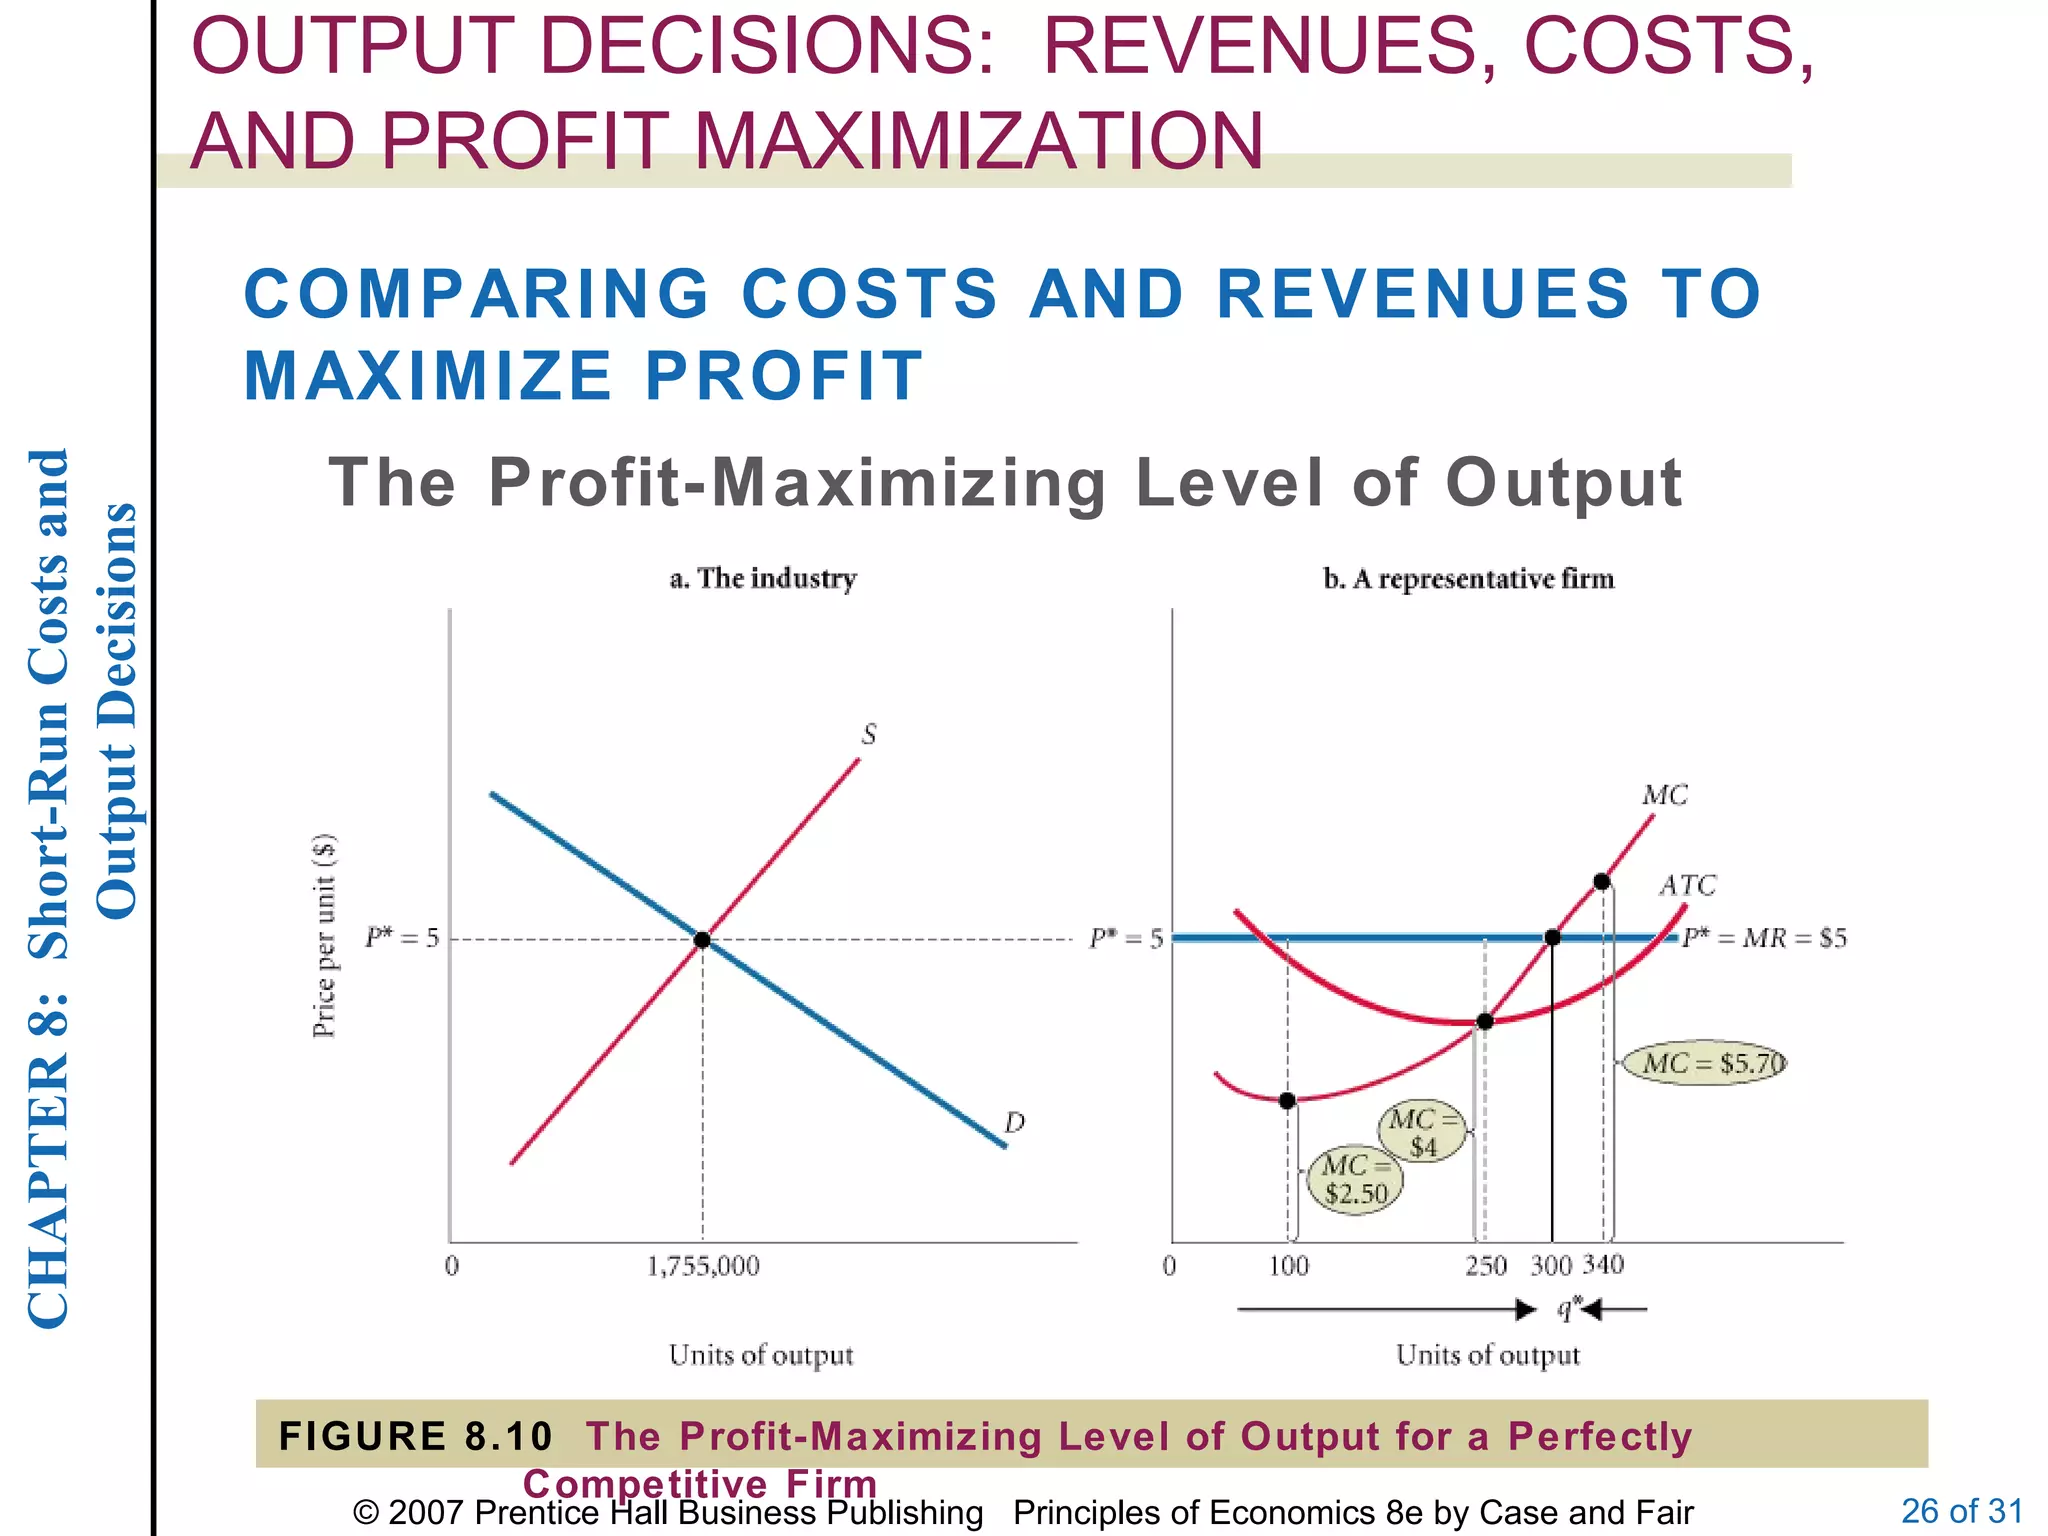
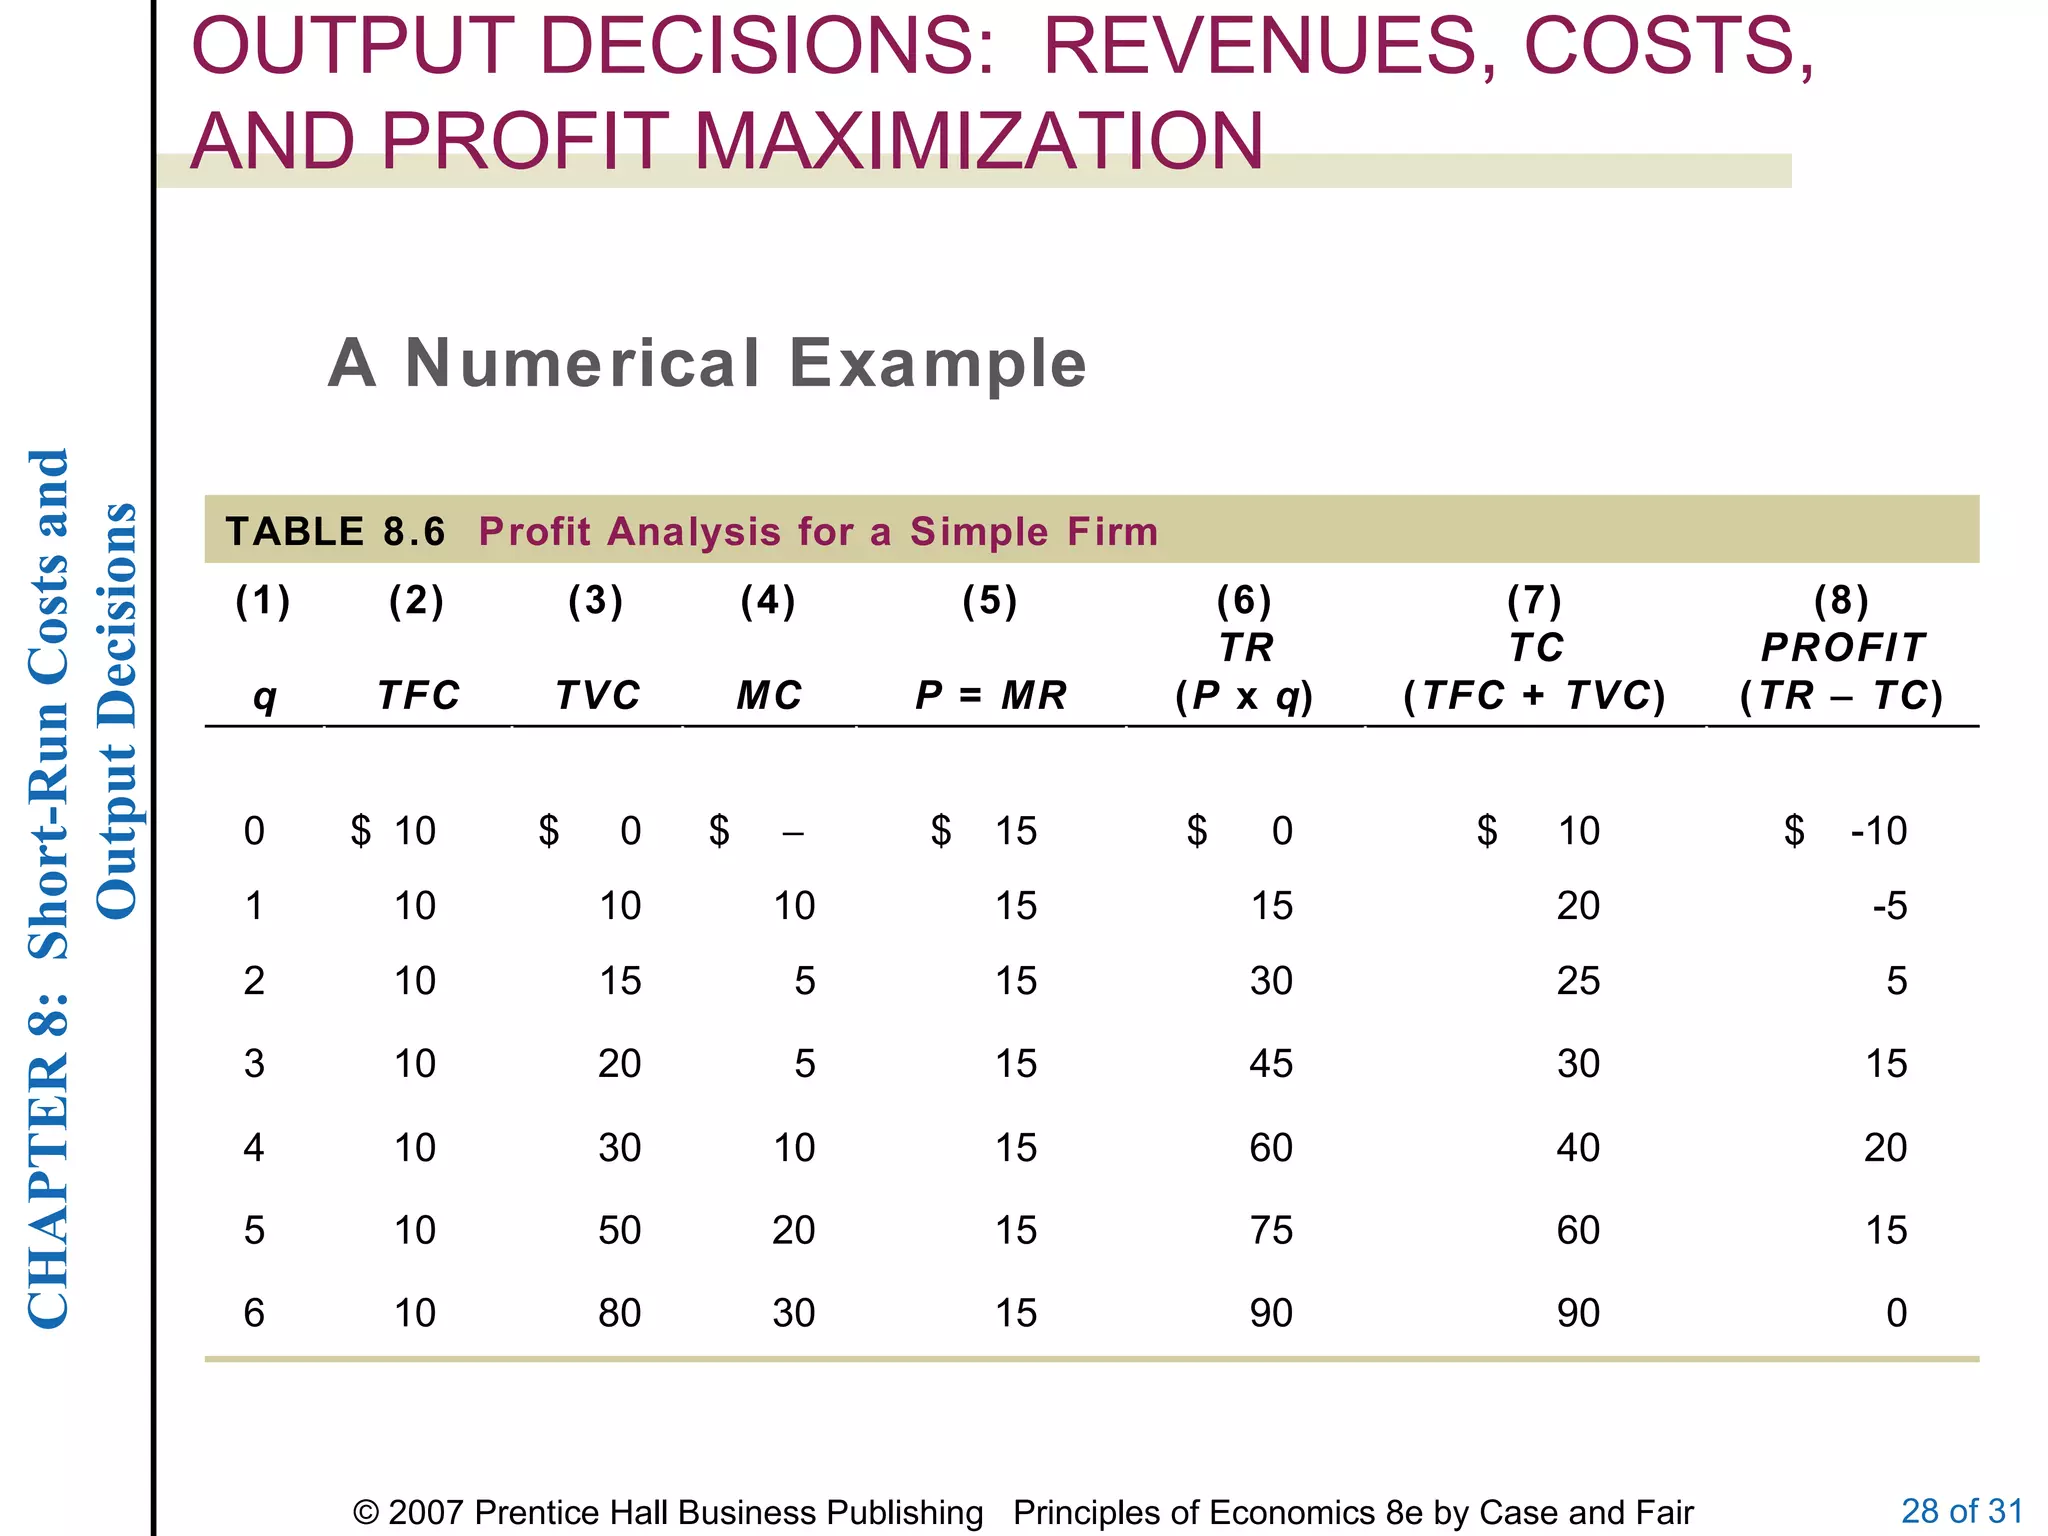
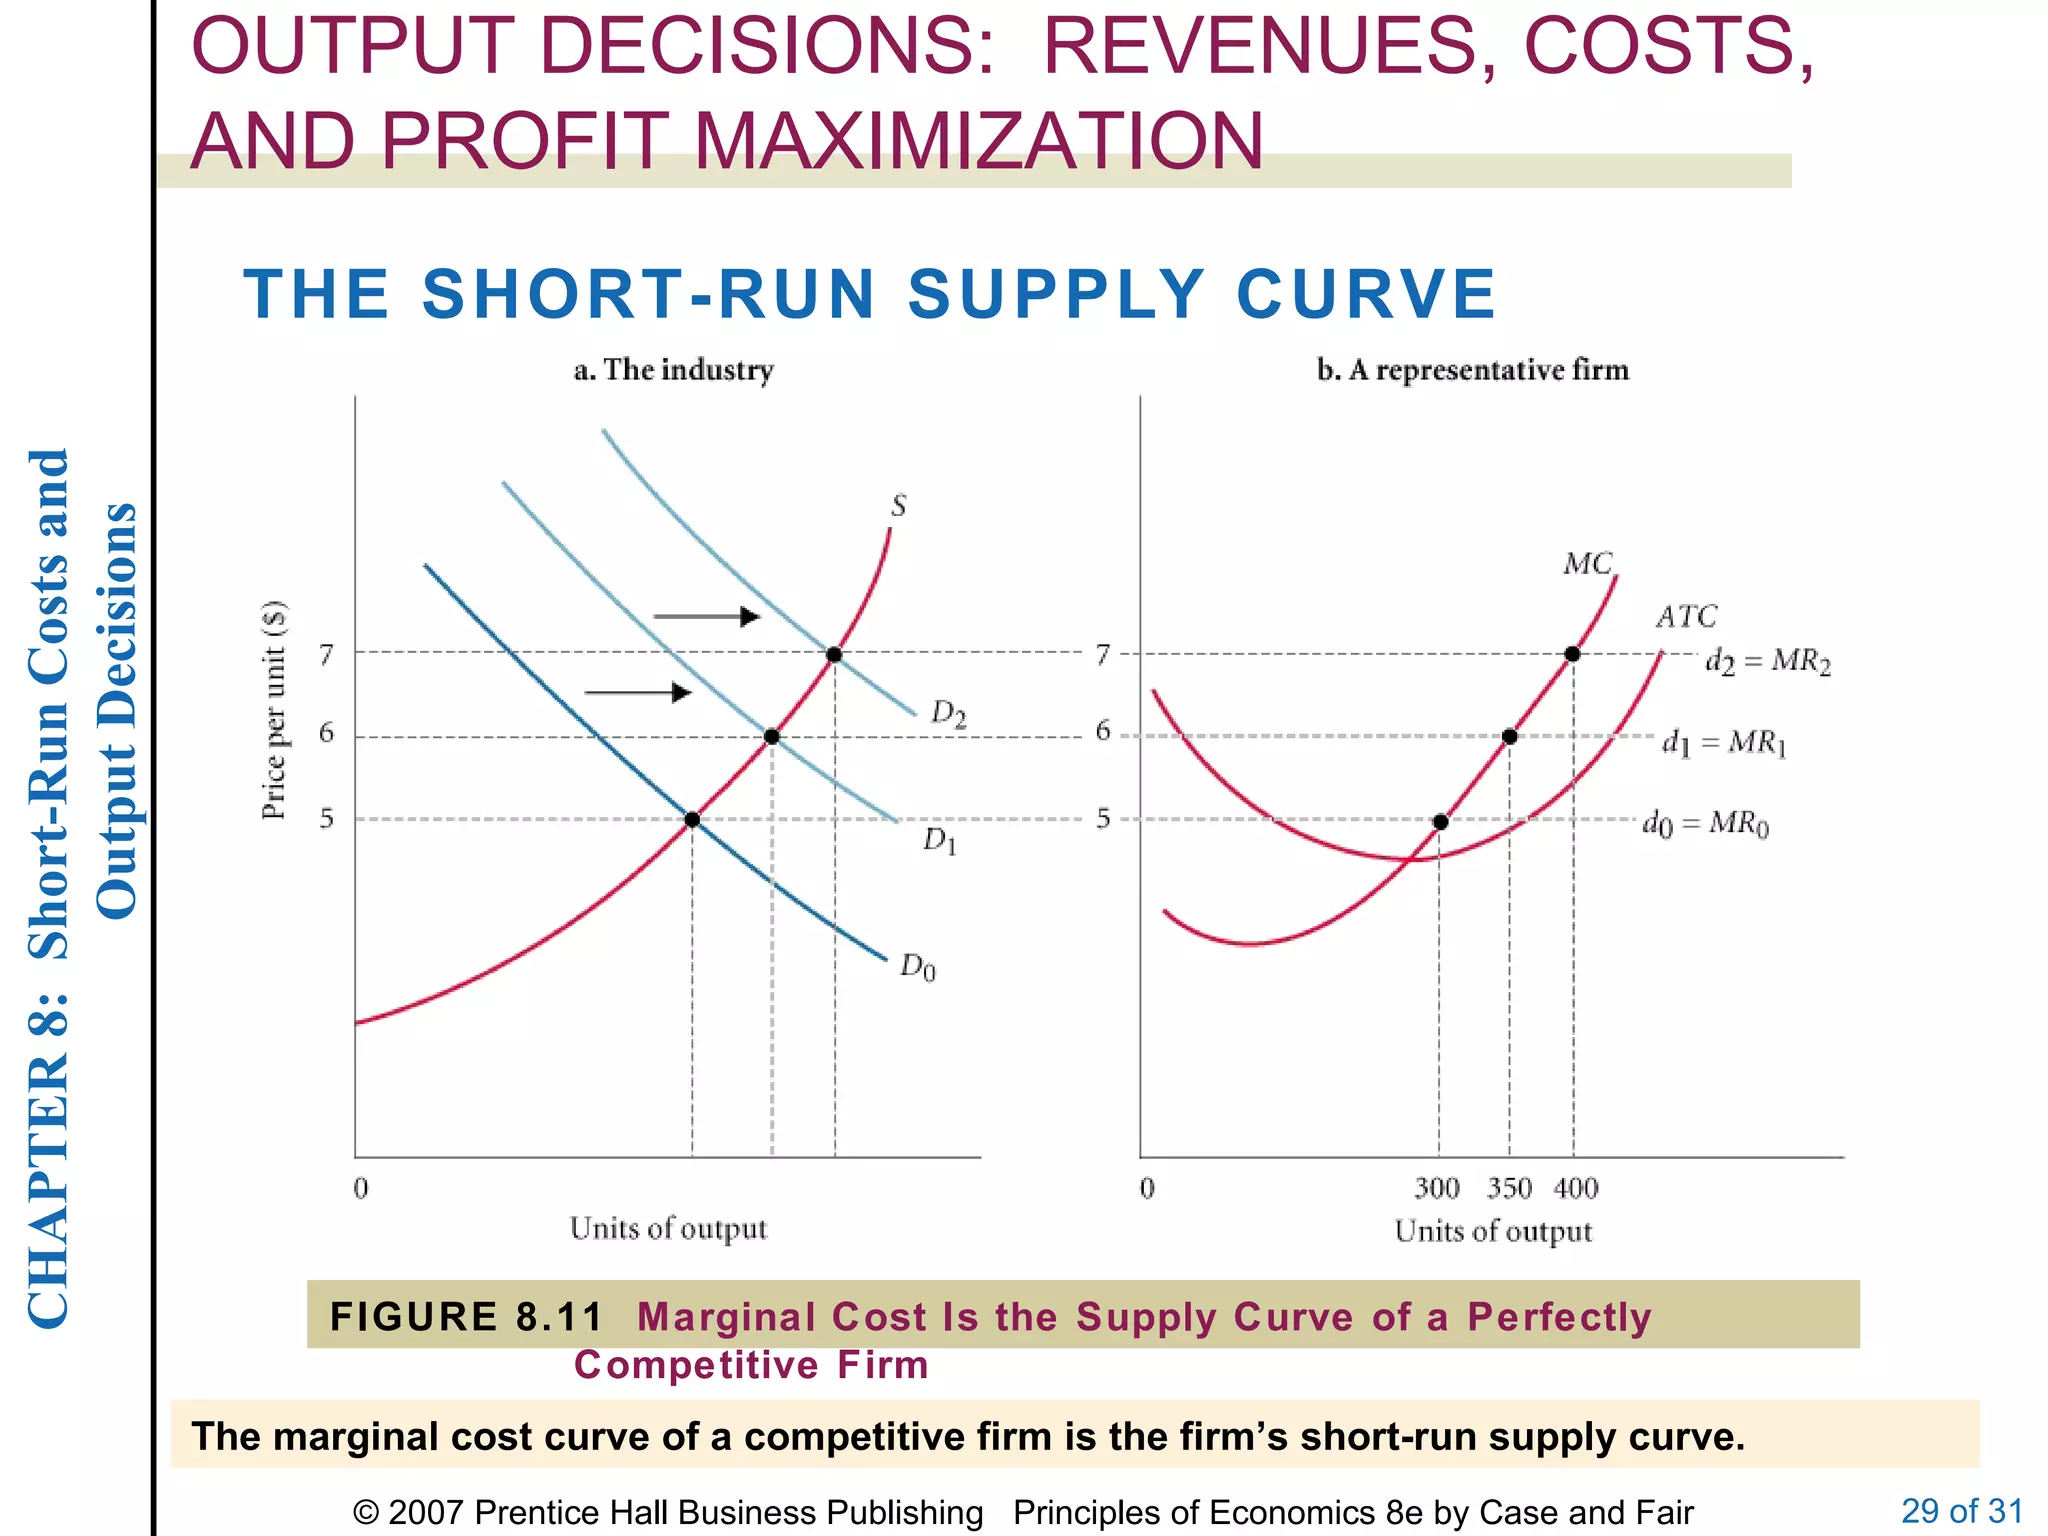
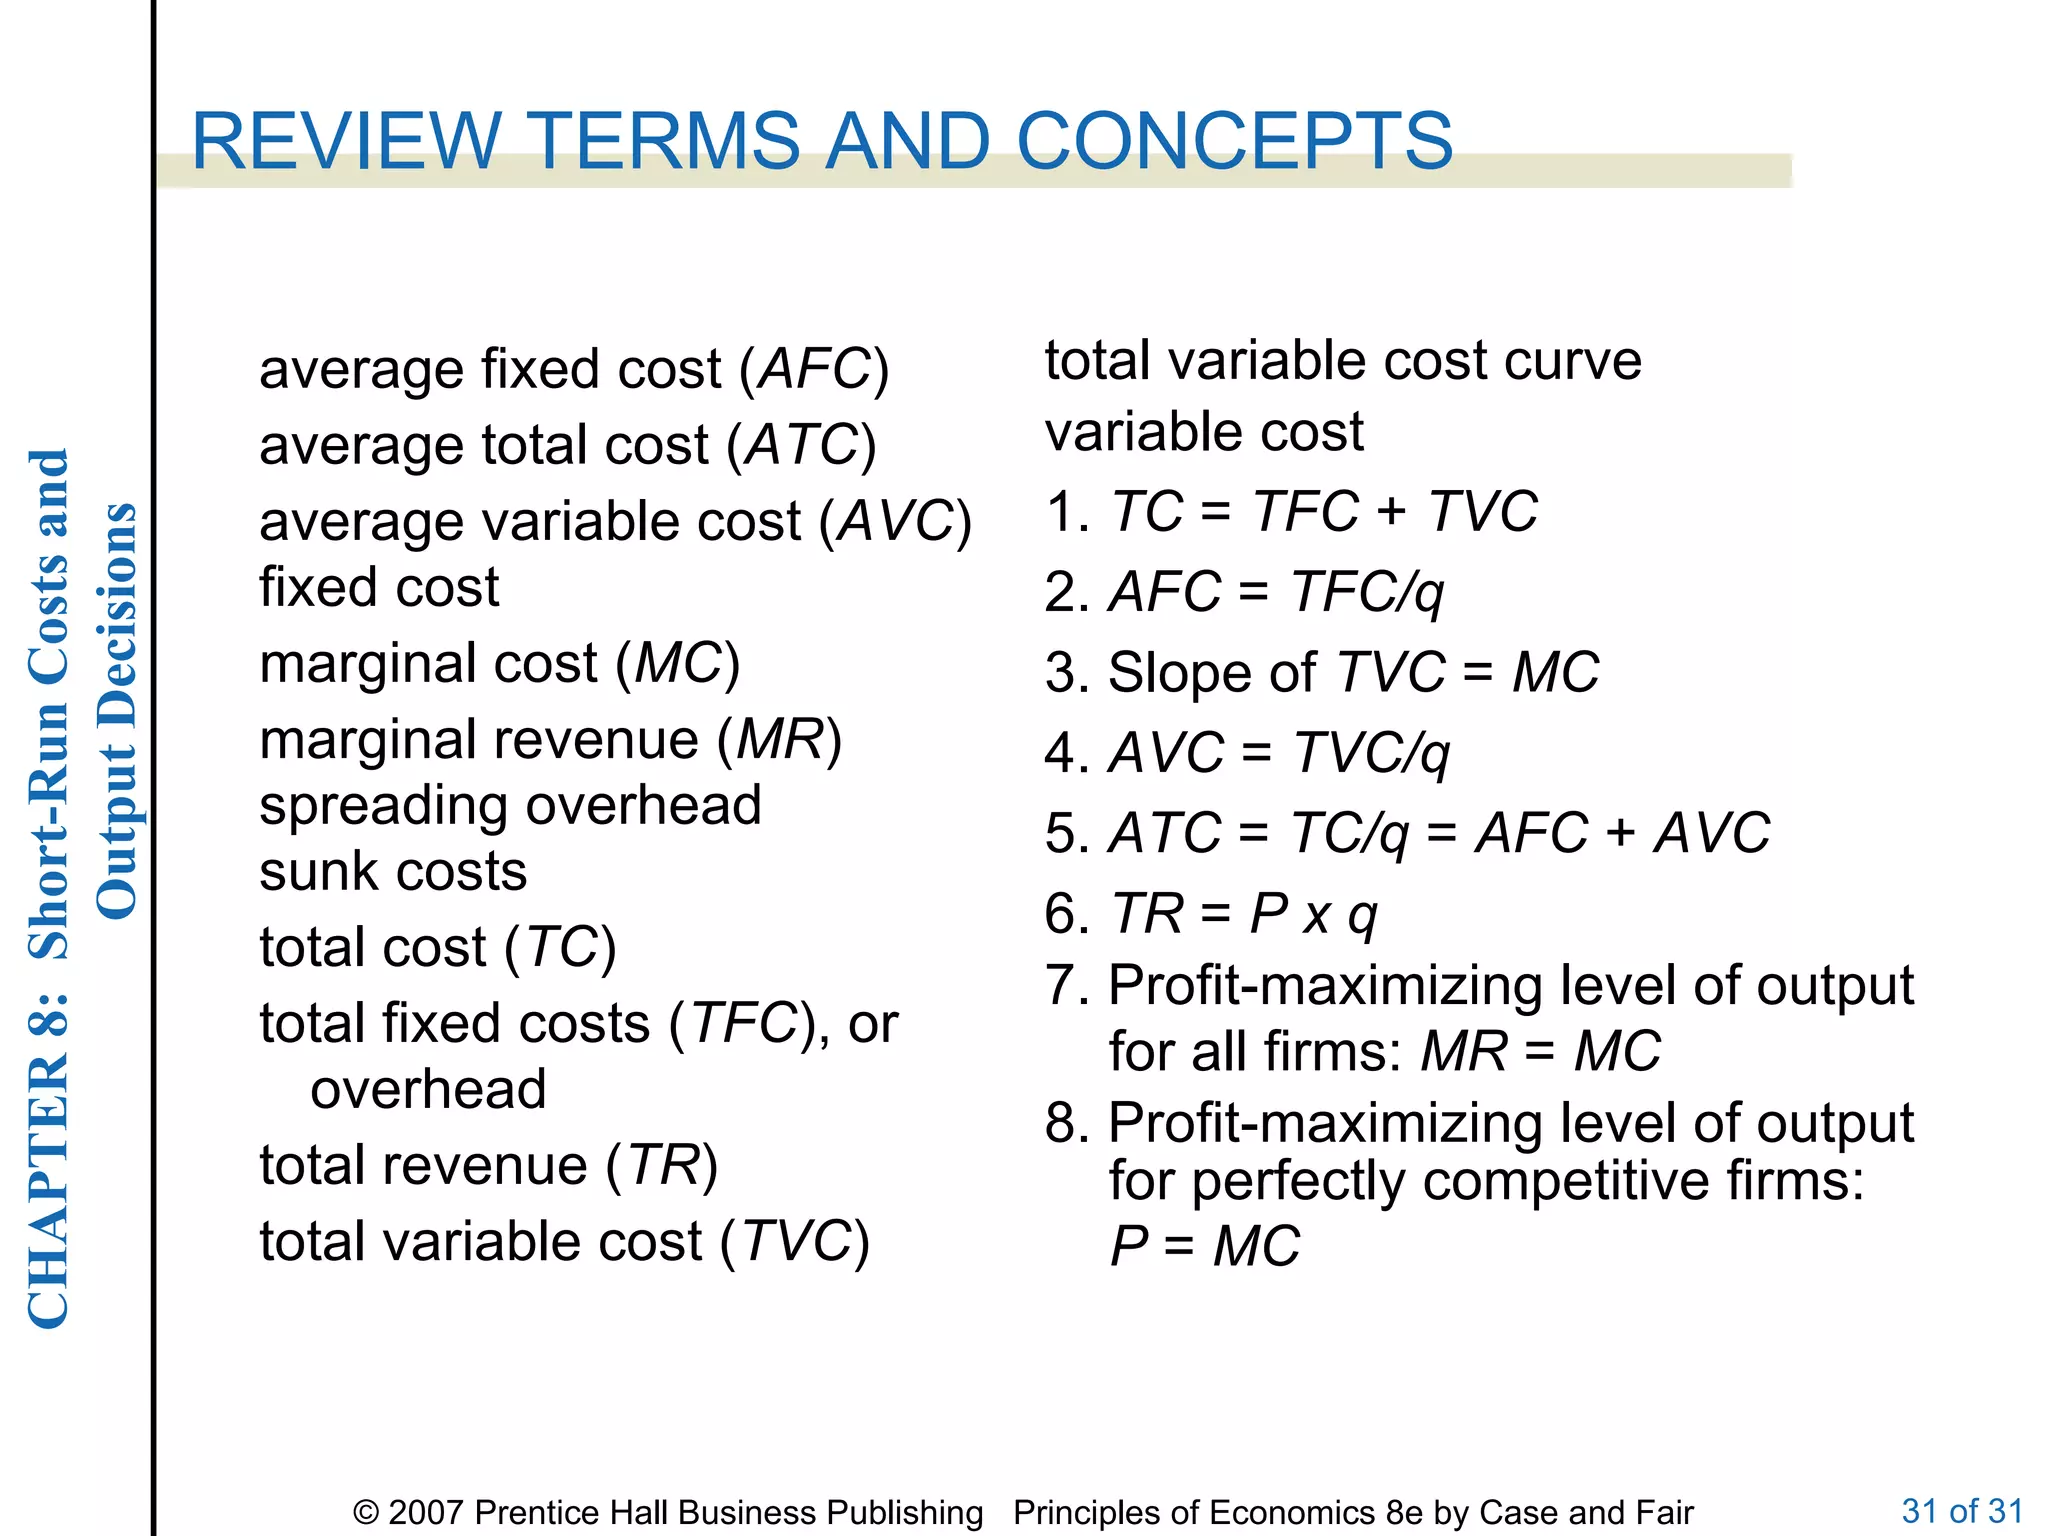

This document discusses short-run costs and output decisions for firms. It defines various cost concepts like fixed costs, variable costs, total costs, average costs and marginal costs. It explains that in the short-run, firms face fixed costs that cannot be changed. It also discusses how firms determine the profit-maximizing level of output by producing at the point where marginal revenue equals marginal cost. The marginal cost curve represents a firm's short-run supply curve in perfect competition.


