Downloaded 153 times
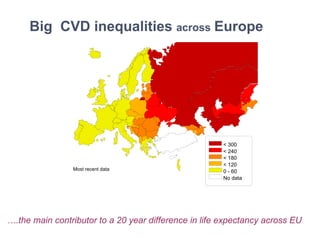

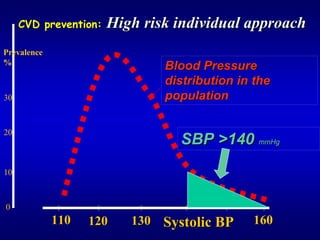
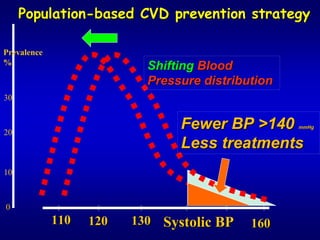
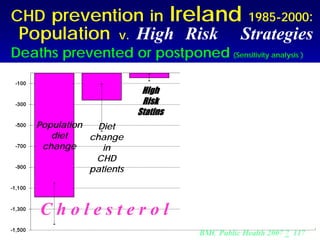
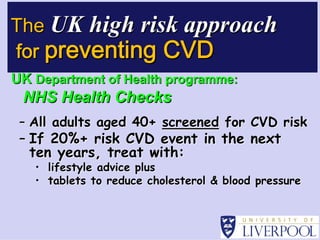
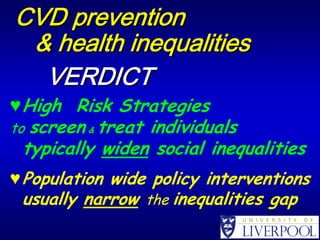
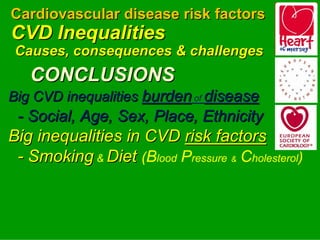
![Socio-economic inequalities
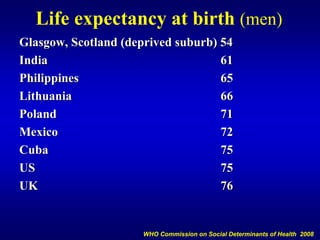
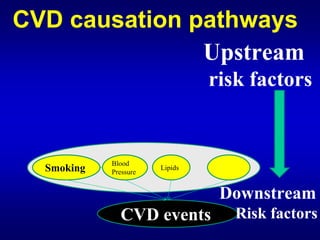
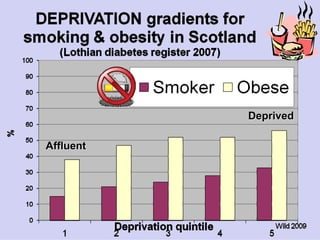
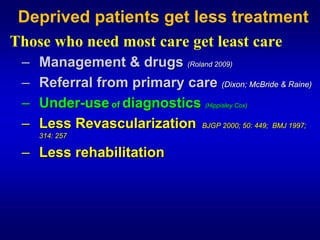
• Five fold social gradients in
premature CVD mortality rates
• Mostly explained by gradients in
smoking & diet
& other pathways [stress, adrenaline etc]](https://image.slidesharecdn.com/capewellmadridcvdinequalities17feb2010-100412011651-phpapp02/85/Cardiovascular-disease-inequalities-causes-and-consequences-36-320.jpg)
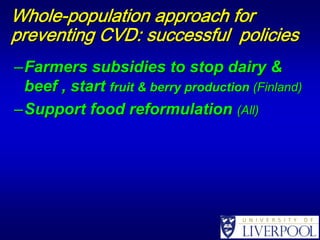
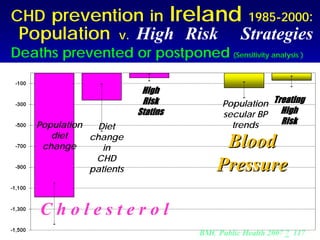
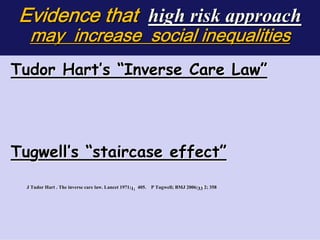
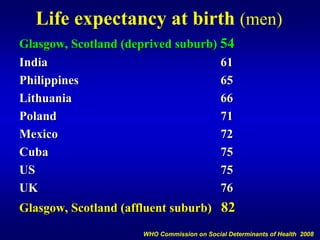
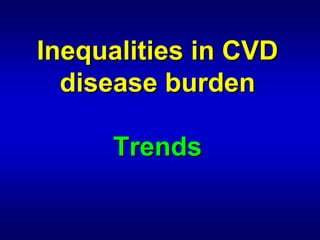
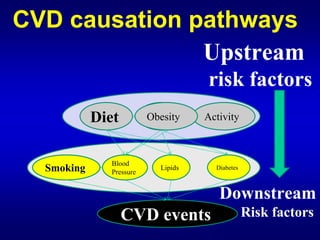
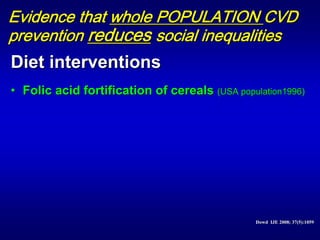
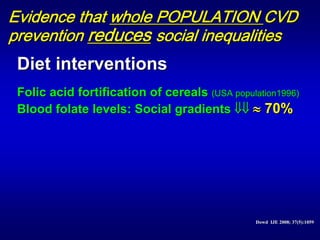
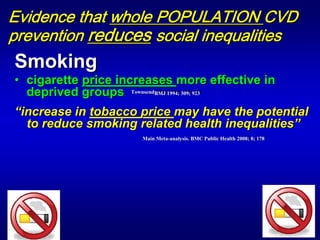
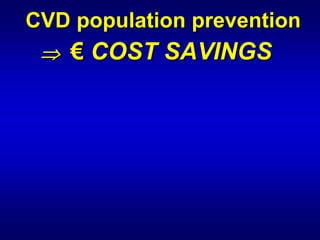
![Evidence that whole POPULATION CVD
prevention reduces social inequalities
Kivimaki, Marmot et al Lancet 2008
15 year risk of CHD death
• calculated in British men aged 55
• quantified the benefits of decreasing risk
factors uniformly across population
[systolic blood pressure ⇓10mmHg
total cholesterol⇓ 2mmol/l & glucose ⇓ 1 mmol/l ]](https://image.slidesharecdn.com/capewellmadridcvdinequalities17feb2010-100412011651-phpapp02/85/Cardiovascular-disease-inequalities-causes-and-consequences-70-320.jpg)
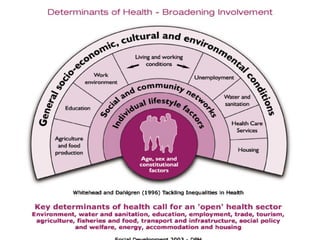
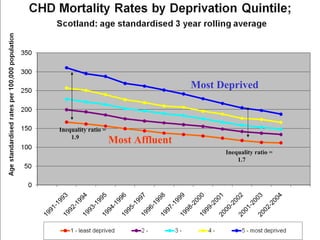
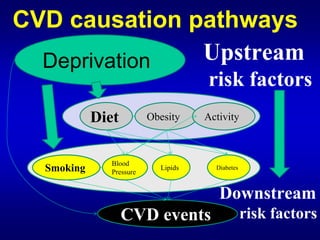
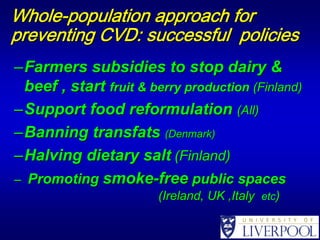
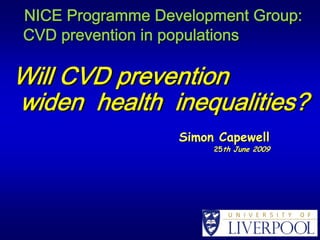
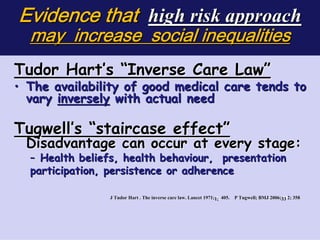
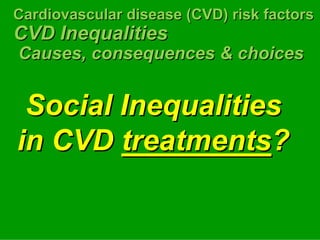
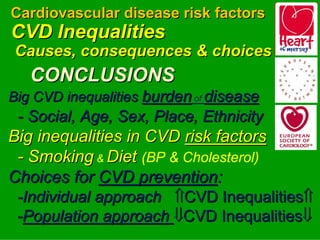
![Evidence that whole POPULATION CVD
prevention reduces social inequalities
Kivimaki, Marmot et al Lancet 2008
15 year risk of CHD death
• calculated in British men aged 55
• quantified the benefits of decreasing risk
factors uniformly across population
[systolic blood pressure ⇓10mmHg
total cholesterol⇓ 2mmol/l & glucose ⇓ 1 mmol/l ]
• Would reduce the absolute mortality gap
between affluent & deprived by ≈70%](https://image.slidesharecdn.com/capewellmadridcvdinequalities17feb2010-100412011651-phpapp02/85/Cardiovascular-disease-inequalities-causes-and-consequences-71-320.jpg)
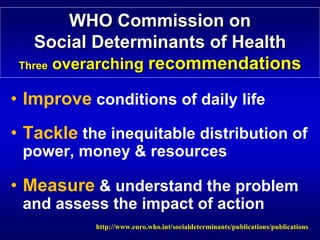
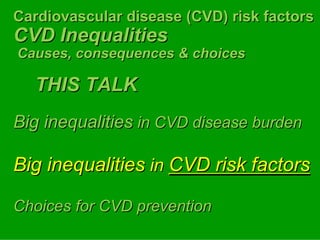
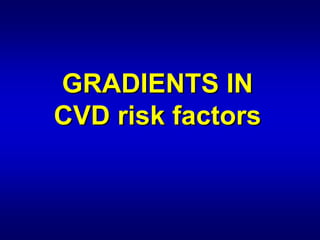
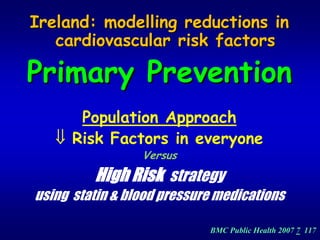
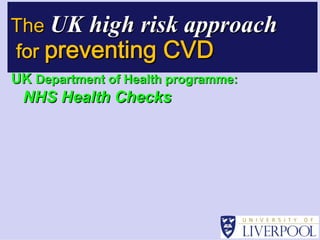
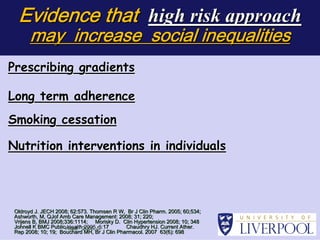
![CVD population-wide prevention
prevention
⇒ € COST SAVINGS
SAVINGS
• USA Trust for America’s Health
• Australia Abelson
• UK Wanless Report 2004
(save € 40 billion)
NICE Guidance 2010 [Draft]
(save € 5 billion – €10 billion)](https://image.slidesharecdn.com/capewellmadridcvdinequalities17feb2010-100412011651-phpapp02/85/Cardiovascular-disease-inequalities-causes-and-consequences-78-320.jpg)
![CVD prevention in EU
EU
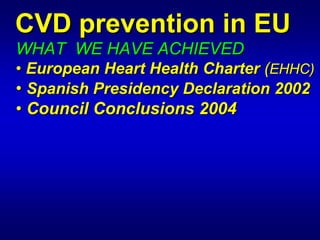
WHAT WE HAVE ACHIEVED
• European Heart Health Charter (EHHC)
• Spanish Presidency Declaration 2002
• Council Conclusions 2004
WHAT WE CAN DO NOW
• ⇑ Tobacco Control [& price]
• ⇑ fruit & vegetable consumption
• ⇓ meat & dairy [& HELP climate change]
• Ban junk food advertising
• Ban trans fats](https://image.slidesharecdn.com/capewellmadridcvdinequalities17feb2010-100412011651-phpapp02/85/Cardiovascular-disease-inequalities-causes-and-consequences-85-320.jpg)


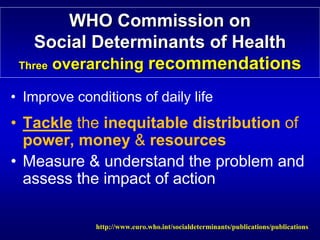
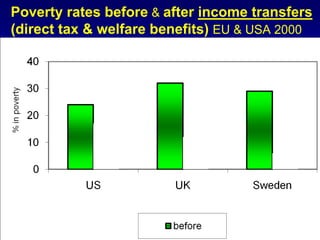
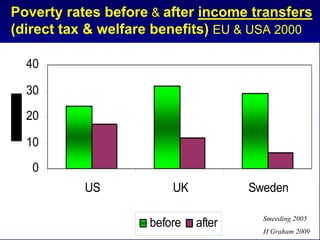
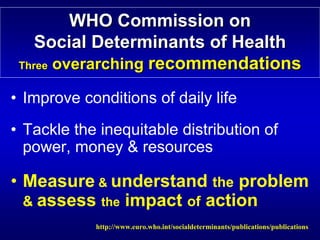
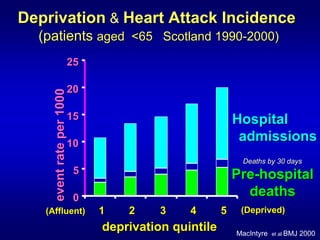
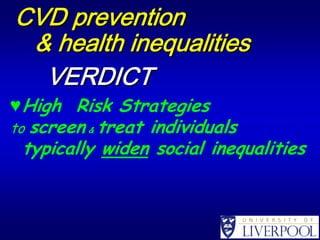
The document discusses the significant inequalities in cardiovascular disease (CVD) risk factors and its impact on public health, emphasizing variations in life expectancy linked to socio-economic conditions. It outlines the WHO's recommendations to improve daily living conditions, address the unequal distribution of resources, and emphasize measurement and understanding of CVD issues. The analysis highlights that high-risk strategies may exacerbate socio-economic disparities, while population-wide interventions tend to reduce inequalities in CVD mortality.