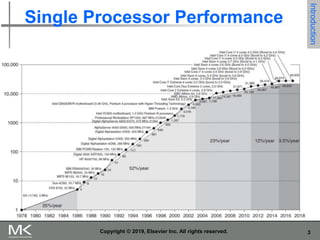
1
Copyright © 2019, Elsevier Inc. All rights reserved.
Chapter 1
Fundamentals of Quantitative
Design and Analysis
Computer Architecture
A Quantitative Approach, Sixth Edition
2
Computer Technology
 Performance improvements:
 Improvements in semiconductor technology
 Feature size, clock speed
 Improvements in computer architectures
 Enabled by HLL compilers, UNIX
 Lead to RISC architectures
 Together have enabled:
 Lightweight computers
 Productivity-based managed/interpreted
programming languages
Copyright © 2019, Elsevier Inc. All rights reserved.
Introduction
3
Single Processor Performance
Copyright © 2019, Elsevier Inc. All rights reserved.
Introduction
4
Copyright © 2019, Elsevier Inc. All rights reserved.
Current Trends in Architecture
 Cannot continue to leverage Instruction-Level
parallelism (ILP)
 Single processor performance improvement ended in
2003
 New models for performance:
 Data-level parallelism (DLP)
 Thread-level parallelism (TLP)
 Request-level parallelism (RLP)
 These require explicit restructuring of the
application
Introduction
5
Copyright © 2019, Elsevier Inc. All rights reserved.
Classes of Computers
 Personal Mobile Device (PMD)
 e.g. start phones, tablet computers
 Emphasis on energy efficiency and real-time
 Desktop Computing
 Emphasis on price-performance
 Servers
 Emphasis on availability, scalability, throughput
 Clusters / Warehouse Scale Computers
 Used for “Software as a Service (SaaS)”
 Emphasis on availability and price-performance
 Sub-class: Supercomputers, emphasis: floating-point
performance and fast internal networks
 Internet of Things/Embedded Computers
 Emphasis: price
Classes
of
Computers
6
Copyright © 2019, Elsevier Inc. All rights reserved.
Parallelism
 Classes of parallelism in applications:
 Data-Level Parallelism (DLP)
 Task-Level Parallelism (TLP)
 Classes of architectural parallelism:
 Instruction-Level Parallelism (ILP)
 Vector architectures/Graphic Processor Units (GPUs)
 Thread-Level Parallelism
 Request-Level Parallelism
Classes
of
Computers
7
Copyright © 2019, Elsevier Inc. All rights reserved.
Flynn’s Taxonomy
 Single instruction stream, single data stream (SISD)
 Single instruction stream, multiple data streams (SIMD)
 Vector architectures
 Multimedia extensions
 Graphics processor units
 Multiple instruction streams, single data stream (MISD)
 No commercial implementation
 Multiple instruction streams, multiple data streams
(MIMD)
 Tightly-coupled MIMD
 Loosely-coupled MIMD
Classes
of
Computers
8
Copyright © 2019, Elsevier Inc. All rights reserved.
Defining Computer Architecture
 “Old” view of computer architecture:
 Instruction Set Architecture (ISA) design
 i.e. decisions regarding:
 registers, memory addressing, addressing modes,
instruction operands, available operations, control flow
instructions, instruction encoding
 “Real” computer architecture:
 Specific requirements of the target machine
 Design to maximize performance within constraints:
cost, power, and availability
 Includes ISA, microarchitecture, hardware
Defining
Computer
Architecture
9
Instruction Set Architecture
 Class of ISA
 General-purpose registers
 Register-memory vs load-store
 RISC-V registers
 32 g.p., 32 f.p.
Copyright © 2019, Elsevier Inc. All rights reserved.
Defining
Computer
Architecture
Register Name Use Saver
x0 zero constant 0 n/a
x1 ra return addr caller
x2 sp stack ptr callee
x3 gp gbl ptr
x4 tp thread ptr
x5-x7 t0-t2 temporaries caller
x8 s0/fp saved/
frame ptr
callee
Register Name Use Saver
x9 s1 saved callee
x10-x17 a0-a7 arguments caller
x18-x27 s2-s11 saved callee
x28-x31 t3-t6 temporaries caller
f0-f7 ft0-ft7 FP temps caller
f8-f9 fs0-fs1 FP saved callee
f10-f17 fa0-fa7 FP
arguments
callee
f18-f27 fs2-fs21 FP saved callee
f28-f31 ft8-ft11 FP temps caller
10
Instruction Set Architecture
 Memory addressing
 RISC-V: byte addressed, aligned accesses faster
 Addressing modes
 RISC-V: Register, immediate, displacement
(base+offset)
 Other examples: autoincrement, indexed, PC-relative
 Types and size of operands
 RISC-V: 8-bit, 32-bit, 64-bit
Copyright © 2019, Elsevier Inc. All rights reserved.
Defining
Computer
Architecture
11
Instruction Set Architecture
 Operations
 RISC-V: data transfer, arithmetic, logical, control,
floating point
 See Fig. 1.5 in text
 Control flow instructions
 Use content of registers (RISC-V) vs. status bits (x86,
ARMv7, ARMv8)
 Return address in register (RISC-V, ARMv7, ARMv8)
vs. on stack (x86)
 Encoding
 Fixed (RISC-V, ARMv7/v8 except compact instruction
set) vs. variable length (x86)
Copyright © 2019, Elsevier Inc. All rights reserved.
Defining
Computer
Architecture
12
Copyright © 2019, Elsevier Inc. All rights reserved.
Trends in Technology
 Integrated circuit technology (Moore’s Law)
 Transistor density: 35%/year
 Die size: 10-20%/year
 Integration overall: 40-55%/year
 DRAM capacity: 25-40%/year (slowing)
 8 Gb (2014), 16 Gb (2019), possibly no 32 Gb
 Flash capacity: 50-60%/year
 8-10X cheaper/bit than DRAM
 Magnetic disk capacity: recently slowed to 5%/year
 Density increases may no longer be possible, maybe increase from 7 to
9 platters
 8-10X cheaper/bit then Flash
 200-300X cheaper/bit than DRAM
Trends
in
Technology
13
Copyright © 2019, Elsevier Inc. All rights reserved.
Bandwidth and Latency
 Bandwidth or throughput
 Total work done in a given time
 32,000-40,000X improvement for processors
 300-1200X improvement for memory and disks
 Latency or response time
 Time between start and completion of an event
 50-90X improvement for processors
 6-8X improvement for memory and disks
Trends
in
Technology
14
Copyright © 2019, Elsevier Inc. All rights reserved.
Bandwidth and Latency
Log-log plot of bandwidth and latency milestones
Trends
in
Technology
15
Copyright © 2019, Elsevier Inc. All rights reserved.
Transistors and Wires
 Feature size
 Minimum size of transistor or wire in x or y
dimension
 10 microns in 1971 to .011 microns in 2017
 Transistor performance scales linearly
 Wire delay does not improve with feature size!
 Integration density scales quadratically
Trends
in
Technology
16
Copyright © 2019, Elsevier Inc. All rights reserved.
Power and Energy
 Problem: Get power in, get power out
 Thermal Design Power (TDP)
 Characterizes sustained power consumption
 Used as target for power supply and cooling system
 Lower than peak power (1.5X higher), higher than
average power consumption
 Clock rate can be reduced dynamically to limit
power consumption
 Energy per task is often a better measurement
Trends
in
Power
and
Energy
17
Copyright © 2019, Elsevier Inc. All rights reserved.
Dynamic Energy and Power
 Dynamic energy
 Transistor switch from 0 -> 1 or 1 -> 0
 ½ x Capacitive load x Voltage2
 Dynamic power
 ½ x Capacitive load x Voltage2 x Frequency switched
 Reducing clock rate reduces power, not energy
Trends
in
Power
and
Energy
18
Copyright © 2019, Elsevier Inc. All rights reserved.
Power
 Intel 80386
consumed ~ 2 W
 3.3 GHz Intel
Core i7 consumes
130 W
 Heat must be
dissipated from
1.5 x 1.5 cm chip
 This is the limit of
what can be
cooled by air
Trends
in
Power
and
Energy
19
Copyright © 2019, Elsevier Inc. All rights reserved.
Reducing Power
 Techniques for reducing power:
 Do nothing well
 Dynamic Voltage-Frequency Scaling
 Low power state for DRAM, disks
 Overclocking, turning off cores
Trends
in
Power
and
Energy
20
Copyright © 2019, Elsevier Inc. All rights reserved.
Static Power
 Static power consumption
 25-50% of total power
 Currentstatic x Voltage
 Scales with number of transistors
 To reduce: power gating
Trends
in
Power
and
Energy
21
Copyright © 2019, Elsevier Inc. All rights reserved.
Trends in Cost
 Cost driven down by learning curve
 Yield
 DRAM: price closely tracks cost
 Microprocessors: price depends on
volume
 10% less for each doubling of volume
Trends
in
Cost
22
Copyright © 2019, Elsevier Inc. All rights reserved.
Integrated Circuit Cost
 Integrated circuit
 Bose-Einstein formula:
 Defects per unit area = 0.016-0.057 defects per square cm (2010)
 N = process-complexity factor = 11.5-15.5 (40 nm, 2010)
Trends
in
Cost
23
Copyright © 2019, Elsevier Inc. All rights reserved.
Dependability
 Module reliability
 Mean time to failure (MTTF)
 Mean time to repair (MTTR)
 Mean time between failures (MTBF) = MTTF + MTTR
 Availability = MTTF / MTBF
Dependability
24
Copyright © 2019, Elsevier Inc. All rights reserved.
Measuring Performance
 Typical performance metrics:
 Response time
 Throughput
 Speedup of X relative to Y
 Execution timeY / Execution timeX
 Execution time
 Wall clock time: includes all system overheads
 CPU time: only computation time
 Benchmarks
 Kernels (e.g. matrix multiply)
 Toy programs (e.g. sorting)
 Synthetic benchmarks (e.g. Dhrystone)
 Benchmark suites (e.g. SPEC06fp, TPC-C)
Measuring
Performance
25
Copyright © 2019, Elsevier Inc. All rights reserved.
Principles of Computer Design
 Take Advantage of Parallelism
 e.g. multiple processors, disks, memory banks,
pipelining, multiple functional units
 Principle of Locality
 Reuse of data and instructions
 Focus on the Common Case
 Amdahl’s Law
Principles
26
Copyright © 2019, Elsevier Inc. All rights reserved.
Principles of Computer Design
 The Processor Performance Equation
Principles
27
Copyright © 2019, Elsevier Inc. All rights reserved.
Principles of Computer Design
Principles
 Different instruction types having different
CPIs
28
Copyright © 2019, Elsevier Inc. All rights reserved.
Principles of Computer Design
Principles
 Different instruction types having different
CPIs
29
Fallacies and Pitfalls
 All exponential laws must come to an end
 Dennard scaling (constant power density)
 Stopped by threshold voltage
 Disk capacity
 30-100% per year to 5% per year
 Moore’s Law
 Most visible with DRAM capacity
 ITRS disbanded
 Only four foundries left producing state-of-the-art
logic chips
 11 nm, 3 nm might be the limit
Copyright © 2019, Elsevier Inc. All rights reserved.
30
Fallacies and Pitfalls
 Microprocessors are a silver bullet
 Performance is now a programmer’s burden
 Falling prey to Amdahl’s Law
 A single point of failure
 Hardware enhancements that increase
performance also improve energy
efficiency, or are at worst energy neutral
 Benchmarks remain valid indefinitely
 Compiler optimizations target benchmarks
Copyright © 2019, Elsevier Inc. All rights reserved.
31
Fallacies and Pitfalls
 The rated mean time to failure of disks is
1,200,000 hours or almost 140 years, so
disks practically never fail
 MTTF value from manufacturers assume
regular replacement
 Peak performance tracks observed
performance
 Fault detection can lower availability
 Not all operations are needed for correct
execution
Copyright © 2019, Elsevier Inc. All rights reserved.

Chapter 1.pptx

  • 1.
    1 Copyright © 2019,Elsevier Inc. All rights reserved. Chapter 1 Fundamentals of Quantitative Design and Analysis Computer Architecture A Quantitative Approach, Sixth Edition
  • 2.
    2 Computer Technology  Performanceimprovements:  Improvements in semiconductor technology  Feature size, clock speed  Improvements in computer architectures  Enabled by HLL compilers, UNIX  Lead to RISC architectures  Together have enabled:  Lightweight computers  Productivity-based managed/interpreted programming languages Copyright © 2019, Elsevier Inc. All rights reserved. Introduction
  • 3.
    3 Single Processor Performance Copyright© 2019, Elsevier Inc. All rights reserved. Introduction
  • 4.
    4 Copyright © 2019,Elsevier Inc. All rights reserved. Current Trends in Architecture  Cannot continue to leverage Instruction-Level parallelism (ILP)  Single processor performance improvement ended in 2003  New models for performance:  Data-level parallelism (DLP)  Thread-level parallelism (TLP)  Request-level parallelism (RLP)  These require explicit restructuring of the application Introduction
  • 5.
    5 Copyright © 2019,Elsevier Inc. All rights reserved. Classes of Computers  Personal Mobile Device (PMD)  e.g. start phones, tablet computers  Emphasis on energy efficiency and real-time  Desktop Computing  Emphasis on price-performance  Servers  Emphasis on availability, scalability, throughput  Clusters / Warehouse Scale Computers  Used for “Software as a Service (SaaS)”  Emphasis on availability and price-performance  Sub-class: Supercomputers, emphasis: floating-point performance and fast internal networks  Internet of Things/Embedded Computers  Emphasis: price Classes of Computers
  • 6.
    6 Copyright © 2019,Elsevier Inc. All rights reserved. Parallelism  Classes of parallelism in applications:  Data-Level Parallelism (DLP)  Task-Level Parallelism (TLP)  Classes of architectural parallelism:  Instruction-Level Parallelism (ILP)  Vector architectures/Graphic Processor Units (GPUs)  Thread-Level Parallelism  Request-Level Parallelism Classes of Computers
  • 7.
    7 Copyright © 2019,Elsevier Inc. All rights reserved. Flynn’s Taxonomy  Single instruction stream, single data stream (SISD)  Single instruction stream, multiple data streams (SIMD)  Vector architectures  Multimedia extensions  Graphics processor units  Multiple instruction streams, single data stream (MISD)  No commercial implementation  Multiple instruction streams, multiple data streams (MIMD)  Tightly-coupled MIMD  Loosely-coupled MIMD Classes of Computers
  • 8.
    8 Copyright © 2019,Elsevier Inc. All rights reserved. Defining Computer Architecture  “Old” view of computer architecture:  Instruction Set Architecture (ISA) design  i.e. decisions regarding:  registers, memory addressing, addressing modes, instruction operands, available operations, control flow instructions, instruction encoding  “Real” computer architecture:  Specific requirements of the target machine  Design to maximize performance within constraints: cost, power, and availability  Includes ISA, microarchitecture, hardware Defining Computer Architecture
  • 9.
    9 Instruction Set Architecture Class of ISA  General-purpose registers  Register-memory vs load-store  RISC-V registers  32 g.p., 32 f.p. Copyright © 2019, Elsevier Inc. All rights reserved. Defining Computer Architecture Register Name Use Saver x0 zero constant 0 n/a x1 ra return addr caller x2 sp stack ptr callee x3 gp gbl ptr x4 tp thread ptr x5-x7 t0-t2 temporaries caller x8 s0/fp saved/ frame ptr callee Register Name Use Saver x9 s1 saved callee x10-x17 a0-a7 arguments caller x18-x27 s2-s11 saved callee x28-x31 t3-t6 temporaries caller f0-f7 ft0-ft7 FP temps caller f8-f9 fs0-fs1 FP saved callee f10-f17 fa0-fa7 FP arguments callee f18-f27 fs2-fs21 FP saved callee f28-f31 ft8-ft11 FP temps caller
  • 10.
    10 Instruction Set Architecture Memory addressing  RISC-V: byte addressed, aligned accesses faster  Addressing modes  RISC-V: Register, immediate, displacement (base+offset)  Other examples: autoincrement, indexed, PC-relative  Types and size of operands  RISC-V: 8-bit, 32-bit, 64-bit Copyright © 2019, Elsevier Inc. All rights reserved. Defining Computer Architecture
  • 11.
    11 Instruction Set Architecture Operations  RISC-V: data transfer, arithmetic, logical, control, floating point  See Fig. 1.5 in text  Control flow instructions  Use content of registers (RISC-V) vs. status bits (x86, ARMv7, ARMv8)  Return address in register (RISC-V, ARMv7, ARMv8) vs. on stack (x86)  Encoding  Fixed (RISC-V, ARMv7/v8 except compact instruction set) vs. variable length (x86) Copyright © 2019, Elsevier Inc. All rights reserved. Defining Computer Architecture
  • 12.
    12 Copyright © 2019,Elsevier Inc. All rights reserved. Trends in Technology  Integrated circuit technology (Moore’s Law)  Transistor density: 35%/year  Die size: 10-20%/year  Integration overall: 40-55%/year  DRAM capacity: 25-40%/year (slowing)  8 Gb (2014), 16 Gb (2019), possibly no 32 Gb  Flash capacity: 50-60%/year  8-10X cheaper/bit than DRAM  Magnetic disk capacity: recently slowed to 5%/year  Density increases may no longer be possible, maybe increase from 7 to 9 platters  8-10X cheaper/bit then Flash  200-300X cheaper/bit than DRAM Trends in Technology
  • 13.
    13 Copyright © 2019,Elsevier Inc. All rights reserved. Bandwidth and Latency  Bandwidth or throughput  Total work done in a given time  32,000-40,000X improvement for processors  300-1200X improvement for memory and disks  Latency or response time  Time between start and completion of an event  50-90X improvement for processors  6-8X improvement for memory and disks Trends in Technology
  • 14.
    14 Copyright © 2019,Elsevier Inc. All rights reserved. Bandwidth and Latency Log-log plot of bandwidth and latency milestones Trends in Technology
  • 15.
    15 Copyright © 2019,Elsevier Inc. All rights reserved. Transistors and Wires  Feature size  Minimum size of transistor or wire in x or y dimension  10 microns in 1971 to .011 microns in 2017  Transistor performance scales linearly  Wire delay does not improve with feature size!  Integration density scales quadratically Trends in Technology
  • 16.
    16 Copyright © 2019,Elsevier Inc. All rights reserved. Power and Energy  Problem: Get power in, get power out  Thermal Design Power (TDP)  Characterizes sustained power consumption  Used as target for power supply and cooling system  Lower than peak power (1.5X higher), higher than average power consumption  Clock rate can be reduced dynamically to limit power consumption  Energy per task is often a better measurement Trends in Power and Energy
  • 17.
    17 Copyright © 2019,Elsevier Inc. All rights reserved. Dynamic Energy and Power  Dynamic energy  Transistor switch from 0 -> 1 or 1 -> 0  ½ x Capacitive load x Voltage2  Dynamic power  ½ x Capacitive load x Voltage2 x Frequency switched  Reducing clock rate reduces power, not energy Trends in Power and Energy
  • 18.
    18 Copyright © 2019,Elsevier Inc. All rights reserved. Power  Intel 80386 consumed ~ 2 W  3.3 GHz Intel Core i7 consumes 130 W  Heat must be dissipated from 1.5 x 1.5 cm chip  This is the limit of what can be cooled by air Trends in Power and Energy
  • 19.
    19 Copyright © 2019,Elsevier Inc. All rights reserved. Reducing Power  Techniques for reducing power:  Do nothing well  Dynamic Voltage-Frequency Scaling  Low power state for DRAM, disks  Overclocking, turning off cores Trends in Power and Energy
  • 20.
    20 Copyright © 2019,Elsevier Inc. All rights reserved. Static Power  Static power consumption  25-50% of total power  Currentstatic x Voltage  Scales with number of transistors  To reduce: power gating Trends in Power and Energy
  • 21.
    21 Copyright © 2019,Elsevier Inc. All rights reserved. Trends in Cost  Cost driven down by learning curve  Yield  DRAM: price closely tracks cost  Microprocessors: price depends on volume  10% less for each doubling of volume Trends in Cost
  • 22.
    22 Copyright © 2019,Elsevier Inc. All rights reserved. Integrated Circuit Cost  Integrated circuit  Bose-Einstein formula:  Defects per unit area = 0.016-0.057 defects per square cm (2010)  N = process-complexity factor = 11.5-15.5 (40 nm, 2010) Trends in Cost
  • 23.
    23 Copyright © 2019,Elsevier Inc. All rights reserved. Dependability  Module reliability  Mean time to failure (MTTF)  Mean time to repair (MTTR)  Mean time between failures (MTBF) = MTTF + MTTR  Availability = MTTF / MTBF Dependability
  • 24.
    24 Copyright © 2019,Elsevier Inc. All rights reserved. Measuring Performance  Typical performance metrics:  Response time  Throughput  Speedup of X relative to Y  Execution timeY / Execution timeX  Execution time  Wall clock time: includes all system overheads  CPU time: only computation time  Benchmarks  Kernels (e.g. matrix multiply)  Toy programs (e.g. sorting)  Synthetic benchmarks (e.g. Dhrystone)  Benchmark suites (e.g. SPEC06fp, TPC-C) Measuring Performance
  • 25.
    25 Copyright © 2019,Elsevier Inc. All rights reserved. Principles of Computer Design  Take Advantage of Parallelism  e.g. multiple processors, disks, memory banks, pipelining, multiple functional units  Principle of Locality  Reuse of data and instructions  Focus on the Common Case  Amdahl’s Law Principles
  • 26.
    26 Copyright © 2019,Elsevier Inc. All rights reserved. Principles of Computer Design  The Processor Performance Equation Principles
  • 27.
    27 Copyright © 2019,Elsevier Inc. All rights reserved. Principles of Computer Design Principles  Different instruction types having different CPIs
  • 28.
    28 Copyright © 2019,Elsevier Inc. All rights reserved. Principles of Computer Design Principles  Different instruction types having different CPIs
  • 29.
    29 Fallacies and Pitfalls All exponential laws must come to an end  Dennard scaling (constant power density)  Stopped by threshold voltage  Disk capacity  30-100% per year to 5% per year  Moore’s Law  Most visible with DRAM capacity  ITRS disbanded  Only four foundries left producing state-of-the-art logic chips  11 nm, 3 nm might be the limit Copyright © 2019, Elsevier Inc. All rights reserved.
  • 30.
    30 Fallacies and Pitfalls Microprocessors are a silver bullet  Performance is now a programmer’s burden  Falling prey to Amdahl’s Law  A single point of failure  Hardware enhancements that increase performance also improve energy efficiency, or are at worst energy neutral  Benchmarks remain valid indefinitely  Compiler optimizations target benchmarks Copyright © 2019, Elsevier Inc. All rights reserved.
  • 31.
    31 Fallacies and Pitfalls The rated mean time to failure of disks is 1,200,000 hours or almost 140 years, so disks practically never fail  MTTF value from manufacturers assume regular replacement  Peak performance tracks observed performance  Fault detection can lower availability  Not all operations are needed for correct execution Copyright © 2019, Elsevier Inc. All rights reserved.

Editor's Notes