Downloaded 101 times


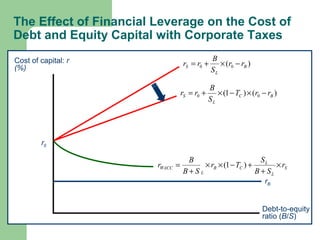
![The MM Proposition II (Corp. Taxes)
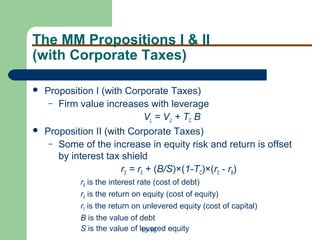
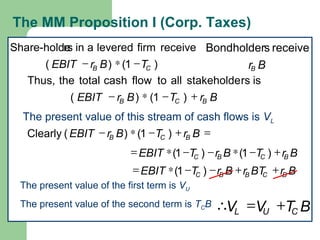
Start with M&M Proposition I with taxes:
)()1( 00 BCS rrT
S
B
rr −∗−∗+=
BTVV CUL
+=
Since BSVL
+=
The cash flows from each side of the balance sheet must equal:
BCUBS BrTrVBrSr +=+ 0
BrTrTBSBrSr BCCBS
+−+=+ 0)]1([
Divide both sides by S
BCCBS rT
S
B
rT
S
B
r
S
B
r +−+=+ 0)]1(1[
BTVBS CU
+=+⇒
)1( CU TBSV −+=
Which quickly reduces to](https://image.slidesharecdn.com/capitalstructurebasicconcepts-180503090936/85/Capital-structure-basic-concepts-18-320.jpg)
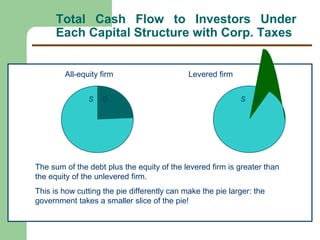
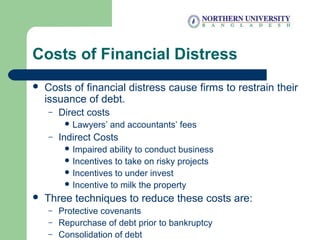


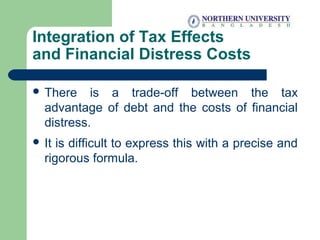
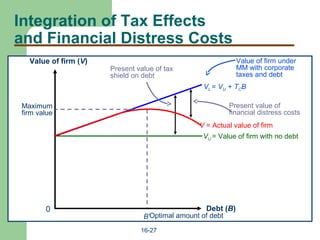
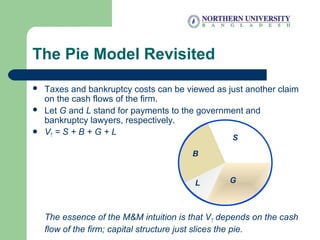


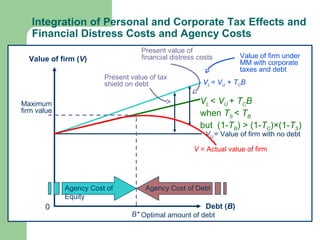


This document discusses capital structure and the limits of using debt. It introduces the concept that a firm's value is the sum of its debt and equity values. While increasing leverage can increase firm value by taking advantage of tax benefits, it also increases financial distress costs. There is an optimal capital structure that balances these factors. The document also discusses how signaling and agency costs further complicate determining the optimal structure.


