Download to read offline


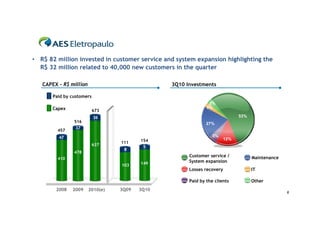


- EBITDA increased 9.8% to R$489 million compared to 3Q09 due to a 4% rise in total energy consumption and lower expenses. Net income grew 22.7% to R$289 million. - Investments totaled R$82 million, focusing on expanding the distribution system and improving customer service. - Revenues benefited from a July 2010 tariff adjustment and market growth. Operating costs were stable despite higher personnel and tax expenses. - The company continues efforts to improve operational metrics like collection rates, commercial and technical losses. Financial results were positively impacted by non-recurring items.


