Download to read offline
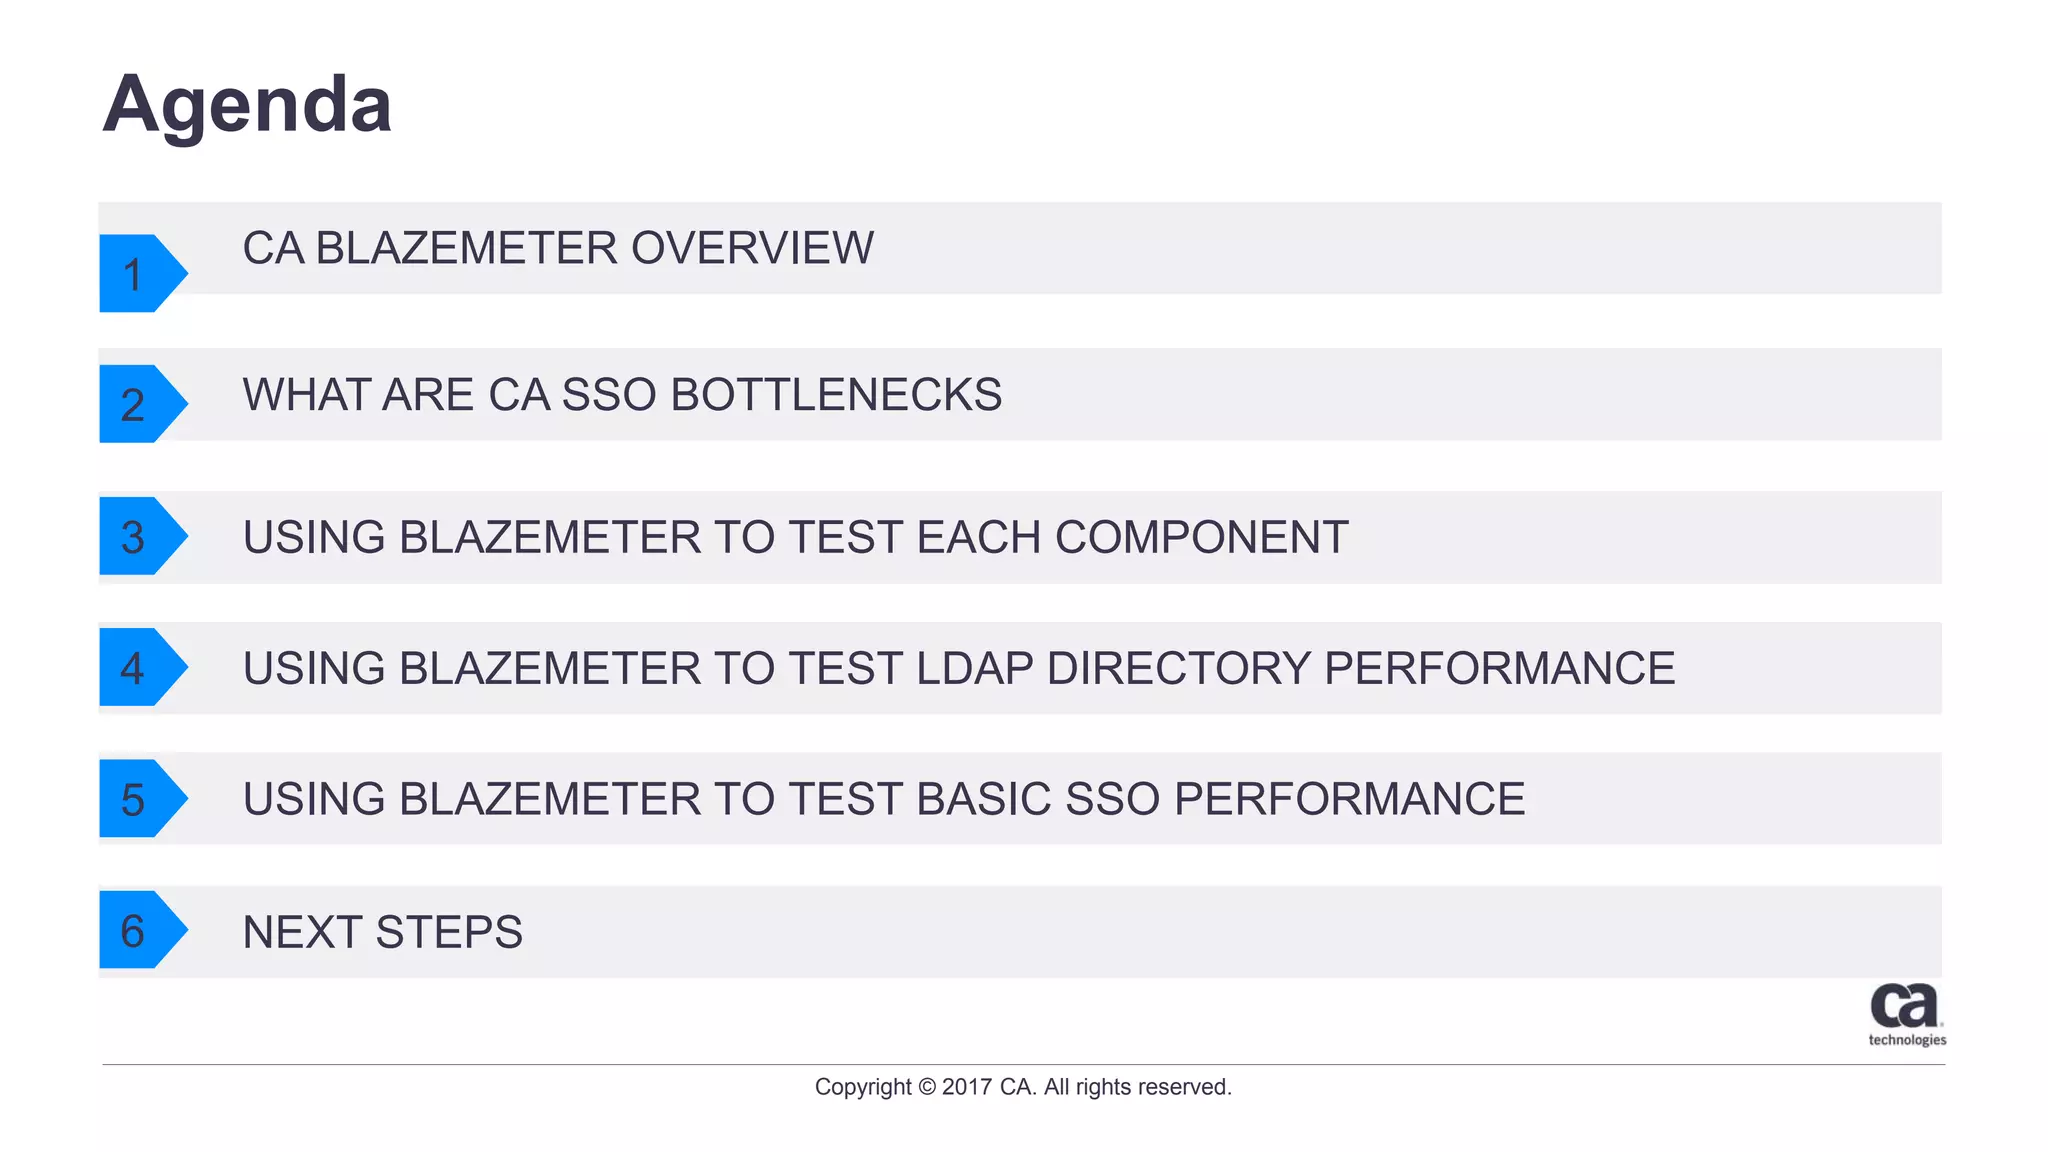
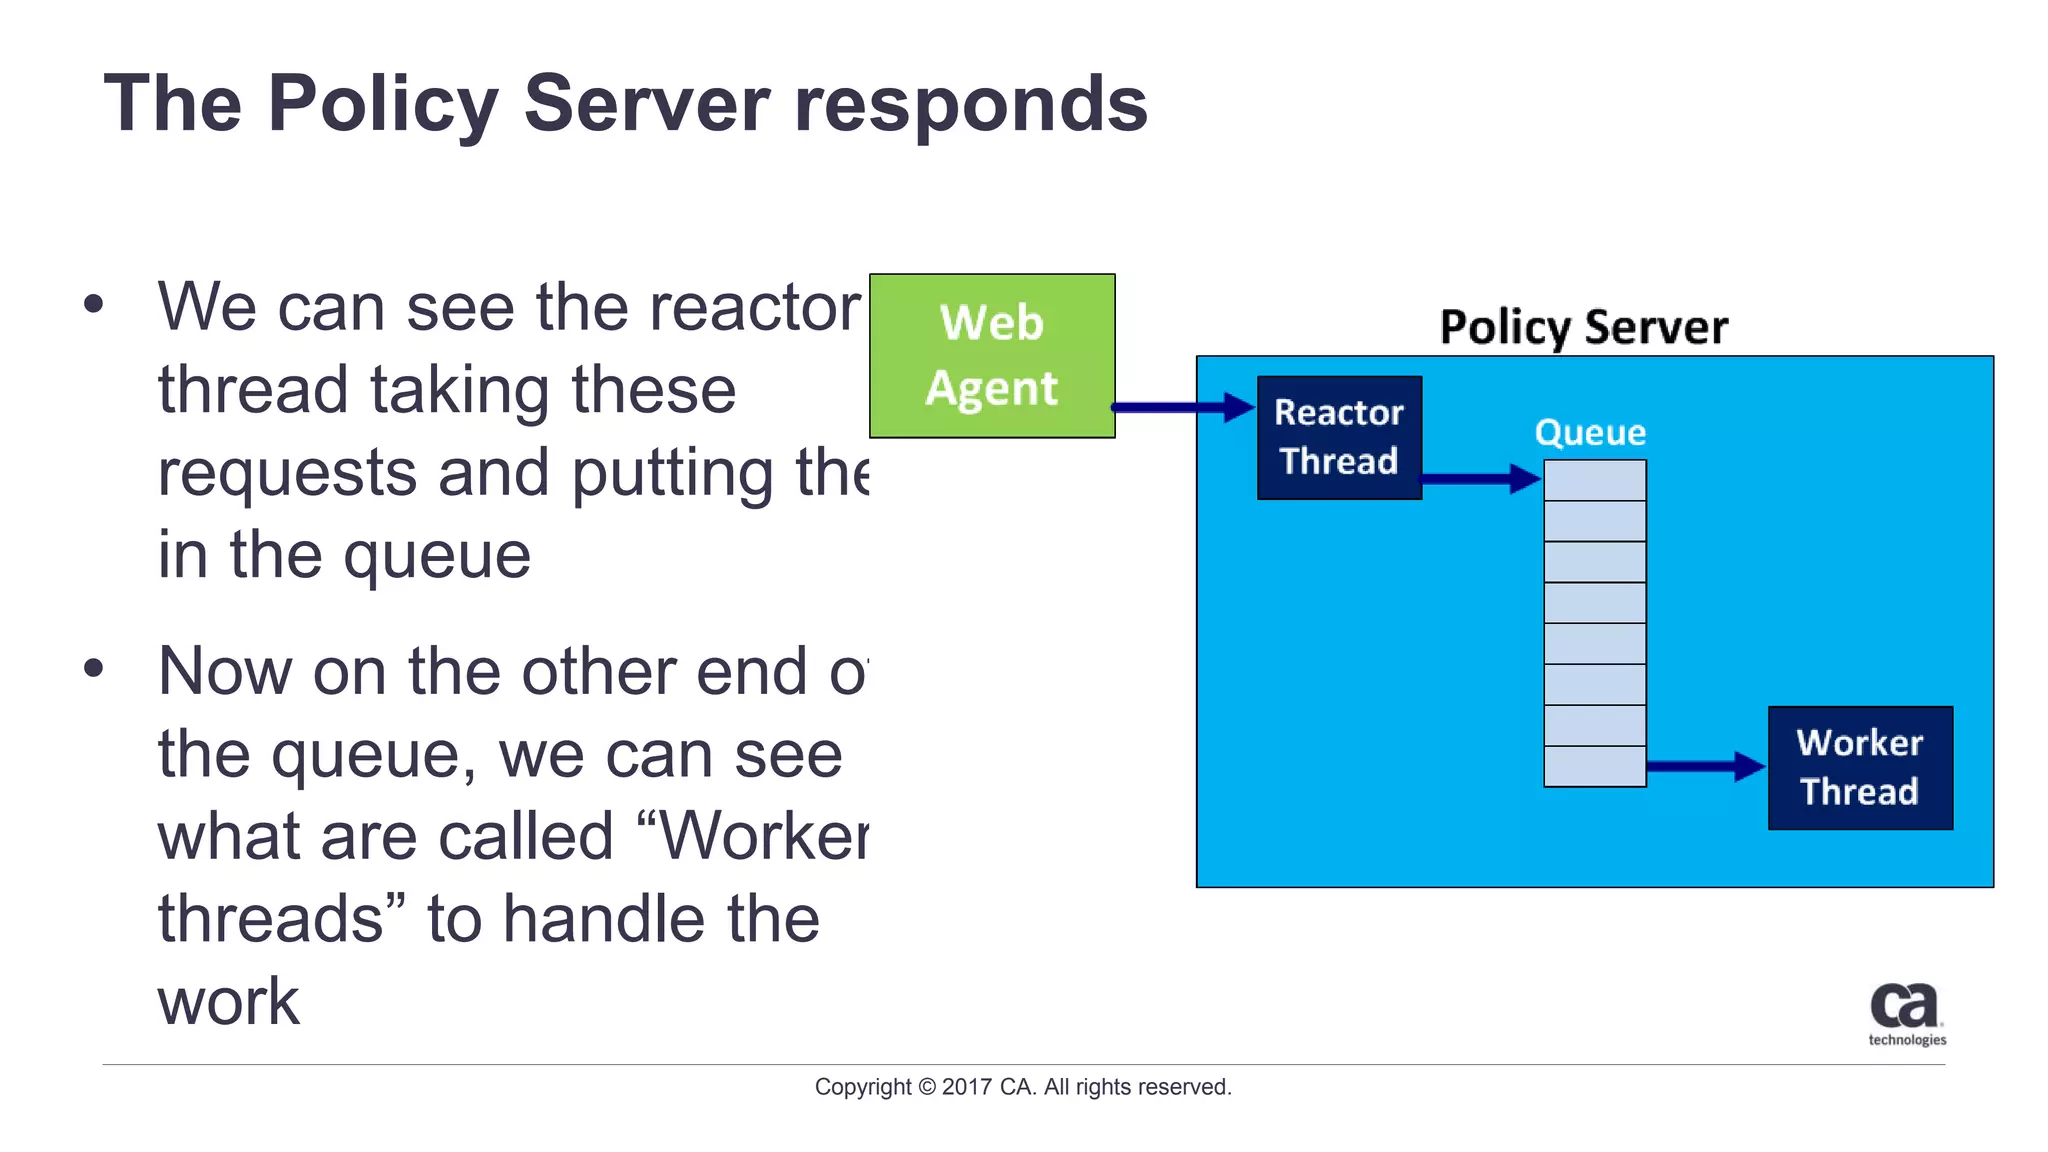
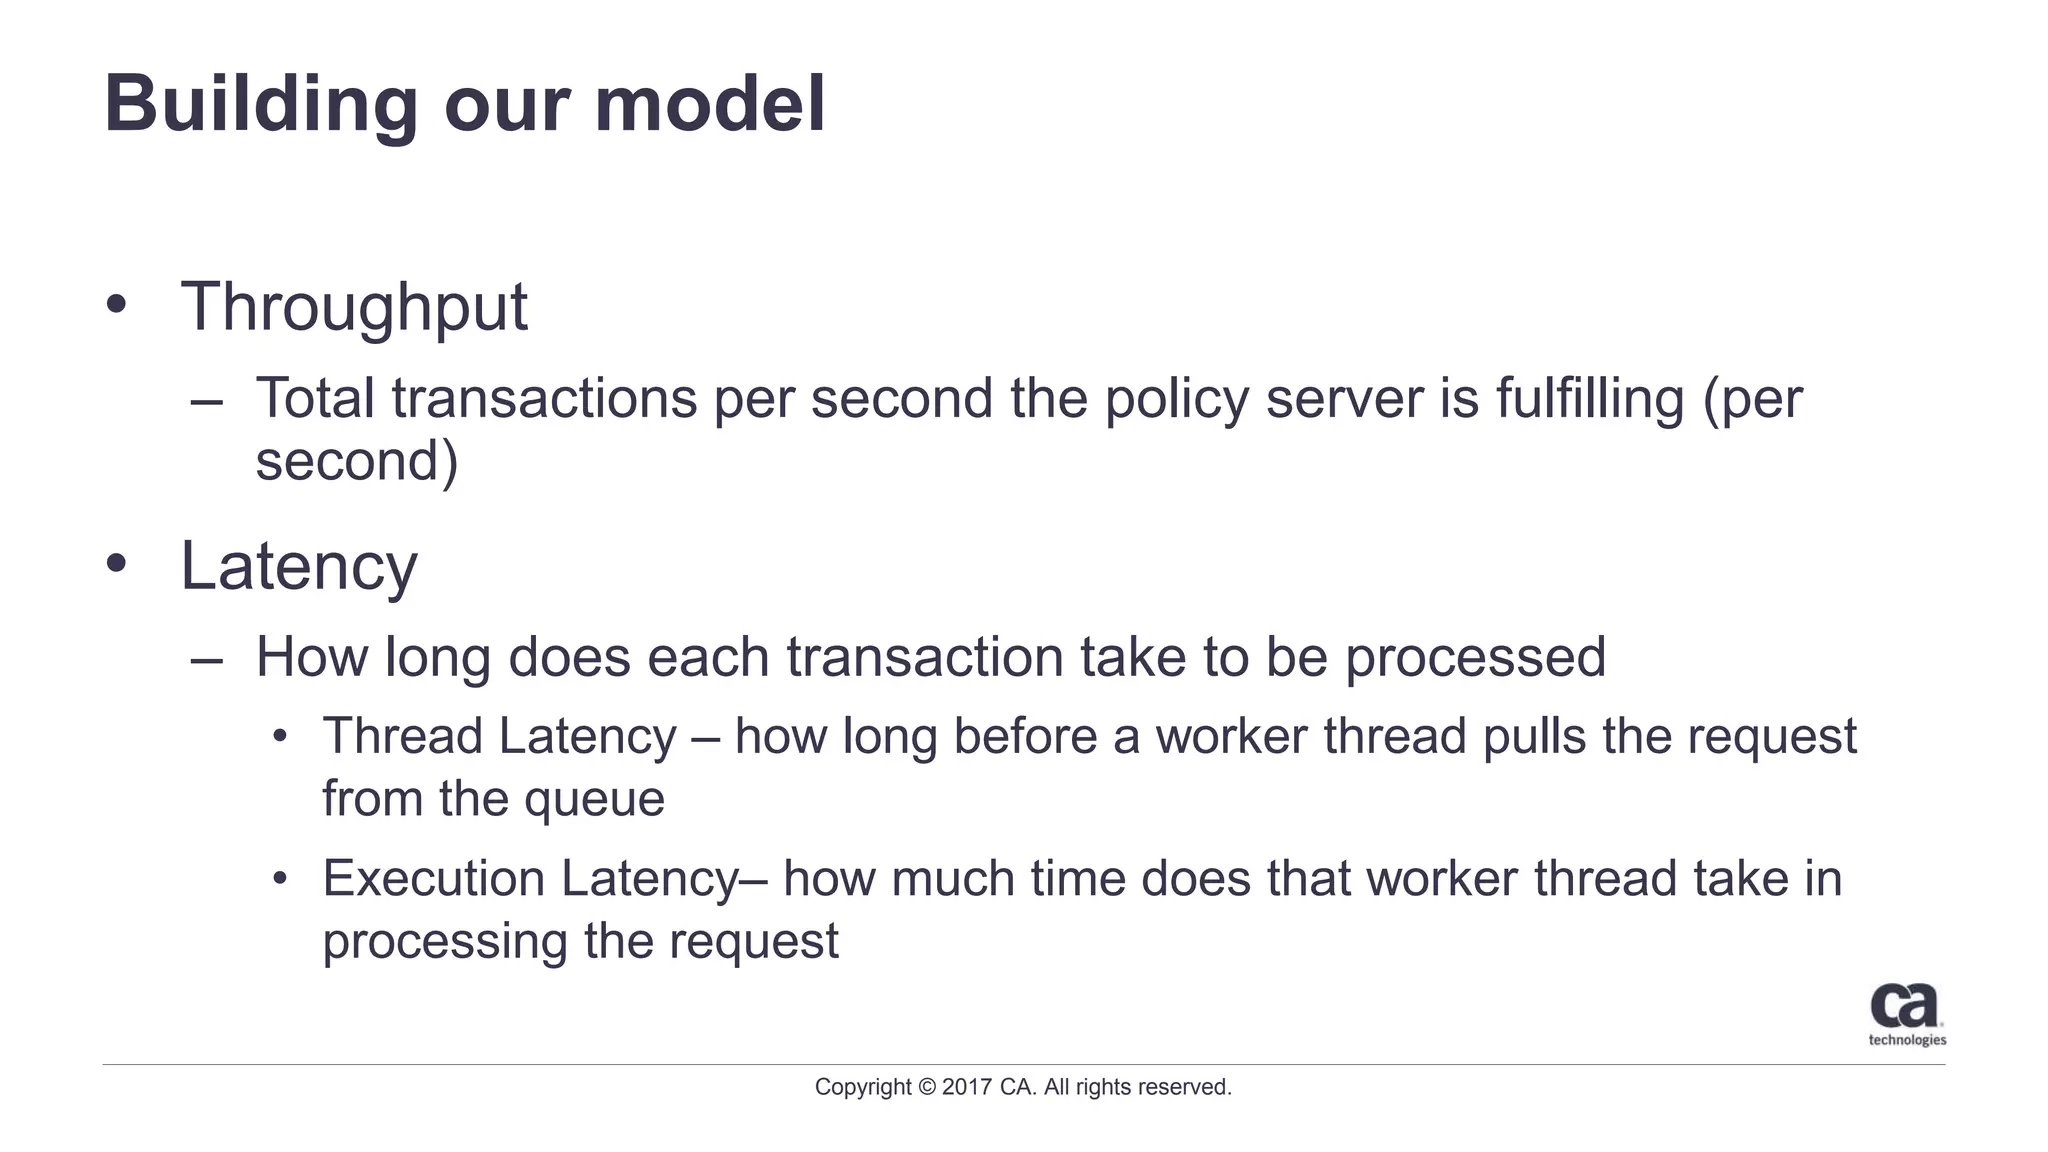
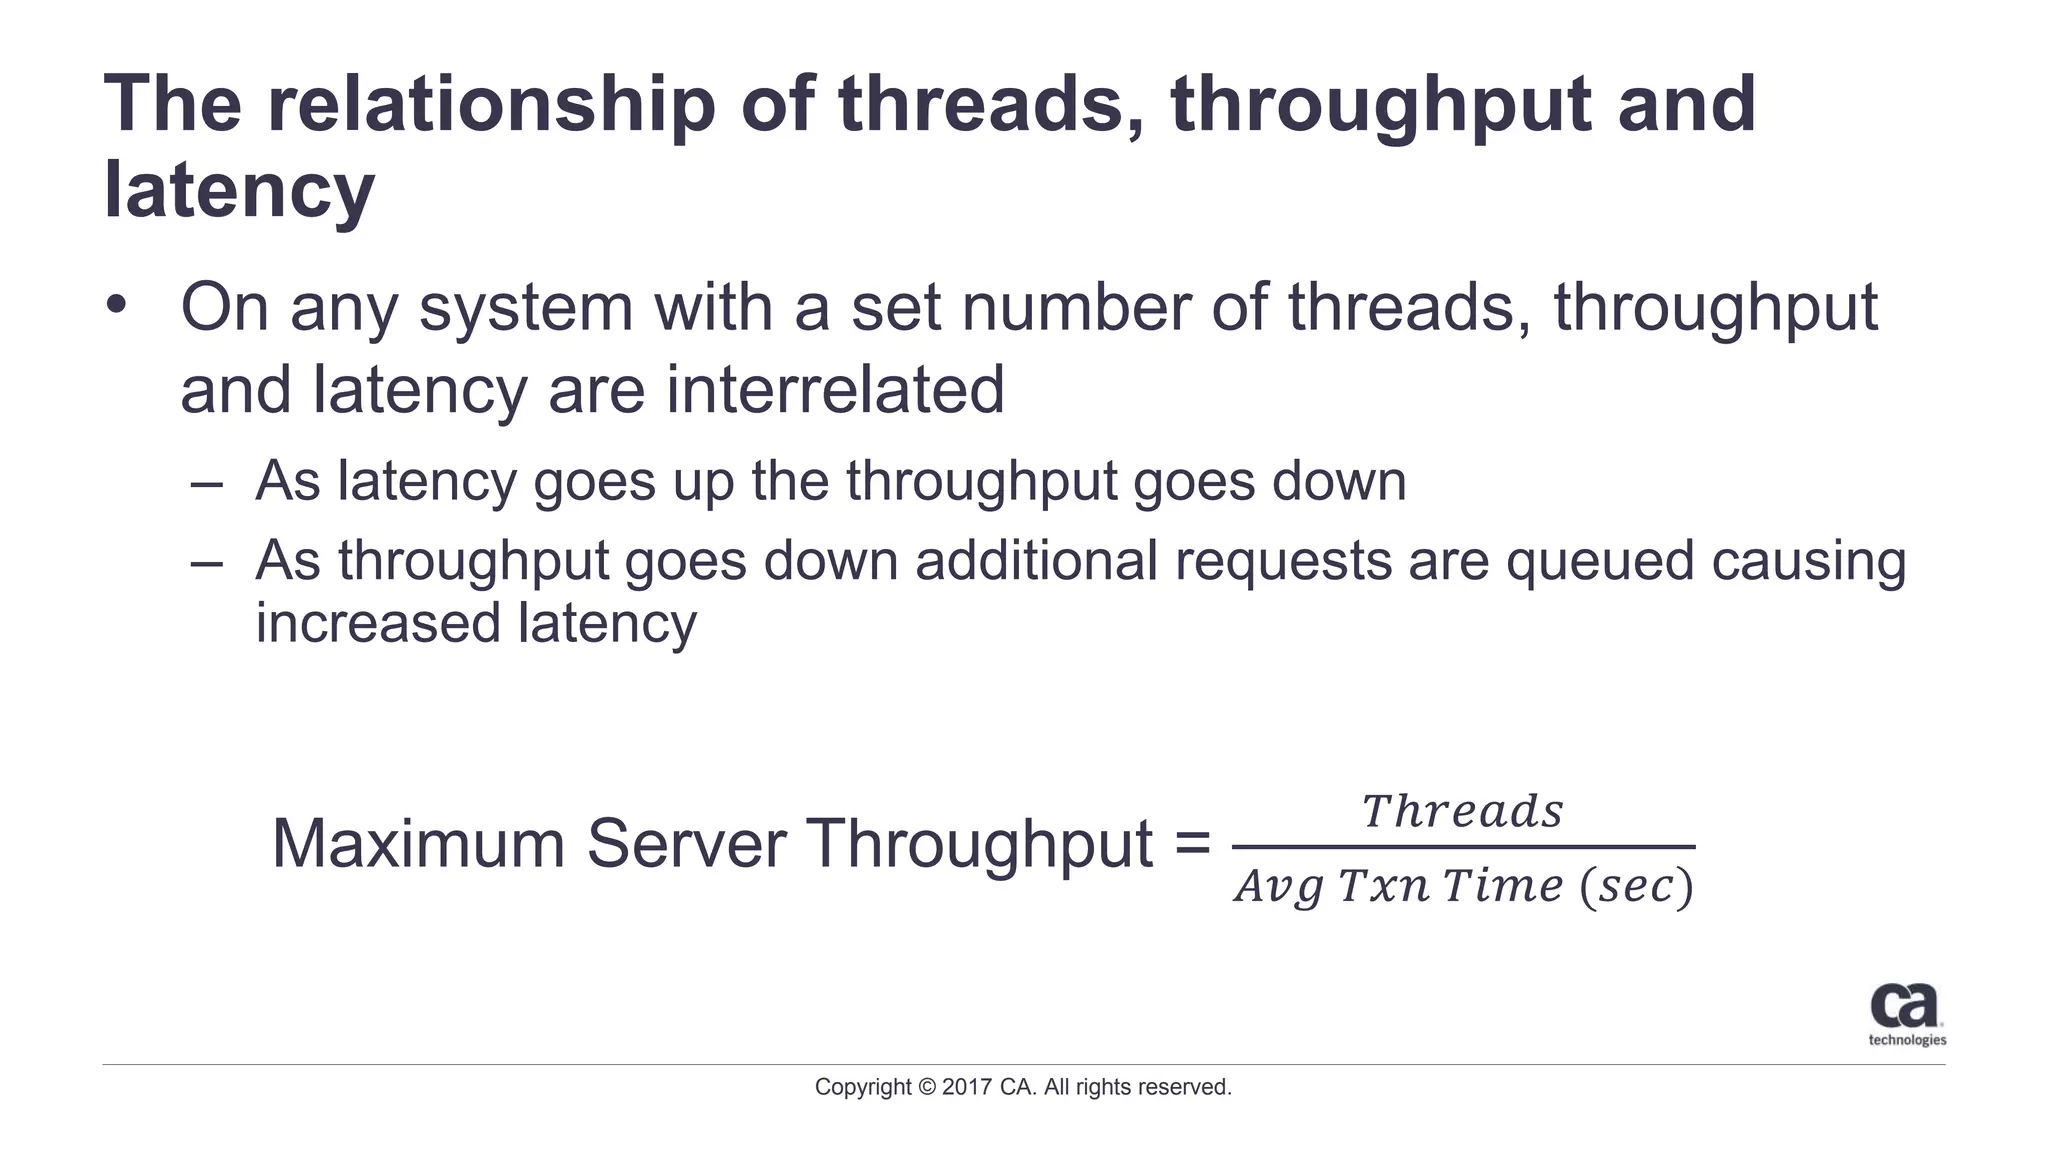
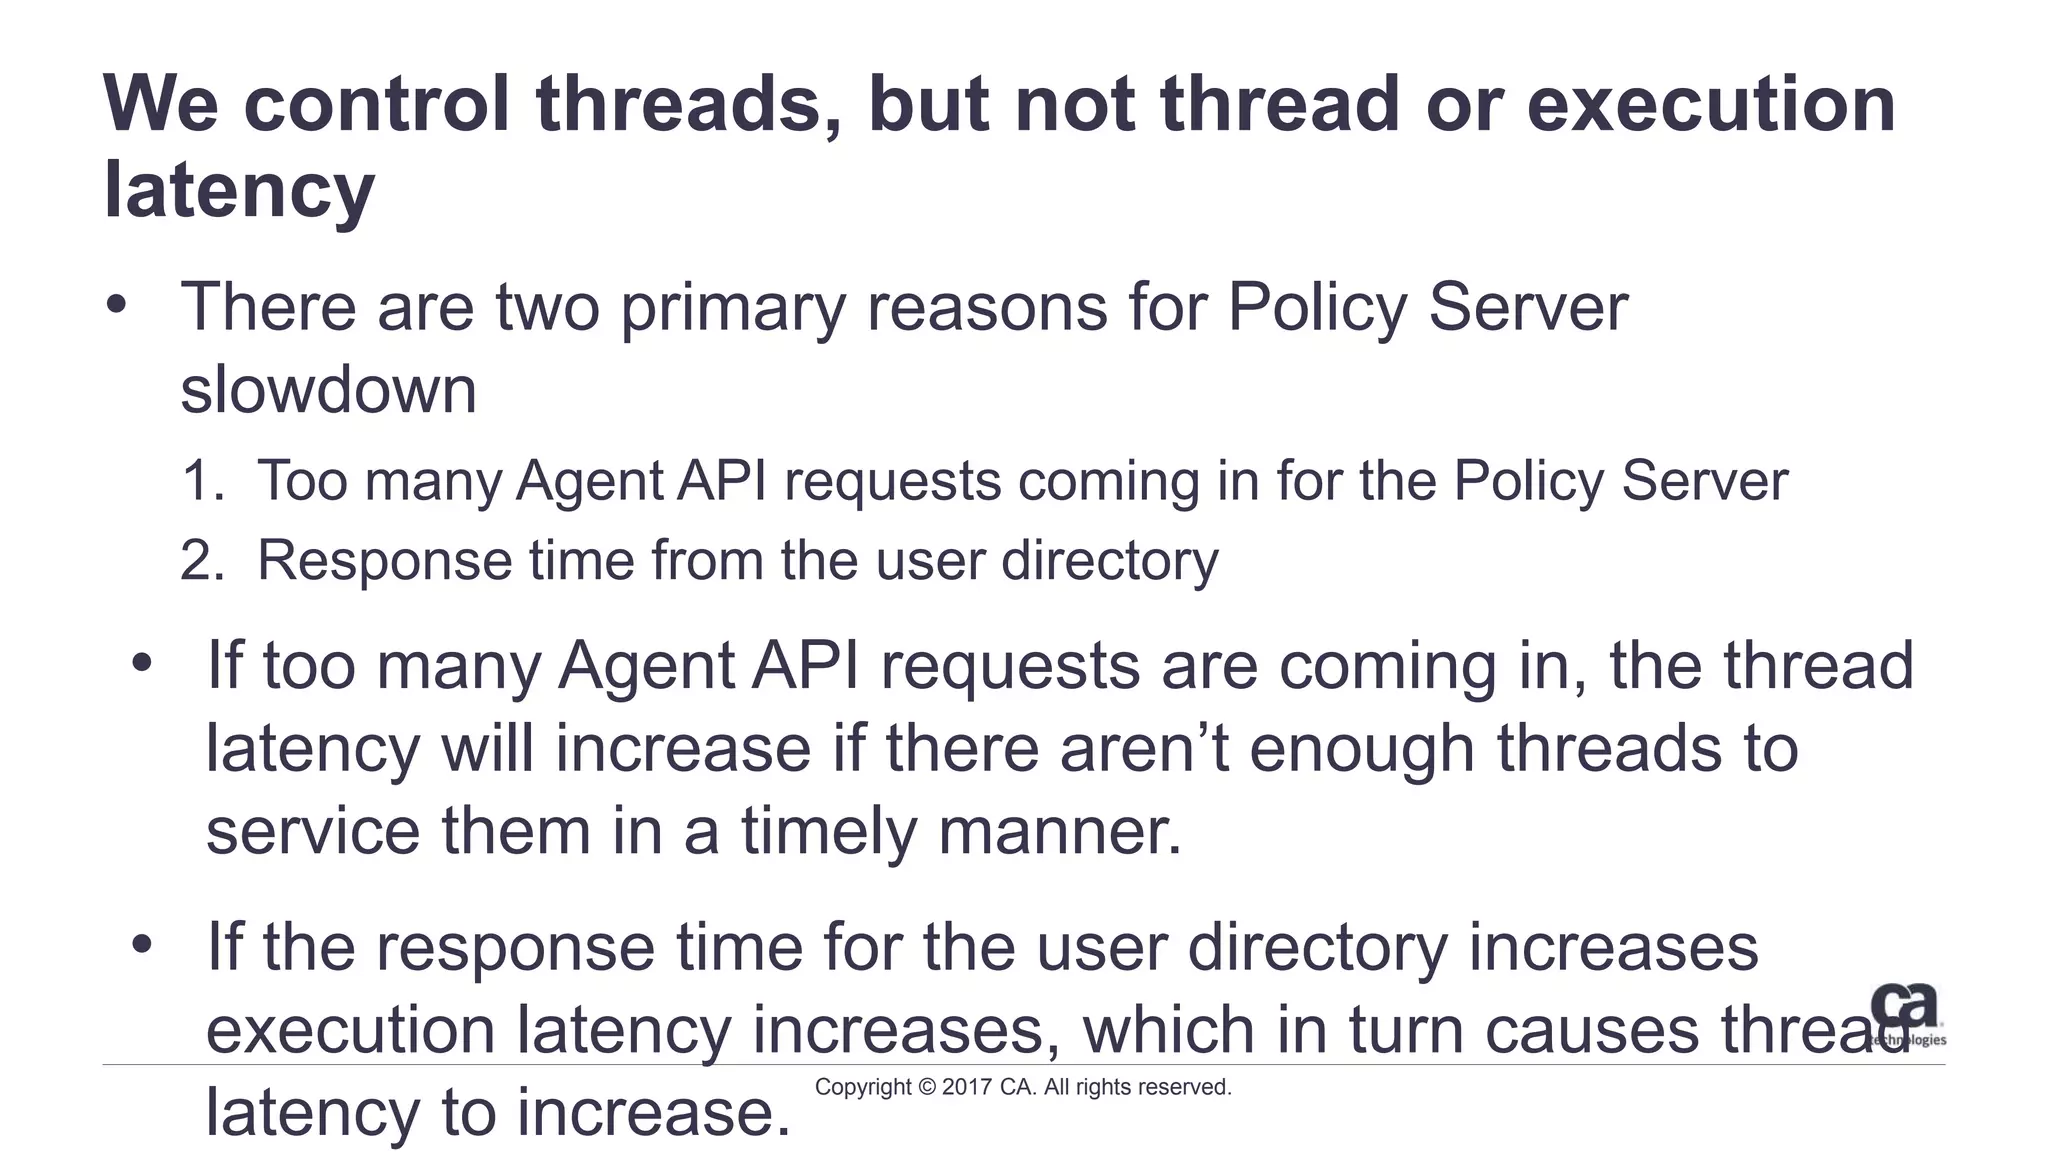
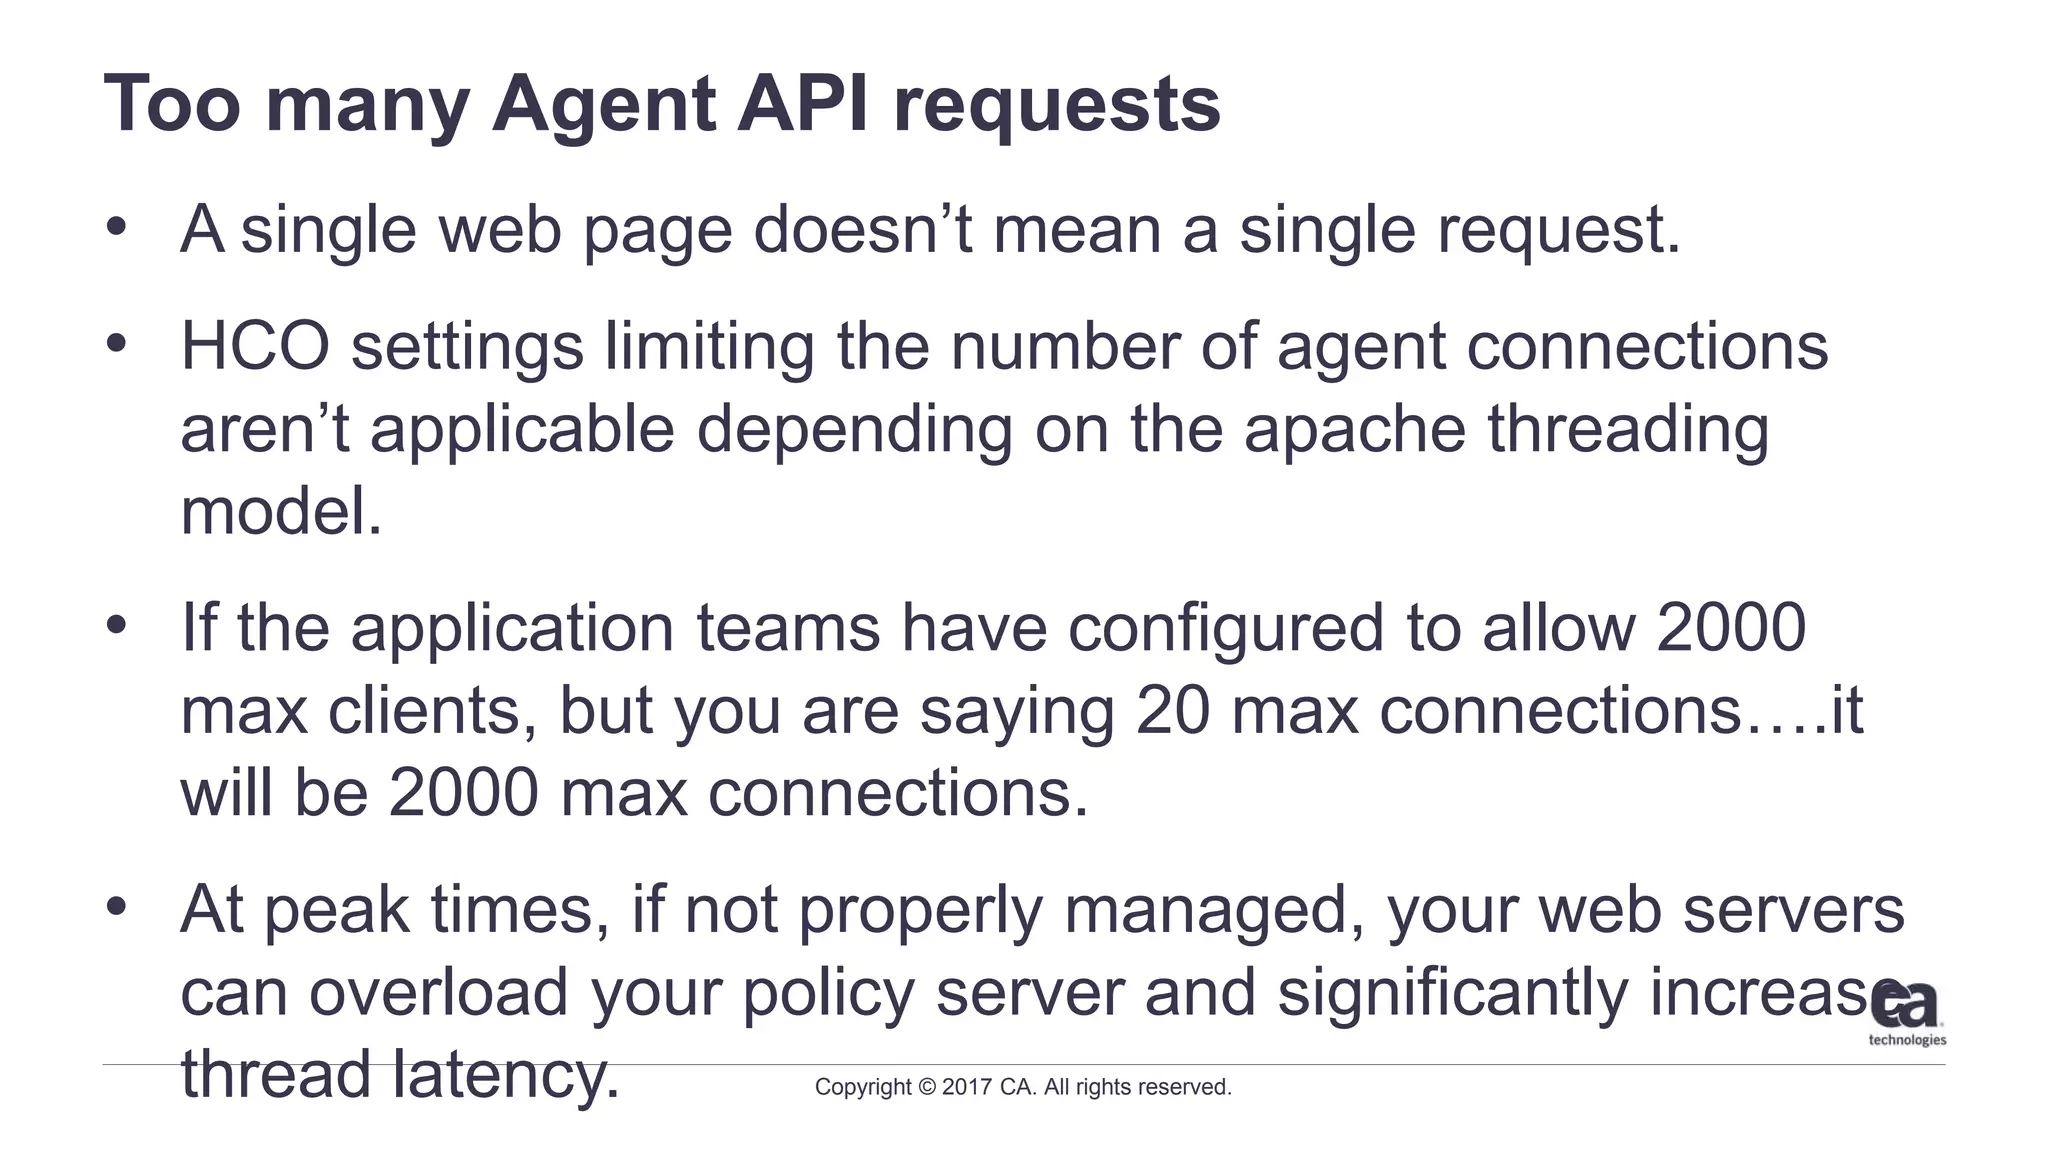
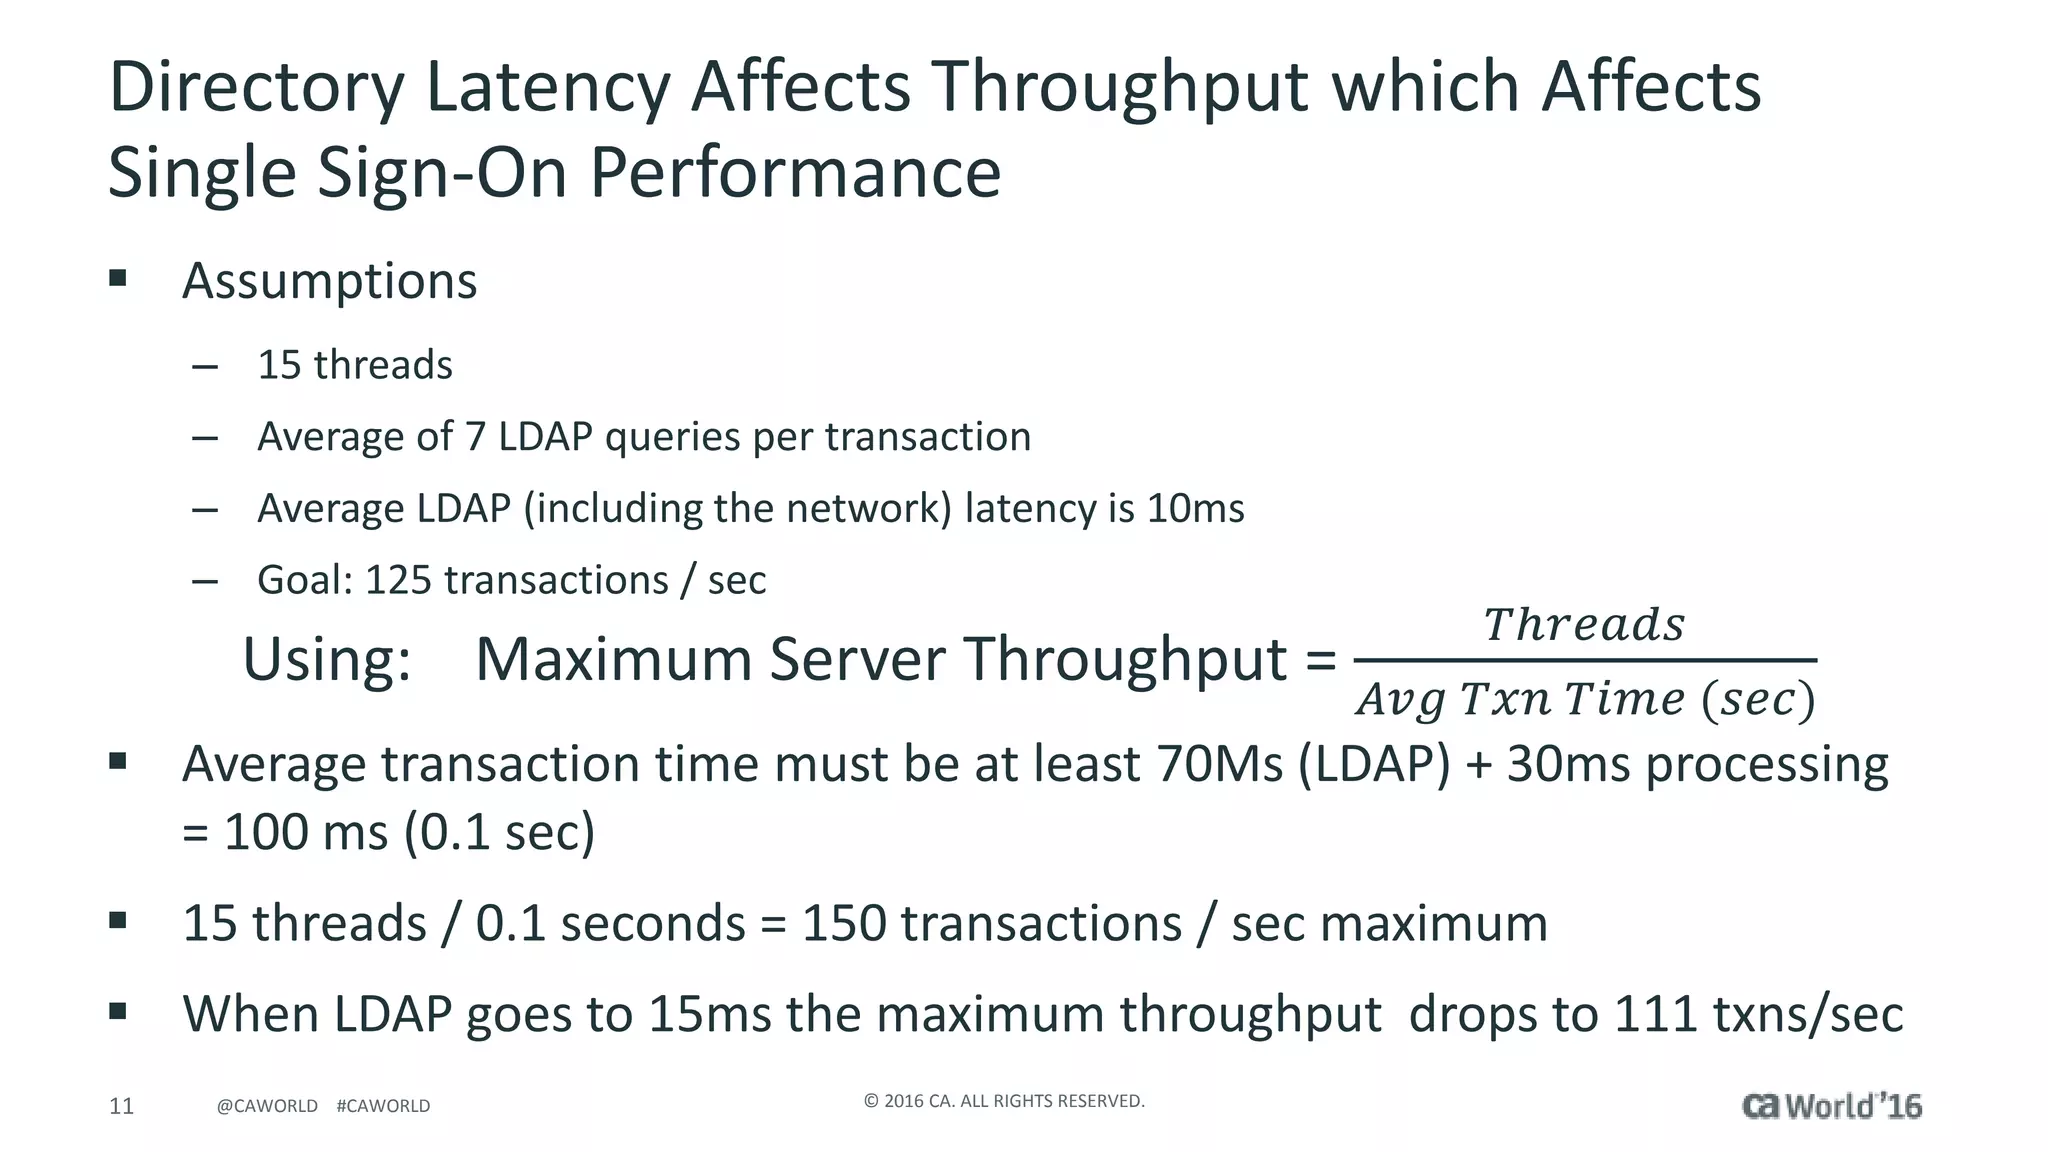


The document discusses performance testing of CA SSO using CA BlazeMeter, covering components such as thread management, throughput, and latency. It emphasizes the relationship between LDAP query response times and SSO performance while outlining methods for testing authentication and authorization. It also highlights the importance of understanding system bottlenecks and optimally managing agent API requests to prevent performance degradation.