This study investigates the structural and optical characteristics of TiO2 thin films deposited by spray pyrolysis using different precursors: titanium (III) chloride (TiCl3) and titanyl acetylacetonate (TiAcAc) at varying molar concentrations. The X-ray diffraction (XRD) results indicated that TiO2 films exhibited the anatase phase, with the optimal structural parameters obtained at higher concentrations of the TiCl3 precursor. Optical analyses revealed varying band gap energies, transmittance, refractive index, extinction coefficients, and photoluminescence emissions based on the precursor and molarity, highlighting the potential applications of these films in optoelectronic devices and environmental protection.
![Research Inventy: International Journal Of Engineering And Science
Vol.4, Issue 11 (November2014), PP 15-20
Issn (e): 2278-4721, Issn (p):2319-6483, www.researchinventy.com
15
Characteristic comparison of TiO2 thin films with an inorganic
and organic precursor at different molarities by Spray pyrolysis
I.Joseph Panneerdoss, S.Johnson Jeyakumar, M.Jothibas
Department of Physics,T.B.M.L.College,Porayar-609307,India
ABSTRACT :TiO2 thin films were deposited by spray pyrolysis technique using TiCl3 and TiAcAc as precursors
on glass substrate. The structural and optical characteristics have been studied with variation of precursor
concentration and precursor. XRD showed the structural orientation of the films especially in (101) plane
corresponding anatase phase of TiO2. Band gap energy, refractive index, extinction coefficient and dielectric
constants were estimated from U-V absorption data. The variations of these optical parameters with molar
concentrations and precursors had been studied. The intense green light emissions for the films at 0.05M and
0.1M for InCl3 precursor and U-V and violet emission for the films at 0.05M and 0.1M for TiAcAc precursor
were observed in the PL spectra.
KEYWORDS: TiAcAc, Pneumatic, Dielectric constant, organometallic.
I. INTRODUCTION
Titanium dioxide (TiO2) or titania thin films are widely studied because of their fascinating chemical,
electrical and optical properties [1,2]. TiO2 film in anatase phase could achieve the photocatalytic degradation of
organic compounds under the radiation of UV. So, it has a diversity of application views in the field of
environmental protection [3,5]. TiO2 thin film in rutile phase is known as a good blood compatibility material
and can be used as artificial heart valves [5]. In addition, TiO2 films are important optical films due to their high
reflective index and transparency over a wide spectral range [2]. During the two last decades, several methods
have been used for the TiO2 thin films preparation, [6], sol–gel method [7], chemical vapour deposition [8],
successive ionic layer adsorption and reaction (SILAR) [9], solvothermal [10], chemical bath deposition
[11] and spray pyrolysis [12]. Among these methods, spray pyrolysis technique has got many advantages such
as the low cost of the apparatus and source materials, accurate control over the deposition parameters and
producing large area films deposition compared to other deposition methods.
TiO2 films were deposited so far with Titanium (III) chloride (TiCl3), Titanium (IV) Chloride (TiCl4),
Titanium (IV) isopropoxide Ti(OCH(CH3)2)4, Titanium di-isopropoxyldi-ethyl hexanoate(Ti(OC3H7)2
(C7H15COO)2, Titanyl acetylacetonate (TiC10H14O5) etc used as precursors. Among these precursors, Titanyl
acetylacetonate (TiAcAc) is a predominant and TiCl3 is an infrequent source material for TiO2 films deposition.
In the present work we have compared the structural and optical characteristics of sprayed TiO2 films
with an inorganic precursor TiCl3 and an organic or organometallicprecursor TiAcAc at different molar
concentrations. Initially the XRD characterization of deposited films at different temperatures at a constant
precursor concentration is studied and the optimum temperature was fixed for both the precursors. Then the
optimum molarity was found by various studies of deposited TiO2 films for various precursor concentrations
with this optimum temperature. The scope of this work is to optimize the molar concentration and precursor of
highly transparent conductive TiO2 films by comparing the characteristics.
II. EXPERIMENTAL DETAILS
TiO2 films were deposited at different molarities for both the precursors by a pneumatic controlled
spray pyrolysis. TiCl3 and deionized water mixtures, TiAcAc and methanol mixtures were sprayed on to glass
substrates with dimension of 75 x 25 mm2
. During our experiments we had varied the precursor concentration to
0.05M and 0.1M by keeping substrate temperature and other deposition parameters as constant. In the spray
pyrolysis unit the substrate temperature was maintained with help of a heater and an electronic circuitry, which
contains a thermal sensor with relay switch. The precursor solution and career gas assembly connected to spray
gun was moved in the horizontal plane by means of pneumatic controlled system. The substrate to nozzle
distance was maintained at 25cm with 45o
angle. The films deposited on pre-cleaned glass plates were gradually
cooled to room temperature and then rinsed with deionized water and dried.The obtained TiO2 films were
annealed at 500o
C for 5 hours in stagnant air.](https://image.slidesharecdn.com/c0411015020-141218012830-conversion-gate01/85/Characteristic-comparison-of-TiO2-thin-films-with-an-inorganic-and-organic-precursor-at-different-molarities-by-Spray-pyrolysis-1-320.jpg)
![Characteristic comparison of TiO2 thin films…
16
The well-adherent TiO2 films underwent structural, optical studies. The structural studies were carried
out by using on Pan Analytic X’Part PRO Powder X-ray diffractometer (XRD) equipped with Cu-Kα
radiation (λ=1.5418Å). The optical absorption and photoluminescence spectra were recorded using UV-VIS-
Perkin Elmer’s LAMBDA35 spectrophotometer and Varian Carry ellipse photoluminescence spectrometer
respectively.
III. RESULTS AND DISCUSSION
3.1. Structural studies:
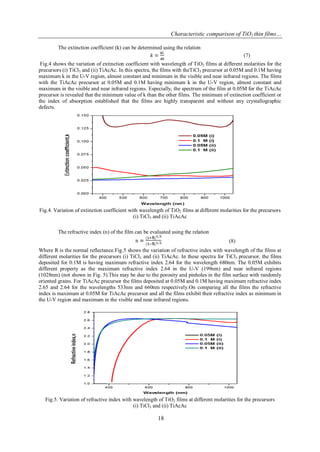
The XRD spectra of TiO2 films for the molarities 0.05M and 0.1M for the precursor (i) TiCl3 and
(ii) TiAcAc are as shown in Fig.1.The XRD spectra of TiO2 films deposited at various molar concentrations of
0.05M and 0.1M and heat-treated at 500o
C for 5 hours are shown in Fig.1. The plots show polycrystalline nature
with a noticeable (1 0 1) peak of TiO2 at 2θ = 25.28o
. This peak corresponds to the tetragonal crystal structure of
anatase phase with space group I41/amd. The observed ‘d’ value is in good agreement with the JCPDS Card No-
21-1272. [13]. The lattice constants a and c have been determined from inter planar spacing of different
(h k l) planes. The inter-planar distance between the lattice planes are consistent with the standard values and
the calculated unit cell parameters a=3.778 Å, c=9.681 Å are nearly equal to the standard values a=3.785 Å and
c=9.513Å.
In the spectra, for the precursor TiCl3 the film deposited at 0.05M, only the plane Anatase(101) is
present. While increasing molarity to 0.1M, the intensity of A(101) plane is increased along with some new
planes A(004) and A(200) are appeared due to increasing nucleation and growth of the films. For the precursor
TiAcAc the film deposited at 0.05M, along with intense A(101) plane a new plane A(211) is appeared with less
intensity. Further increasing of molarity to 0.1M, the intensity of A(101) plane is decreased. Among these films,
TiCl3 precursor 0.1M has A(101) plane with a very high intensity exhibiting the improved crystalline structure.
Fig.1.XRD Spectra of TiO2 films at different molarities for the precursors
(i) TiCl3 and (ii) TiAcAc
The grain size calculations are carried out from the Scherer-Bragg equation
(1)
The micro strain (Ɛ) is determined with the relation:
(2)
The dislocation density (δ) is calculated using the relation:
(3)
The inter planar spacing (d hkl) is calculated using the relation
(4)
The parameters of (101) plane, for different molarities is listed in Table.1. It shows that the 0.1M with
TiCl3 precursor has favorable structural parameters rather than other films.](https://image.slidesharecdn.com/c0411015020-141218012830-conversion-gate01/85/Characteristic-comparison-of-TiO2-thin-films-with-an-inorganic-and-organic-precursor-at-different-molarities-by-Spray-pyrolysis-2-320.jpg)
![Characteristic comparison of TiO2 thin films…
17
Table.1. microstructural parameters of anatase (101) plane of TiO2films deposited at different molarities for the
precursors (i) TiCl3 and (ii) TiAcAc
Molar Grain size, D Micro strain, Ɛ Dislocation density, δ Inter- planar
concentration (nm) x10-3
x1015
(m-2
) spacing (nm)
0.05M(i) 16.6 2.17 3.60 0.92
0.1 M (i) 20.7 1.74 2.31 1.12
0.05M(ii) 6.9 5.19 2.05 1.87
0.1 M (ii) 4.8 7.48 4.27 2.04
3.2. Optical properties of TiO2films
The optical transmittance spectra of TiO2 films at the molarities 0.05M and 0.1M for the precursors (i)
TiCl3 and (ii) TiAcAcare as shown in fig.2 for the wavelength range of 300 nm to 1000 nm. The percentage of
transmittance for all the films is minimum in UV region and maximum in the visible and near infra-red regions.
The increasing transmittance percentage is due to uniform oxidation and improved lattice arrangements [14].
From the transmittance spectra, the transmittance percentage of the film at 0.1M for the TiCl3precursor is
maximum than the film at 0.05M.For the TiAcAc precursor the transmittance percentage of the film deposited at
0.05M is maximum than the film at 0.1M.On comparing the precursors the transmittance percentage is
maximum at 0.05M with TiAcAc precursor.
Fig.2. Optical Transmission spectra of TiO2 films at different molarities for the precursors (i) TiCl3 and
(ii) TiAcAc
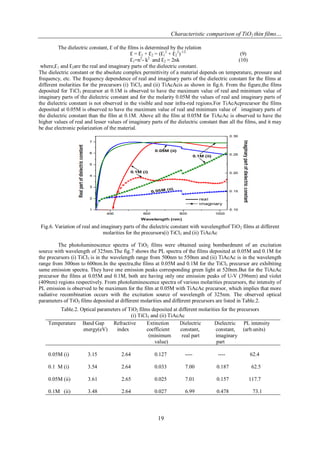
The optical band gap of deposited TiO2 films is evaluated from the relation between absorption
coefficient α and photon energy hν.
(αhν) = A (hν-Eg)x
(6)
Where A is a constant, Eg is the optical band gap and x=1/2 for directly allowed electronic transitions. The fig.3
shows the plot between (αhν)2
and hν of the deposited films at 0.05M and 0.1M for the precursors (i) TiCl3 and
(ii) TiAcAc.The extrapolation of linear portion of the curves on ɦν axis gives the direct band gap energy. The
spectra shows that the band gap energy of the films ranging from 3.1 eV to 3.6 eV. The increasing of band gap
energy is accredited to the carrier density due to Brustein-Moss effect [15]. The high value of band gap energy
for the film at 0.05M for the TiAcAc precursor is 3.6eV.
Fig.3 Optical band gap spectra of TiO2 films at different molarities for the precursors(i) TiCl3 and (ii) TiAcAc](https://image.slidesharecdn.com/c0411015020-141218012830-conversion-gate01/85/Characteristic-comparison-of-TiO2-thin-films-with-an-inorganic-and-organic-precursor-at-different-molarities-by-Spray-pyrolysis-3-320.jpg)
![Characteristic comparison of TiO2 thin films…
20
Fig.7. PL spectra of the TiO2 films at different molarities for the precursors (i) TiCl3 and (ii) TiAcAc
IV. CONCLUSIONS
The Titanium oxide (TiO2) films were deposited by spray pyrolysis technique using an inorganic
compound Titanium chloride(TiCl3) and an organic compound Titanylacetylacetonate(TiAcAc) as precursors.
The films were deposited at 0.05M and 0.1M for both the precursors and annealed at 500o
C for 5 hours in
stagnant air. On comparing the microstructural characteristics of the films at 0.05M and 0.1M for theTiCl3
precursor, the film deposited at 0.1M has (101) plane with very high intensity exhibited that the improved
crystalline structure, maximum of grain size and minimum of micro strain and dislocation density. On
comparing the films at 0.05M and 0.1M for theTiAcAc precursor, the film deposited at 0.05M has favorable
microstructural characteristics.In addition, on comparing these two,the film at 0.1M with TiCl3 precursor has
favorable microstructural characteristics than the other one. But the dislocation density is minimum for the film
at 0.05M with TiAcAc precursor than the 0.1M with TiCl3 precursor. The optical properties of semiconductors
mainly depends the structural disorder[16]. The film at 0.05M with TiAcAc precursor is having promising
optical properties such as high band gap energy as 3.6eV, high refractive index, low extinction coefficient and
high intense PL emission than the other films due to the minimum dislocation density. Furthermore the film
deposited for 0.05M for Titanyl acetylacetonate as precursor had appropriate characters, which make the
optimized deposition as the most suitable for gas sensing and optoelectronic applications.
REFERENCES
[1] S. K. Zheng, T. M. Wang, G. Xiang, C. Wang, 2001Vacuum j. 62: 361-366.
[2] M. Radecka, K. Zakrzewska, H. Czternastek, T. Stapinéski, S. Debrus, 1993Appl. Surf. Sci. j. 65: 227-234.
[3] D. Dumitriu, A. R. Bally, C. Ballif, P. Hones, P. E. Schmid, R. Sanjinés, F. Lévy, V. I.Pârvulescu, 2000Appl. Catal. B: Environ.
J. 25: 83-92.
[4] S. Takeda, S. Suzuki, H. Odaka, 2001Thin Solid Films j. 392: 338-344.
[5] F. Zhang, N. Huang, P. Yang1996Surf. Coat. Technol. J. 84: 476-479.
[6] A. Iwulska, G. Sliwinski, Photon. Lett. Poland 3 (2011) 98–100.
[7] E. Haimi, H. Lipsonen, J. Larismaa, M. Kapulainen, J. Krzak-Ros, S. P. Hannula, Thin Solid Films 519 (2011)
5882–5886.
[8] V.G.Bessergenev, I.V.Khmelinskii, R.J.F.Pereira, V.V.Krisuk, A.E. Turgambaeva, I.K. Igumenov, Vacuum 64 (2002)
275–279.
[9] U.M. Patil, K.V. Gurav, O. S. Joo, C.D. Lokhande, J. Alloys Compd. 478 (2009) 711–715.
[10] Q. Zhang, C. Sun, J. Yan, X. Hu, S. Zhou, P. Chen, Solid State Sci. 12 (2010) 1274–1277.
[11] U.M. Patil, S.B. Kulkarni, P.R. Deshmukh, R.R. Salunkhe, C.D. Lokhande, J. Alloys Compd. 509 (2011) 6196–199.
[12] N.C. Raut, T. Mathews, P. Chandramohan, M.P. Srinivasan, S. Dash, A.K. Tyagi, Mater. Res. Bull. 46 (2011) 2057–2063.
[13] R. Mechiakh, R. Bensaha, C. R. Phys. 7 (2006) 464–470.
[14] H. Hansel, H. Zettl, G. Kraush, R. Kisselev, M. Thelakat, H.W. Schmidt, Adv. Mater. 15 (2003) 2056–2060.
[15] K.L. Chopra, S.R. Das, Thin Film Solar Cells, Plenum Press, New York,1983.
[16] G. Paul, A. Choudhury, C. N. R. Rao, J. Chem. Soc. Dalton Trans. (2002) 3859-3867.](https://image.slidesharecdn.com/c0411015020-141218012830-conversion-gate01/85/Characteristic-comparison-of-TiO2-thin-films-with-an-inorganic-and-organic-precursor-at-different-molarities-by-Spray-pyrolysis-6-320.jpg)


![Inocuchi[3]](https://cdn.slidesharecdn.com/ss_thumbnails/inocuchi3-170131034102-thumbnail.jpg?width=640&height=640&fit=bounds)