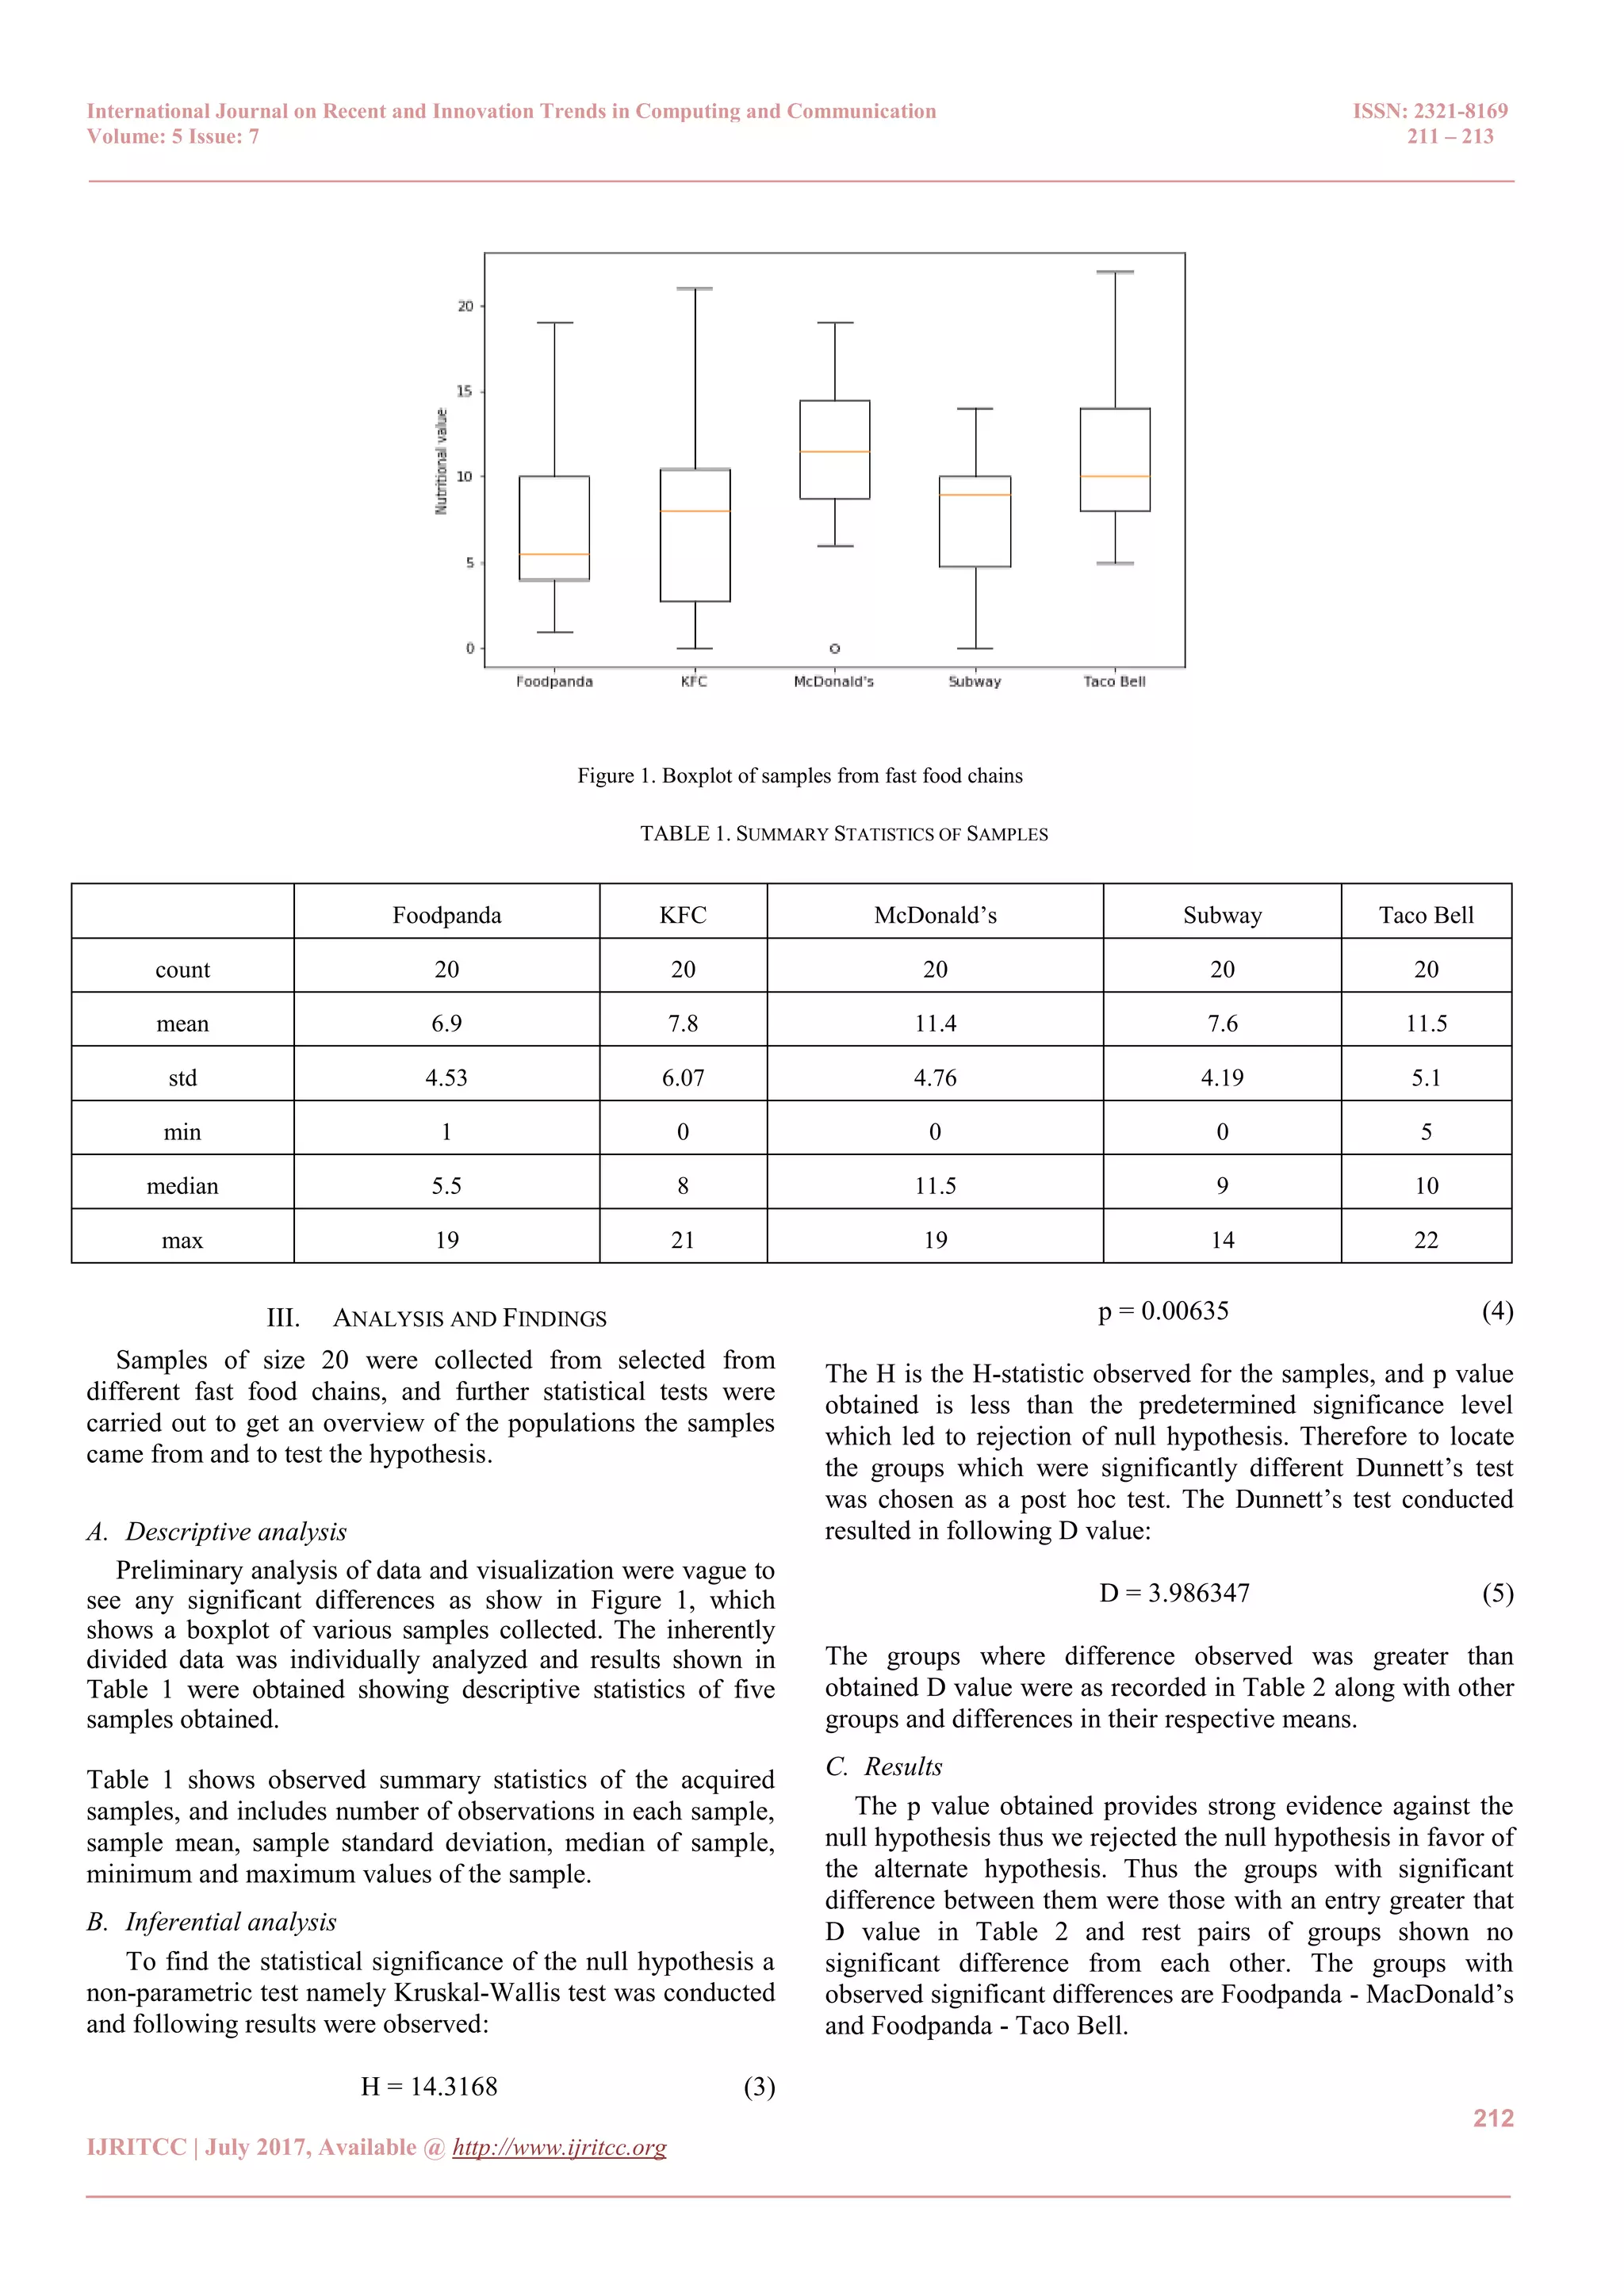
International Journal on Recent and Innovation Trends in Computing and Communication ISSN: 2321-8169
Volume: 5 Issue: 7 211 – 213
_______________________________________________________________________________________________
211
IJRITCC | July 2017, Available @ http://www.ijritcc.org
_______________________________________________________________________________________
Demystifying ‗Healthier‘ Fast Food: Comparative Analysis of Fast Food Chains
Ankush Arudkar
Department of Computer Science and Engineering
Rungta College of Engineering and Technology
Chhattisgarh, India
ankusharudkar1@gmail.com
Abstract— Fast food often referred as ―junk food‖ has now been a part of average human‘s diet for decades, especially trendy fast food chains
has seen a profit boost in recent years. Growing cravings for junk food and its increased consumption has made our world prone to various
health risks, degrading the quality of life of individuals. Despite of known detrimental health properties, many fast food chains were found
claiming their products to be ―healthier‖ alternatives. Since junk food is widely accepted without much concern of its negative impact [2], and
major fast food chains insisted about ―healthiness‖ of the food they serve, this study was conducted to find the statistical significance of claims
made by five currently dominating franchises, which let their product‘s nutritional information publically accessible and find weather there is a
significant difference between nutritional values between chosen fast food chains.
Keywords- Data analysis; fast food chains; health; junk food; statistical comparison.
__________________________________________________*****_________________________________________________
I. INTRODUCTION
Health is majorly responsible for determining the value and
worth of life. With increased urbanization and globalization
the world has seen many new factors severely affecting our
health. Some being prevalent such as UV rays exposure are
taken care of by suitable preventive measure, but some factors
which carries equal potent to degrade health are ignored such
as nutrition and exercise. Nutrition is a major aspect of our
lives which requires sound decisions when it comes to food
consumptions. Many fast food chains serve egregious food
items, which gets veiled by deliciousness and fancy named
food items. Fast food chains are a continuously expanding
business causing serious health impacts [2], [4], mitigating the
quality of life that one can achieve by avoiding them. WHO
(World Health Organization) is well known for spreading
awareness about good nutrition guidelines, suggests inhibiting
transfats from diet [1], which is found in most junk foods in
high amounts. This study took in account currently major fast
food chains namely McDonald‘s, Foodpanda, KFC, Subway
and Taco Bell. Items from menus of these restaurants were
compared to find any statically significant difference in
nutritional values of foods served. The study conducted
excluded any beverages, deserts, extra sauces, limited time
offers and extra toppings, keeping only food items served as
main dishes in context.
Foods served in most fast food restaurants are not even safe
for children as they exceed the limits of calories, saturated
fats, fat, and sodium [13], which leads to undernourishment of
the child‘s body. Therefore to compare which major fast food
chains have a difference in their nutritional values they were
put to a test to find any significant differences.
Nutrition is a complex metric varying significantly
according to region and so are the preferred fast food outlets
among different geographic regions [11] which caused this
study to undertake only some of the currently most popular
food chain restaurants. The so called ―Modern Diet‖ has lead to
some serious effects on human health [10] deteriorating the
quality of life.
II. RESEARCH DESIGN AND HYPOTHESES
The study was conducted by simple random sampling of 20
food items from menus of each of the five groups namely
McDonald‘s, Foodpanda, KFC, Subway and Taco Bell. Due to
extremely low micronutrients contents, macronutrients such as
protein, carbohydrates, saturated fats, fiber and harmful factors
namely sugar, cholesterol, transfats, and sodium were
considered according to the WHO recommendations [3], [8].
―Weight watchers‖ scale was used to rate a food item, where a
lower value indicates a better nutritional balance [9]. The null
(H0) and alternative (Ha) hypotheses considered were as
follows:
H0: 𝜇 𝑚 = 𝜇 𝑓 = 𝜇 𝑘 = 𝜇 𝑠 = 𝜇𝑡 (1)
Ha: 𝜇𝑖 ≠ 𝜇𝑗 , 𝑓𝑜𝑟 𝑎𝑛𝑦 𝑖 𝑎𝑛𝑑 𝑗 (2)
In (1) 𝜇 𝑚 , 𝜇 𝑓 , 𝜇 𝑘 , 𝜇 𝑠 , 𝜇𝑡 are mean nutritional values of
McDonald‘s, Foodpanda, KFC, Subway and Taco Bell
respectively. (2) is the alternate hypothesis which states that at
least two groups differ in their mean nutritional values. A
Krusal-Wallis test was conducted to compare the means of
different groups to find and significant difference, and as a
post hoc test Dunnett‘s test was chosen to determine different
groups within the samples from different populations. The
significance level selected for the test was chosen at α = 0.05.
International Journal on Recent and Innovation Trends in Computing and Communication ISSN: 2321-8169
Volume: 5 Issue: 7 211 – 213
_______________________________________________________________________________________________
212
IJRITCC | July 2017, Available @ http://www.ijritcc.org
_______________________________________________________________________________________
Figure 1. Boxplot of samples from fast food chains
TABLE 1. SUMMARY STATISTICS OF SAMPLES
III. ANALYSIS AND FINDINGS
Samples of size 20 were collected from selected from
different fast food chains, and further statistical tests were
carried out to get an overview of the populations the samples
came from and to test the hypothesis.
A. Descriptive analysis
Preliminary analysis of data and visualization were vague to
see any significant differences as show in Figure 1, which
shows a boxplot of various samples collected. The inherently
divided data was individually analyzed and results shown in
Table 1 were obtained showing descriptive statistics of five
samples obtained.
Table 1 shows observed summary statistics of the acquired
samples, and includes number of observations in each sample,
sample mean, sample standard deviation, median of sample,
minimum and maximum values of the sample.
B. Inferential analysis
To find the statistical significance of the null hypothesis a
non-parametric test namely Kruskal-Wallis test was conducted
and following results were observed:
H = 14.3168 (3)
p = 0.00635 (4)
The H is the H-statistic observed for the samples, and p value
obtained is less than the predetermined significance level
which led to rejection of null hypothesis. Therefore to locate
the groups which were significantly different Dunnett‘s test
was chosen as a post hoc test. The Dunnett‘s test conducted
resulted in following D value:
D = 3.986347 (5)
The groups where difference observed was greater than
obtained D value were as recorded in Table 2 along with other
groups and differences in their respective means.
C. Results
The p value obtained provides strong evidence against the
null hypothesis thus we rejected the null hypothesis in favor of
the alternate hypothesis. Thus the groups with significant
difference between them were those with an entry greater that
D value in Table 2 and rest pairs of groups shown no
significant difference from each other. The groups with
observed significant differences are Foodpanda - MacDonald‘s
and Foodpanda - Taco Bell.
Foodpanda KFC McDonald‘s Subway Taco Bell
count 20 20 20 20 20
mean 6.9 7.8 11.4 7.6 11.5
std 4.53 6.07 4.76 4.19 5.1
min 1 0 0 0 5
median 5.5 8 11.5 9 10
max 19 21 19 14 22
International Journal on Recent and Innovation Trends in Computing and Communication ISSN: 2321-8169
Volume: 5 Issue: 7 211 – 213
_______________________________________________________________________________________________
213
IJRITCC | July 2017, Available @ http://www.ijritcc.org
_______________________________________________________________________________________
IV. CONCLUSION
In this paper we statistically tested five major food chain
restaurants according to nutritional values of their served
foods. We found significant differences in some groups and
shown a comparative study amongst them to better understand
relative nutritional differences. This paper shown some
restaurants had better nutritional value than other with enough
statistical significance, but this evidence in no way proves that
food served in those groups is indeed an ideal diet. WHO
provides legitimate guidelines for intake of various essential
food components [7] for sustaining a better healthy lifestyle.
Comparative studies conducted between non-fast food
restaurants and fast food restaurants [14] shown significant
differences in their macronutrient contents.
In future we plan to take in account every nutritional aspect of
the food items, taking under consideration both macro and
micro-nutrients and find their relative nutritional imbalance
compared to standardized nutrition values recommended for
average human, and acknowledging the excess proportions of
harmful contents above recommended safe levels.
TABLE.2 DIFFERENCES OF MEANS BETWEEN GROUPS
Foodpanda KFC McDonald‘s Subway Taco
Bell
Foodpanda 0 0.9 4.5 0.7 4.6
KFC -0.9 0 3.6 -0.2 3.7
McDonald‘s -4.5 -3.6 0 -3.8 0.1
Subway -0.7 0.2 3.8 0 3.9
Taco Bell -4.6 -3.7 -0.1 -3.9 0
ACKNOWLEDGMENT
I would like to sincerely thank Meenakshi R Patel for
her guidance and support for successful completion of the
project, her constant encouragement helped this study to reach
its goals.
REFERENCES
[1] BA Swinburn, I Caterson , JC Seidell and WPT James, ―Diet,
nutrition and the prevention of excess weight gain and obesity‖,
Public Health Nutrition: 7(1A), 123–146.
[2] Ashakiran & Deepthi R, ―Fast Foods and their Impact on
Health‖, JKIMSU, Vol. 1, No. 2, July-Dec. 2012.
[3] R. Passmore, B.M. Nicol, M. Narayana Rao, G.H. Beaton, E.M.
Demayer , ―HANDBOOK ON HUMAN NUTRITIONAL
REQUIREMENTS‖, World Health Organization Monograph
Series No. 61.
[4] WHO. Guideline: Sodium intake for adults and children.
Geneva, World Health Organization (WHO), 2012.
[5] Guideline: Sugars intake for adults and children. Geneva: World
Health Organization; 2015.
[6] ―Fats and fatty acids in human nutrition‖, Report of an export
consultation, Food and nutrition paper 91, 10-14 December,
ISBN 978-92-5-106733-8.
[7] http://www.who.int/elena/healthy_diet_fact_sheet_394.pdf?ua=1
[8] https://www.ucsfhealth.org/education/increasing_fiber_intake/
[9] https://en.wikipedia.org/wiki/Weight_Watchers
[10] Shridhar G, Rajendra N, Murigendra H, Shridevi P, Prasad M, et
al. (2015) Modern Diet and its Impact on Human Health. J Nutr
Food Sci 5: 1000430. doi:10.4172/2155-9600.1000430
[11] Ali Kara, Pennsylvania State University at York Erdener
Kaynak, Pennsylvania State University at Harrisburg Orsay
Kucukemiroglu, Pennsylvania State University at York,
―CONSUMER PREFERENCES OF FAST -FOOD OUTLETS
IN THE U.S. AND CANADA: A COMPARATIVE STUDY‖
[12] ―Consumers‘ estimation of calorie content at fast food
restaurants: cross sectional observational study‖,
BMJ 2013; 346 doi:
https://doi.org/10.1136/bmj.f2907 (Published 23 May
2013), BMJ 2013;346:f2907
[13] Andrea L. Deierlein, Kay Peat, and Luz Claudio, ―Comparison
of the nutrient content of children‘s menu items at US restaurant
chains, 2010–2014‖
[14] Serrano EL, Jedda VB. , ―Comparison of fast-food and non-fast-
food children's menu items‖, DOI: 10.1016/j.jneb.2008.02.005

Demystifying ‘Healthier’ Fast Food: Comparative Analysis of Fast Food Chains

  • 1.
    International Journal onRecent and Innovation Trends in Computing and Communication ISSN: 2321-8169 Volume: 5 Issue: 7 211 – 213 _______________________________________________________________________________________________ 211 IJRITCC | July 2017, Available @ http://www.ijritcc.org _______________________________________________________________________________________ Demystifying ‗Healthier‘ Fast Food: Comparative Analysis of Fast Food Chains Ankush Arudkar Department of Computer Science and Engineering Rungta College of Engineering and Technology Chhattisgarh, India ankusharudkar1@gmail.com Abstract— Fast food often referred as ―junk food‖ has now been a part of average human‘s diet for decades, especially trendy fast food chains has seen a profit boost in recent years. Growing cravings for junk food and its increased consumption has made our world prone to various health risks, degrading the quality of life of individuals. Despite of known detrimental health properties, many fast food chains were found claiming their products to be ―healthier‖ alternatives. Since junk food is widely accepted without much concern of its negative impact [2], and major fast food chains insisted about ―healthiness‖ of the food they serve, this study was conducted to find the statistical significance of claims made by five currently dominating franchises, which let their product‘s nutritional information publically accessible and find weather there is a significant difference between nutritional values between chosen fast food chains. Keywords- Data analysis; fast food chains; health; junk food; statistical comparison. __________________________________________________*****_________________________________________________ I. INTRODUCTION Health is majorly responsible for determining the value and worth of life. With increased urbanization and globalization the world has seen many new factors severely affecting our health. Some being prevalent such as UV rays exposure are taken care of by suitable preventive measure, but some factors which carries equal potent to degrade health are ignored such as nutrition and exercise. Nutrition is a major aspect of our lives which requires sound decisions when it comes to food consumptions. Many fast food chains serve egregious food items, which gets veiled by deliciousness and fancy named food items. Fast food chains are a continuously expanding business causing serious health impacts [2], [4], mitigating the quality of life that one can achieve by avoiding them. WHO (World Health Organization) is well known for spreading awareness about good nutrition guidelines, suggests inhibiting transfats from diet [1], which is found in most junk foods in high amounts. This study took in account currently major fast food chains namely McDonald‘s, Foodpanda, KFC, Subway and Taco Bell. Items from menus of these restaurants were compared to find any statically significant difference in nutritional values of foods served. The study conducted excluded any beverages, deserts, extra sauces, limited time offers and extra toppings, keeping only food items served as main dishes in context. Foods served in most fast food restaurants are not even safe for children as they exceed the limits of calories, saturated fats, fat, and sodium [13], which leads to undernourishment of the child‘s body. Therefore to compare which major fast food chains have a difference in their nutritional values they were put to a test to find any significant differences. Nutrition is a complex metric varying significantly according to region and so are the preferred fast food outlets among different geographic regions [11] which caused this study to undertake only some of the currently most popular food chain restaurants. The so called ―Modern Diet‖ has lead to some serious effects on human health [10] deteriorating the quality of life. II. RESEARCH DESIGN AND HYPOTHESES The study was conducted by simple random sampling of 20 food items from menus of each of the five groups namely McDonald‘s, Foodpanda, KFC, Subway and Taco Bell. Due to extremely low micronutrients contents, macronutrients such as protein, carbohydrates, saturated fats, fiber and harmful factors namely sugar, cholesterol, transfats, and sodium were considered according to the WHO recommendations [3], [8]. ―Weight watchers‖ scale was used to rate a food item, where a lower value indicates a better nutritional balance [9]. The null (H0) and alternative (Ha) hypotheses considered were as follows: H0: 𝜇 𝑚 = 𝜇 𝑓 = 𝜇 𝑘 = 𝜇 𝑠 = 𝜇𝑡 (1) Ha: 𝜇𝑖 ≠ 𝜇𝑗 , 𝑓𝑜𝑟 𝑎𝑛𝑦 𝑖 𝑎𝑛𝑑 𝑗 (2) In (1) 𝜇 𝑚 , 𝜇 𝑓 , 𝜇 𝑘 , 𝜇 𝑠 , 𝜇𝑡 are mean nutritional values of McDonald‘s, Foodpanda, KFC, Subway and Taco Bell respectively. (2) is the alternate hypothesis which states that at least two groups differ in their mean nutritional values. A Krusal-Wallis test was conducted to compare the means of different groups to find and significant difference, and as a post hoc test Dunnett‘s test was chosen to determine different groups within the samples from different populations. The significance level selected for the test was chosen at α = 0.05.
  • 2.
    International Journal onRecent and Innovation Trends in Computing and Communication ISSN: 2321-8169 Volume: 5 Issue: 7 211 – 213 _______________________________________________________________________________________________ 212 IJRITCC | July 2017, Available @ http://www.ijritcc.org _______________________________________________________________________________________ Figure 1. Boxplot of samples from fast food chains TABLE 1. SUMMARY STATISTICS OF SAMPLES III. ANALYSIS AND FINDINGS Samples of size 20 were collected from selected from different fast food chains, and further statistical tests were carried out to get an overview of the populations the samples came from and to test the hypothesis. A. Descriptive analysis Preliminary analysis of data and visualization were vague to see any significant differences as show in Figure 1, which shows a boxplot of various samples collected. The inherently divided data was individually analyzed and results shown in Table 1 were obtained showing descriptive statistics of five samples obtained. Table 1 shows observed summary statistics of the acquired samples, and includes number of observations in each sample, sample mean, sample standard deviation, median of sample, minimum and maximum values of the sample. B. Inferential analysis To find the statistical significance of the null hypothesis a non-parametric test namely Kruskal-Wallis test was conducted and following results were observed: H = 14.3168 (3) p = 0.00635 (4) The H is the H-statistic observed for the samples, and p value obtained is less than the predetermined significance level which led to rejection of null hypothesis. Therefore to locate the groups which were significantly different Dunnett‘s test was chosen as a post hoc test. The Dunnett‘s test conducted resulted in following D value: D = 3.986347 (5) The groups where difference observed was greater than obtained D value were as recorded in Table 2 along with other groups and differences in their respective means. C. Results The p value obtained provides strong evidence against the null hypothesis thus we rejected the null hypothesis in favor of the alternate hypothesis. Thus the groups with significant difference between them were those with an entry greater that D value in Table 2 and rest pairs of groups shown no significant difference from each other. The groups with observed significant differences are Foodpanda - MacDonald‘s and Foodpanda - Taco Bell. Foodpanda KFC McDonald‘s Subway Taco Bell count 20 20 20 20 20 mean 6.9 7.8 11.4 7.6 11.5 std 4.53 6.07 4.76 4.19 5.1 min 1 0 0 0 5 median 5.5 8 11.5 9 10 max 19 21 19 14 22
  • 3.
    International Journal onRecent and Innovation Trends in Computing and Communication ISSN: 2321-8169 Volume: 5 Issue: 7 211 – 213 _______________________________________________________________________________________________ 213 IJRITCC | July 2017, Available @ http://www.ijritcc.org _______________________________________________________________________________________ IV. CONCLUSION In this paper we statistically tested five major food chain restaurants according to nutritional values of their served foods. We found significant differences in some groups and shown a comparative study amongst them to better understand relative nutritional differences. This paper shown some restaurants had better nutritional value than other with enough statistical significance, but this evidence in no way proves that food served in those groups is indeed an ideal diet. WHO provides legitimate guidelines for intake of various essential food components [7] for sustaining a better healthy lifestyle. Comparative studies conducted between non-fast food restaurants and fast food restaurants [14] shown significant differences in their macronutrient contents. In future we plan to take in account every nutritional aspect of the food items, taking under consideration both macro and micro-nutrients and find their relative nutritional imbalance compared to standardized nutrition values recommended for average human, and acknowledging the excess proportions of harmful contents above recommended safe levels. TABLE.2 DIFFERENCES OF MEANS BETWEEN GROUPS Foodpanda KFC McDonald‘s Subway Taco Bell Foodpanda 0 0.9 4.5 0.7 4.6 KFC -0.9 0 3.6 -0.2 3.7 McDonald‘s -4.5 -3.6 0 -3.8 0.1 Subway -0.7 0.2 3.8 0 3.9 Taco Bell -4.6 -3.7 -0.1 -3.9 0 ACKNOWLEDGMENT I would like to sincerely thank Meenakshi R Patel for her guidance and support for successful completion of the project, her constant encouragement helped this study to reach its goals. REFERENCES [1] BA Swinburn, I Caterson , JC Seidell and WPT James, ―Diet, nutrition and the prevention of excess weight gain and obesity‖, Public Health Nutrition: 7(1A), 123–146. [2] Ashakiran & Deepthi R, ―Fast Foods and their Impact on Health‖, JKIMSU, Vol. 1, No. 2, July-Dec. 2012. [3] R. Passmore, B.M. Nicol, M. Narayana Rao, G.H. Beaton, E.M. Demayer , ―HANDBOOK ON HUMAN NUTRITIONAL REQUIREMENTS‖, World Health Organization Monograph Series No. 61. [4] WHO. Guideline: Sodium intake for adults and children. Geneva, World Health Organization (WHO), 2012. [5] Guideline: Sugars intake for adults and children. Geneva: World Health Organization; 2015. [6] ―Fats and fatty acids in human nutrition‖, Report of an export consultation, Food and nutrition paper 91, 10-14 December, ISBN 978-92-5-106733-8. [7] http://www.who.int/elena/healthy_diet_fact_sheet_394.pdf?ua=1 [8] https://www.ucsfhealth.org/education/increasing_fiber_intake/ [9] https://en.wikipedia.org/wiki/Weight_Watchers [10] Shridhar G, Rajendra N, Murigendra H, Shridevi P, Prasad M, et al. (2015) Modern Diet and its Impact on Human Health. J Nutr Food Sci 5: 1000430. doi:10.4172/2155-9600.1000430 [11] Ali Kara, Pennsylvania State University at York Erdener Kaynak, Pennsylvania State University at Harrisburg Orsay Kucukemiroglu, Pennsylvania State University at York, ―CONSUMER PREFERENCES OF FAST -FOOD OUTLETS IN THE U.S. AND CANADA: A COMPARATIVE STUDY‖ [12] ―Consumers‘ estimation of calorie content at fast food restaurants: cross sectional observational study‖, BMJ 2013; 346 doi: https://doi.org/10.1136/bmj.f2907 (Published 23 May 2013), BMJ 2013;346:f2907 [13] Andrea L. Deierlein, Kay Peat, and Luz Claudio, ―Comparison of the nutrient content of children‘s menu items at US restaurant chains, 2010–2014‖ [14] Serrano EL, Jedda VB. , ―Comparison of fast-food and non-fast- food children's menu items‖, DOI: 10.1016/j.jneb.2008.02.005