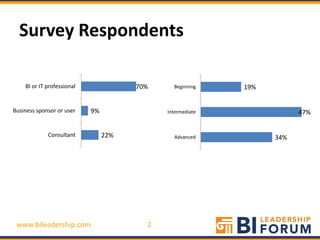
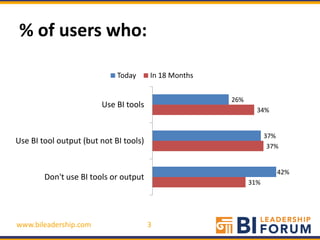
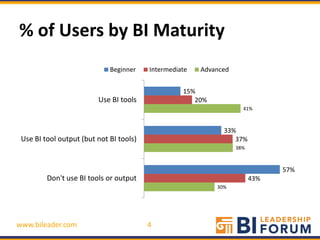
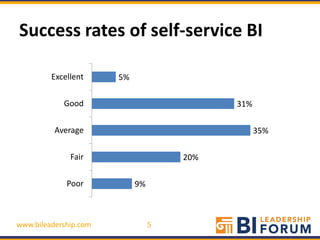
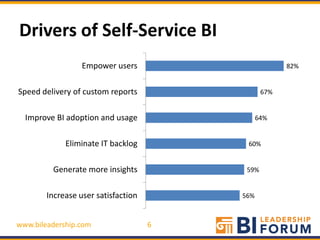
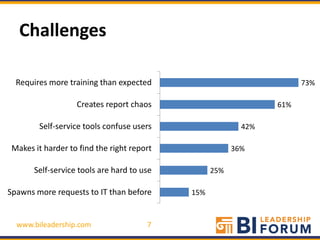
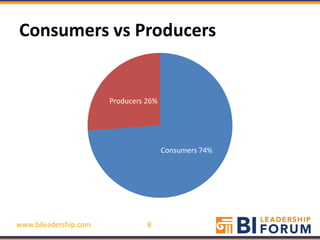
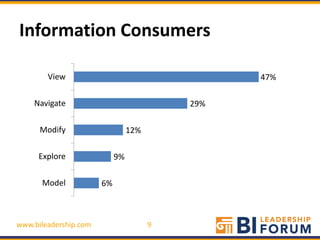
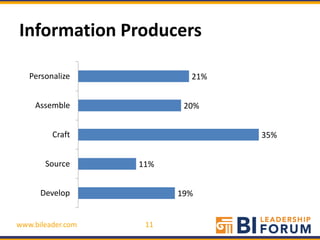
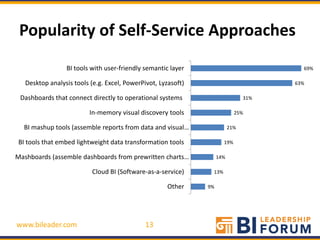
Business-Driven BI
     -Survey Results-
        Wayne Eckerson
 Founder, BI Leadership Forum
Director of Research, TechTarget
Survey Respondents

    BI or IT professional              70%     Beginning    19%


Business sponsor or user    9%               Intermediate               47%


             Consultant          22%           Advanced           34%


 www.bileadership.com                    2
% of users who:

                             Today      In 18 Months


                                                       26%
                        Use BI tools
                                                               34%


                                                                   37%
Use BI tool output (but not BI tools)
                                                                    37%


                                                                      42%
        Don't use BI tools or output
                                                             31%


www.bileadership.com                    3
% of Users by BI Maturity
                             Beginner    Intermediate   Advanced


                                                   15%
                         Use BI tools                 20%
                                                                     41%


                                                              33%
 Use BI tool output (but not BI tools)                           37%
                                                                   38%


                                                                               57%
         Don't use BI tools or output                                    43%
                                                            30%


www.bileader.com                         4
Success rates of self-service BI

         Excellent     5%

            Good                           31%

          Average                                35%

              Fair                   20%

             Poor           9%


www.bileadership.com             5
Drivers of Self-Service BI
                  Empower users                       82%


Speed delivery of custom reports                67%


  Improve BI adoption and usage                64%


             Eliminate IT backlog         60%


         Generate more insights           59%


        Increase user satisfaction       56%


www.bileadership.com                 6
Challenges

  Requires more training than expected                                73%

                   Creates report chaos                         61%

        Self-service tools confuse users                  42%

 Makes it harder to find the right report               36%

       Self-service tools are hard to use         25%

Spawns more requests to IT than before      15%


  www.bileadership.com                 7
Consumers vs Producers


                       Producers 26%


                                       Consumers 74%


www.bileadership.com             8
Information Consumers

        View                                     47%

    Navigate                               29%

      Modify                     12%

     Explore                9%

      Model            6%


www.bileadership.com                   9
Consumers by BI Maturity
                   Beginner         Intermediate   Advanced

                                                                    54%
        View                                                  50%
                                                       37%
                                         21%
    Navigate                                   29%
                                                 31%
                             11%
      Modify                 11%
                                   15%
                             11%
      Explore           8%
                             11%
                        8%
       Model       4%
                        8%

www.bileader.com                    10
Information Producers

   Personalize             21%


    Assemble              20%


         Craft                   35%


       Source      11%


      Develop            19%


www.bileader.com    11
Producers by BI Maturity
                   Beginner   Intermediate    Advanced


                                                21%
   Personalize                                    23%
                                              19%
                                               20%
    Assemble                                 18%
                                                     23%
                                                             35%
         Craft                                                 37%
                                                           33%
                         11%
       Source          10%
                            14%
                                        19%
     Develop                          17%
                                      17%

www.bileader.com               12
Popularity of Self-Service Approaches
                 BI tools with user-friendly semantic layer                             69%

   Desktop analysis tools (e.g. Excel, PowerPivot, Lyzasoft)                          63%

 Dashboards that connect directly to operational systems                        31%

                          In-memory visual discovery tools                  25%

  BI mashup tools (assemble reports from data and visual…                 21%

 BI tools that embed lightweight data transformation tools            19%

Mashboards (assemble dashboards from prewritten charts…             14%

                           Cloud BI (Software-as-a-service)     13%

                                                      Other    9%


www.bileader.com                              13
BI Tools by BI Maturity
                                       Beginner        Intermediate       Advanced

                                                                                          50%
                 BI tools with user-friendly semantic layer                                                  80%
                                                                                                 61%
                                                                                           53%
   Desktop analysis tools (e.g. Excel, PowerPivot, Lyzasoft)                                           68%
                                                                                                 61%
                                                                            22%
 Dashboards that connect directly to operational systems                           32%
                                                                                    34%
                                                                          19%
                          In-memory visual discovery tools                  22%
                                                                                    34%
  BI mashup tools (assemble reports from data and visual                     22%
                                                                            21%
                       components)                                         20%
                                                                        16%
BI tools that embed lightweight data transformation tools                 19%
                                                                            21%
Mashboards (assemble dashboards from prewritten charts                     19%
                                                                      11%
                     and tables)                                         16%
                                                                        16%
                          Cloud BI (Software-as-a-service)       8%
                                                                          20%
                                                                  9%
                                                     Other       8%
                                                                   11%

  www.bileader.com                                    14
Webcast
• See TechTarget Webcast by Wayne
  Eckerson that explains this data.


www.bileader.com   15

Business driven BI - Self-service Techniques

  • 1.
    Business-Driven BI -Survey Results- Wayne Eckerson Founder, BI Leadership Forum Director of Research, TechTarget
  • 2.
    Survey Respondents BI or IT professional 70% Beginning 19% Business sponsor or user 9% Intermediate 47% Consultant 22% Advanced 34% www.bileadership.com 2
  • 3.
    % of userswho: Today In 18 Months 26% Use BI tools 34% 37% Use BI tool output (but not BI tools) 37% 42% Don't use BI tools or output 31% www.bileadership.com 3
  • 4.
    % of Usersby BI Maturity Beginner Intermediate Advanced 15% Use BI tools 20% 41% 33% Use BI tool output (but not BI tools) 37% 38% 57% Don't use BI tools or output 43% 30% www.bileader.com 4
  • 5.
    Success rates ofself-service BI Excellent 5% Good 31% Average 35% Fair 20% Poor 9% www.bileadership.com 5
  • 6.
    Drivers of Self-ServiceBI Empower users 82% Speed delivery of custom reports 67% Improve BI adoption and usage 64% Eliminate IT backlog 60% Generate more insights 59% Increase user satisfaction 56% www.bileadership.com 6
  • 7.
    Challenges Requiresmore training than expected 73% Creates report chaos 61% Self-service tools confuse users 42% Makes it harder to find the right report 36% Self-service tools are hard to use 25% Spawns more requests to IT than before 15% www.bileadership.com 7
  • 8.
    Consumers vs Producers Producers 26% Consumers 74% www.bileadership.com 8
  • 9.
    Information Consumers View 47% Navigate 29% Modify 12% Explore 9% Model 6% www.bileadership.com 9
  • 10.
    Consumers by BIMaturity Beginner Intermediate Advanced 54% View 50% 37% 21% Navigate 29% 31% 11% Modify 11% 15% 11% Explore 8% 11% 8% Model 4% 8% www.bileader.com 10
  • 11.
    Information Producers Personalize 21% Assemble 20% Craft 35% Source 11% Develop 19% www.bileader.com 11
  • 12.
    Producers by BIMaturity Beginner Intermediate Advanced 21% Personalize 23% 19% 20% Assemble 18% 23% 35% Craft 37% 33% 11% Source 10% 14% 19% Develop 17% 17% www.bileader.com 12
  • 13.
    Popularity of Self-ServiceApproaches BI tools with user-friendly semantic layer 69% Desktop analysis tools (e.g. Excel, PowerPivot, Lyzasoft) 63% Dashboards that connect directly to operational systems 31% In-memory visual discovery tools 25% BI mashup tools (assemble reports from data and visual… 21% BI tools that embed lightweight data transformation tools 19% Mashboards (assemble dashboards from prewritten charts… 14% Cloud BI (Software-as-a-service) 13% Other 9% www.bileader.com 13
  • 14.
    BI Tools byBI Maturity Beginner Intermediate Advanced 50% BI tools with user-friendly semantic layer 80% 61% 53% Desktop analysis tools (e.g. Excel, PowerPivot, Lyzasoft) 68% 61% 22% Dashboards that connect directly to operational systems 32% 34% 19% In-memory visual discovery tools 22% 34% BI mashup tools (assemble reports from data and visual 22% 21% components) 20% 16% BI tools that embed lightweight data transformation tools 19% 21% Mashboards (assemble dashboards from prewritten charts 19% 11% and tables) 16% 16% Cloud BI (Software-as-a-service) 8% 20% 9% Other 8% 11% www.bileader.com 14
  • 15.
    Webcast • See TechTargetWebcast by Wayne Eckerson that explains this data. www.bileader.com 15