Even if you already know what a SWOT analysis is and what it’s used for, it can be tough to translate that information into something you can action.
It can also be hard to examine your own business with a critical eye if you’re not entirely sure what you should be examining.
Reading an example SWOT analysis for a business that is either in your industry or based on a comparable business model can help get you started.
All of our SWOT analysis examples are based on real businesses that we’ve featured in our gallery of free sample business plans on bplans.com
The following 6 examples are
broken into three parts:
1. A quick introduction to the company.
2. The company’s SWOT analysis.
3. Some potential growth strategies for the company based on what’s revealed by the SWOT analysis.
Communications Excellence: Tactics Used by BioPharma Execs to Increase Organi...Best Practices
This report will help organizations to improve their efficiency and effectiveness through the creation of internal and external communication processes. It also provides key insights like effective channels for internal and external communication, as well as preferred medium for communications frequently used by executives and others.
A look at how the GeoWeb Community is embracing the world of Web 2.0 and social media. Ideas on how to grow and develop the community in the future. Presented at the 2009 ESRI Developer Summit in Palm Springs, CA
EDN Team
Wondering how vertical networks like Spiceworks change how IT pros research and buy technology? Get the inside scoop on:
- The latest Forrester research on social IT purchasing trends
- How real IT pros use social networks to make buying decisions
- Social marketing success stories from marketers like you
Social learning for IBM people managers using communityKhalid Raza
Delivered this presentation to IBM India Learning fraternity in the India Learning ShareNet 2012 on 19th Nov at Bangalore, India and won the first prize. In my view it is the acceptance and appreciation of social learning in many ways by the learning community. Thanks to all involved in making the IBM Manager Community (within the firewall) a great place for IBM People Managers. — at Matthan Hotel Bangaluru.
FrameMaker 11: What’s new in FM11 & FM11 Publishing Server (Lavacon2012)Maxwell Hoffmann
Lavacon 2012: see what's new in FrameMaker 11 and FrameMaker 11 Publishing Server. This presentation by Adobe Sr. Product Manager, Kapil Verma (@kapilAdobe) covers the many areas of feature and product improvement in FrameMaker 11. DITA and XML authoring has been made even simpler and more transparent than before. Major improvements like XPath, XQuery, XML Code view and "intelliprompt" for elements and attributes are most welcomed. Even is you are still doing "unstructured" authoring, the ability to generate a hyperlinked parts table from 3D diagrams, in place insertion of styles, improved FIND/CHANGE and more control over customizing your user interface are a huge help. Also find out how tooutput to multiview HTML5 to publish to tablets and mobile devices.
Learn about the organizational and architectural strategies needed to make self-service analytics successful. Self-service is more about process and training instead of only focusing on tools.
Download this research to read about self-service architecture in detail:https://www.eckerson.com/articles/a-reference-architecture-for-self-service-analytics
If you need help with self-service analytics, data architecture or data management, contact us on the following link: https://www.eckerson.com/consulting
Managing Data Sprawl with Data Catalogs for Self-ServiceEckerson Group
Self-service analytics tools solved one problem but created another. Now we need data catalogs and self-service data.
When you're done reading the slides, you can download our research: The Ultimate Guide to Data Catalogs https://www.eckerson.com/articles/the-ultimate-guide-to-data-catalogs-key-things-to-consider-when-selecting-a-data-catalog
We also help you choose a data catalog and teach you how to implement it across your enterprise. Contact us-https://www.eckerson.com/consulting
Effective tips for leaders in the #BI and #Analytics space who want to become better leaders.
Visit www.eckerson.com to know more about our research, education and consulting services.
In this webcast, Wayne Eckerson discusses the impact of artificial intelligence (AI) and machine (ML) learning on the finance industry, specifically how AI/ML will lead to augmented intelligence, in which man and machine collaborate to deliver optimal outcomes and decisions.
Watch the webinar on this link: https://www.youtube.com/watch?time_continue=506&v=UwBEd_m0XBs
TDWI Boston Keynote: The New BI/Analytics Synergy Eckerson Group
To stay relevant in a fast-changing business and data environment, business and analytics leaders need to recognize that their teams are no longer the center of the data universe. They need to reach out and partner with other data analytics players in the organization and create a shared vision for the future. The new business analytics leader fosters a rich analytical ecosystem of people, processes and technologies that fuels a data-driven organization.
You Will Learn:
- How the data world has changed and why
- The cyclical nature of power in the data world
- Characteristics of the new analytical ecosystem
- The role of BI leaders and teams in the new world order
TDWI Boston Keynote - The New BI/Analytics Synergy - 7 30-2015 - tdwi keynoteEckerson Group
To stay relevant in a fast-changing business and data environment, business and analytics leaders need to recognize that their teams are no longer the center of the data universe. They need to reach out and partner with other data analytics players in the organization and create a shared vision for the future. The new business analytics leader fosters a rich analytical ecosystem of people, processes and technologies that fuels a data-driven organization.
You Will Learn:
- How the data world has changed and why
- The cyclical nature of power in the data world
- Characteristics of the new analytical ecosystem
- The role of BI leaders and teams in the new world order
Securing your Kubernetes cluster_ a step-by-step guide to success !KatiaHIMEUR1
Today, after several years of existence, an extremely active community and an ultra-dynamic ecosystem, Kubernetes has established itself as the de facto standard in container orchestration. Thanks to a wide range of managed services, it has never been so easy to set up a ready-to-use Kubernetes cluster.
However, this ease of use means that the subject of security in Kubernetes is often left for later, or even neglected. This exposes companies to significant risks.
In this talk, I'll show you step-by-step how to secure your Kubernetes cluster for greater peace of mind and reliability.
Generating a custom Ruby SDK for your web service or Rails API using Smithyg2nightmarescribd
Have you ever wanted a Ruby client API to communicate with your web service? Smithy is a protocol-agnostic language for defining services and SDKs. Smithy Ruby is an implementation of Smithy that generates a Ruby SDK using a Smithy model. In this talk, we will explore Smithy and Smithy Ruby to learn how to generate custom feature-rich SDKs that can communicate with any web service, such as a Rails JSON API.
GraphRAG is All You need? LLM & Knowledge GraphGuy Korland
Guy Korland, CEO and Co-founder of FalkorDB, will review two articles on the integration of language models with knowledge graphs.
1. Unifying Large Language Models and Knowledge Graphs: A Roadmap.
https://arxiv.org/abs/2306.08302
2. Microsoft Research's GraphRAG paper and a review paper on various uses of knowledge graphs:
https://www.microsoft.com/en-us/research/blog/graphrag-unlocking-llm-discovery-on-narrative-private-data/
Connector Corner: Automate dynamic content and events by pushing a buttonDianaGray10
Here is something new! In our next Connector Corner webinar, we will demonstrate how you can use a single workflow to:
Create a campaign using Mailchimp with merge tags/fields
Send an interactive Slack channel message (using buttons)
Have the message received by managers and peers along with a test email for review
But there’s more:
In a second workflow supporting the same use case, you’ll see:
Your campaign sent to target colleagues for approval
If the “Approve” button is clicked, a Jira/Zendesk ticket is created for the marketing design team
But—if the “Reject” button is pushed, colleagues will be alerted via Slack message
Join us to learn more about this new, human-in-the-loop capability, brought to you by Integration Service connectors.
And...
Speakers:
Akshay Agnihotri, Product Manager
Charlie Greenberg, Host
LF Energy Webinar: Electrical Grid Modelling and Simulation Through PowSyBl -...DanBrown980551
Do you want to learn how to model and simulate an electrical network from scratch in under an hour?
Then welcome to this PowSyBl workshop, hosted by Rte, the French Transmission System Operator (TSO)!
During the webinar, you will discover the PowSyBl ecosystem as well as handle and study an electrical network through an interactive Python notebook.
PowSyBl is an open source project hosted by LF Energy, which offers a comprehensive set of features for electrical grid modelling and simulation. Among other advanced features, PowSyBl provides:
- A fully editable and extendable library for grid component modelling;
- Visualization tools to display your network;
- Grid simulation tools, such as power flows, security analyses (with or without remedial actions) and sensitivity analyses;
The framework is mostly written in Java, with a Python binding so that Python developers can access PowSyBl functionalities as well.
What you will learn during the webinar:
- For beginners: discover PowSyBl's functionalities through a quick general presentation and the notebook, without needing any expert coding skills;
- For advanced developers: master the skills to efficiently apply PowSyBl functionalities to your real-world scenarios.
Elevating Tactical DDD Patterns Through Object CalisthenicsDorra BARTAGUIZ
After immersing yourself in the blue book and its red counterpart, attending DDD-focused conferences, and applying tactical patterns, you're left with a crucial question: How do I ensure my design is effective? Tactical patterns within Domain-Driven Design (DDD) serve as guiding principles for creating clear and manageable domain models. However, achieving success with these patterns requires additional guidance. Interestingly, we've observed that a set of constraints initially designed for training purposes remarkably aligns with effective pattern implementation, offering a more ‘mechanical’ approach. Let's explore together how Object Calisthenics can elevate the design of your tactical DDD patterns, offering concrete help for those venturing into DDD for the first time!
State of ICS and IoT Cyber Threat Landscape Report 2024 previewPrayukth K V
The IoT and OT threat landscape report has been prepared by the Threat Research Team at Sectrio using data from Sectrio, cyber threat intelligence farming facilities spread across over 85 cities around the world. In addition, Sectrio also runs AI-based advanced threat and payload engagement facilities that serve as sinks to attract and engage sophisticated threat actors, and newer malware including new variants and latent threats that are at an earlier stage of development.
The latest edition of the OT/ICS and IoT security Threat Landscape Report 2024 also covers:
State of global ICS asset and network exposure
Sectoral targets and attacks as well as the cost of ransom
Global APT activity, AI usage, actor and tactic profiles, and implications
Rise in volumes of AI-powered cyberattacks
Major cyber events in 2024
Malware and malicious payload trends
Cyberattack types and targets
Vulnerability exploit attempts on CVEs
Attacks on counties – USA
Expansion of bot farms – how, where, and why
In-depth analysis of the cyber threat landscape across North America, South America, Europe, APAC, and the Middle East
Why are attacks on smart factories rising?
Cyber risk predictions
Axis of attacks – Europe
Systemic attacks in the Middle East
Download the full report from here:
https://sectrio.com/resources/ot-threat-landscape-reports/sectrio-releases-ot-ics-and-iot-security-threat-landscape-report-2024/
Kubernetes & AI - Beauty and the Beast !?! @KCD Istanbul 2024Tobias Schneck
As AI technology is pushing into IT I was wondering myself, as an “infrastructure container kubernetes guy”, how get this fancy AI technology get managed from an infrastructure operational view? Is it possible to apply our lovely cloud native principals as well? What benefit’s both technologies could bring to each other?
Let me take this questions and provide you a short journey through existing deployment models and use cases for AI software. On practical examples, we discuss what cloud/on-premise strategy we may need for applying it to our own infrastructure to get it to work from an enterprise perspective. I want to give an overview about infrastructure requirements and technologies, what could be beneficial or limiting your AI use cases in an enterprise environment. An interactive Demo will give you some insides, what approaches I got already working for real.
JMeter webinar - integration with InfluxDB and GrafanaRTTS
Watch this recorded webinar about real-time monitoring of application performance. See how to integrate Apache JMeter, the open-source leader in performance testing, with InfluxDB, the open-source time-series database, and Grafana, the open-source analytics and visualization application.
In this webinar, we will review the benefits of leveraging InfluxDB and Grafana when executing load tests and demonstrate how these tools are used to visualize performance metrics.
Length: 30 minutes
Session Overview
-------------------------------------------
During this webinar, we will cover the following topics while demonstrating the integrations of JMeter, InfluxDB and Grafana:
- What out-of-the-box solutions are available for real-time monitoring JMeter tests?
- What are the benefits of integrating InfluxDB and Grafana into the load testing stack?
- Which features are provided by Grafana?
- Demonstration of InfluxDB and Grafana using a practice web application
To view the webinar recording, go to:
https://www.rttsweb.com/jmeter-integration-webinar
From Daily Decisions to Bottom Line: Connecting Product Work to Revenue by VP...
Collaboration Survey results
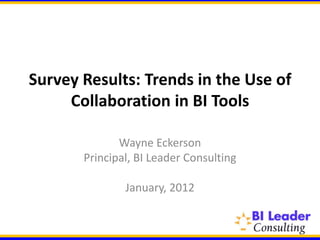
1. Survey Results: Trends in the Use of
Collaboration in BI Tools
Wayne Eckerson
Principal, BI Leader Consulting
January, 2012
2. Respondent Profile
BI or IT Professional 69%
BI Consultant 23%
BI Sponsor or User 8%
Based on 227 respondents, BI Leadership Forum, January 2012 (www.bileadership.com).
www.bileader.com
3. Do you think collaboration tools can
improve analysis and decision making?
Yes 87%
No 3%
Not sure 10%
4. Is collaboration part of the criteria
used to select your BI tools?
Next BI Tool Current BI Tool
58%
Yes
16%
9%
No
74%
33%
Not sure
10%
5. Have you implemented collaboration
software?
Collaborative BI Collaboration Platform
45%
Yes
70%
42%
No
28%
13%
Not Sure
2%
6. Percentage of users who don’t use
available collaboration features
Collaborative BI tools 26%
Stand-alone collaboration platform 11%
7. Types of collaboration by platform
When Analyzing Data When Making Decisions
Send email 82%
67%
Hold meetings 80%
92%
Make phone calls 60%
55%
Use a general-purpose collaboration 26%
platform 17%
They generally don't collaborate 17%
8%
Use collaboration features of a BI tool 16%
11%
Other 4%
3%
8. Ranking of desired BI collaboration features
Annotate content 67%
62%
Shared workspaces 60%
58%
Save current views (snapshots) 52%
50%
Suggest causes of alerts 47%
47%
Attach content to a comment or workspace 44%
39%
Publish content to a server 39%
39%
Attach bookmarks and links to content 38%
38%
Decision tools (e.g., SWOT, pro/con) 37%
34%
Connect to people or workspaces 32%
31%
Favorites 31%
21%
Stream updates of connections 20%
17%
Other 5%
9. Ranking of Collaborative BI Features by Actual Usage
Publish content to a server 35%
28%
Send "live" content via email 26%
25%
Comments 22%
19%
Annotate content 16%
15%
Threaded discussions 15%
14%
Statistics 13%
11%
Wikis 7%
7%
Ratings 6%
6%
Suggest people or content to follow 4%
4%
Decision tools (e.g., SWOT, pro/con) 4%
3%
Stream updates of connections 3%
3%
Other 3%
2%
10. Collaboration Platform Collaborative BI
Shared workspaces 28% 55%
Publish content to a server 35% 49%
Instant messaging or chat 7% 35%
Threaded discussions 15% 29%
Wikis 7% 27%
Comments 21%
22%
Web conferencing 6% 21%
Connect to people or workspaces 4% 19%
Attach content to a comment or workspace 11% 17%
View user profile pages 2% 17%
Attach bookmarks and links to content 16%
15%
Annotate content 12% 16%
11%
NONE
Send "live" content via email 10%
25% Collaboration
26%
Favorites 10% 14% Features
Statistics 10%13%
Save current views (snapshots) 8% 19%
Implemented
Ratings 6%8%
Suggest people or content to follow 4% 8%
Other 3%5%
Decision tools (e.g., SWOT, pro/con) 3%
4%
Suggest causes of alerts 3%
3%
Stream updates of connections 3%
3%
Recommend next steps 3%
3%
11. Collaboration by type of user
BI Collaboration Collaboration Platforms
Power Users (business analysts, report 84%
developers) 77%
Casual Users (executives, managers) 34%
57%
External Users (customers, partners, suppliers) 11%
18%
Front-line workers 14%
30%
IT department 38%
56%
None 6%
4.3%