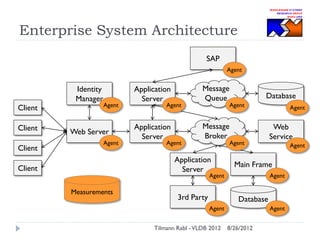
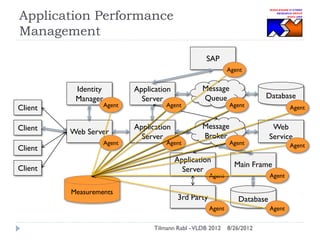
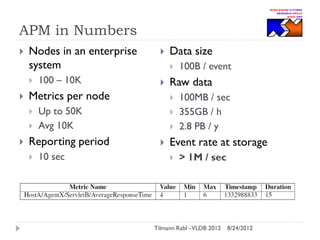
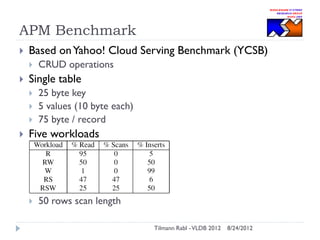
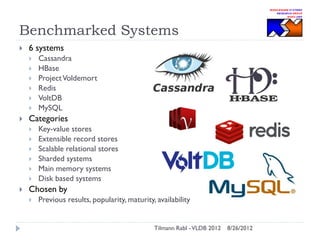
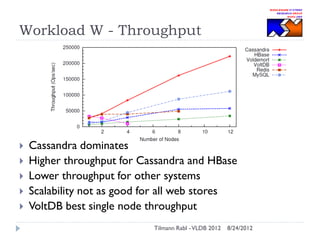
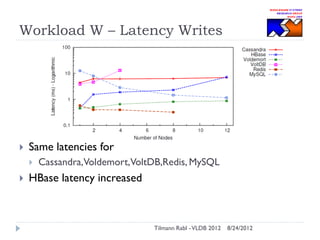
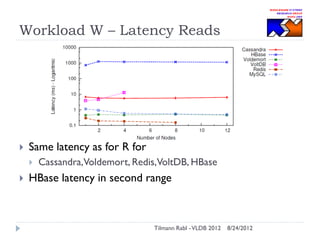
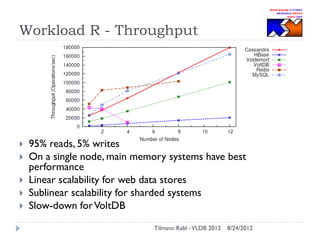
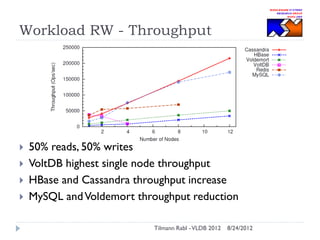
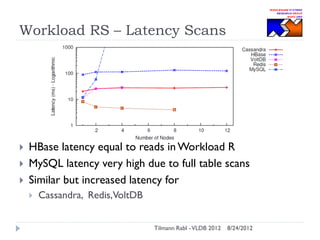
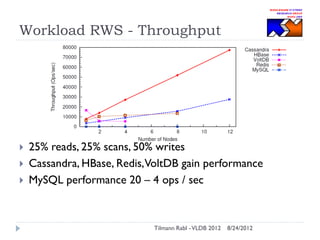
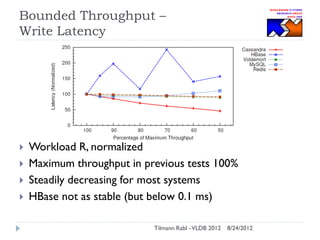
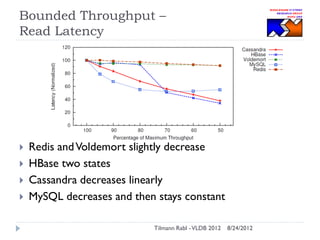
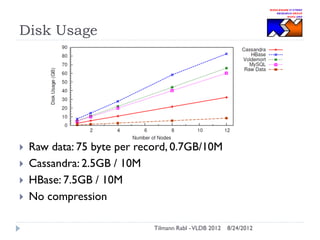
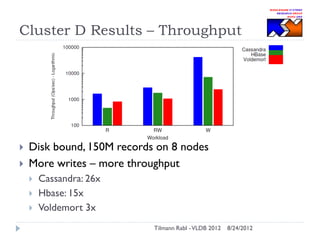
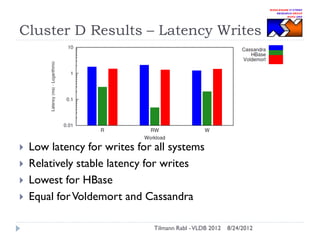
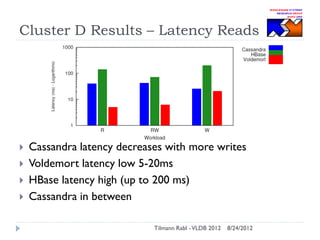
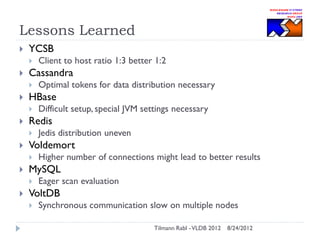
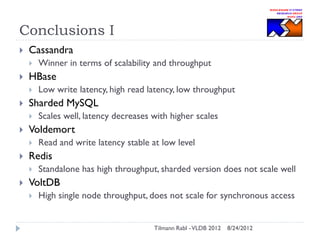
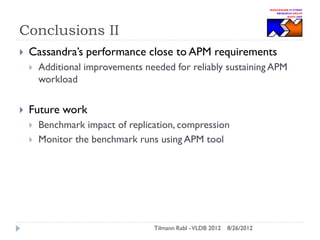
MIDDLEWARE SYSTEMS
RESEARCH GROUP
MSRG.ORG

Solving Big Data Challenges for
Enterprise Application
Performance Management
Tilmann Rabl, Mohammad Sadoghi, Hans-Arno Jacobsen
University of Toronto

Sergio Gomez-Villamor
Universitat Politecnica de Catalunya

Victor Muntes-Mulero*, Serge Mankowskii
CA Labs (Europe*)
Agenda


Application Performance Management



APM Benchmark



Benchmarked Systems



Test Results

Tilmann Rabl - VLDB 2012

8/26/2012
Motivation

Tilmann Rabl - VLDB 2012

8/26/2012
Enterprise System Architecture
SAP
Agent

Client
Client
Client

Identity
Manager

Agent

Web Server
Agent

Application
Server

Agent

Application
Server

Agent

Message
Queue

Database

Agent

Message
Broker

Agent

Agent

Web
Service
Agent

Application
Server

Client

Main Frame

3rd Party

Database

Agent

Measurements

Agent

Agent
Tilmann Rabl - VLDB 2012

Agent
8/26/2012
Application Performance
Management
SAP
Agent

Client
Client
Client

Identity
Manager

Agent

Web Server
Agent

Application
Server

Agent

Application
Server

Agent

Message
Queue

Database

Agent

Message
Broker

Agent

Agent

Web
Service
Agent

Application
Server

Client

Main Frame

3rd Party

Database

Agent

Measurements

Agent

Agent
Tilmann Rabl - VLDB 2012

Agent
8/26/2012
APM in Numbers


Nodes in an enterprise
system










10 sec






100B / event

Raw data


Up to 50K
Avg 10K

Reporting period

Data size


Metrics per node




100 – 10K



100MB / sec
355GB / h
2.8 PB / y

Event rate at storage


> 1M / sec

Tilmann Rabl - VLDB 2012

8/24/2012
APM Benchmark


Based on Yahoo! Cloud Serving Benchmark (YCSB)




Single table






CRUD operations
25 byte key
5 values (10 byte each)
75 byte / record

Five workloads



50 rows scan length
Tilmann Rabl - VLDB 2012

8/24/2012
Benchmarked Systems


6 systems











Categories









Cassandra
HBase
Project Voldemort
Redis
VoltDB
MySQL
Key-value stores
Extensible record stores
Scalable relational stores
Sharded systems
Main memory systems
Disk based systems

Chosen by


Previous results, popularity, maturity, availability

Tilmann Rabl - VLDB 2012

8/26/2012
Classification of Benchmarked
Systems

Disk-Based
Stores
Distributed
In-Memory Sharded
Stores
Key-value stores

Extensible Row
Stores

Scalable Relational
Stores

Tilmann Rabl - VLDB 2012

8/26/2012
Experimental Testbed
Two clusters
 Cluster M (memory-bound)








16 nodes (plus master node)
2x quad core CPU,16 GB RAM, 2x 74GB HDD (RAID 0)
10 million records per node (~700 MB raw)
128 connections per node (8 per core)

Cluster D (disk-bound)






24 nodes
2x dual core CPU, 4 GB RAM, 74 GB HDD
150 million records on 12 nodes (~10.5 GB raw)
8 connections per node
Tilmann Rabl - VLDB 2012

8/24/2012
Evaluation






Minimum 3 runs per workload and system
Fresh install for each run
10 minutes runtime
Up to 5 clients for 12 nodes




To make sure YCSB is no bottleneck

Maximum achievable throughput

Tilmann Rabl - VLDB 2012

8/24/2012
Workload W - Throughput







Cassandra dominates
Higher throughput for Cassandra and HBase
Lower throughput for other systems
Scalability not as good for all web stores
VoltDB best single node throughput
Tilmann Rabl - VLDB 2012

8/24/2012
Workload W – Latency Writes



Same latencies for




Cassandra,Voldemort,VoltDB,Redis, MySQL

HBase latency increased

Tilmann Rabl - VLDB 2012

8/24/2012
Workload W – Latency Reads



Same latency as for R for




Cassandra,Voldemort, Redis,VoltDB, HBase

HBase latency in second range

Tilmann Rabl - VLDB 2012

8/24/2012
Workload R - Throughput







95% reads, 5% writes
On a single node, main memory systems have best
performance
Linear scalability for web data stores
Sublinear scalability for sharded systems
Slow-down for VoltDB
Tilmann Rabl - VLDB 2012

8/24/2012
Workload RW - Throughput






50% reads, 50% writes
VoltDB highest single node throughput
HBase and Cassandra throughput increase
MySQL and Voldemort throughput reduction
Tilmann Rabl - VLDB 2012

8/24/2012
Workload RS – Latency Scans





HBase latency equal to reads in Workload R
MySQL latency very high due to full table scans
Similar but increased latency for


Cassandra, Redis,VoltDB
Tilmann Rabl - VLDB 2012

8/24/2012
Workload RWS - Throughput





25% reads, 25% scans, 50% writes
Cassandra, HBase, Redis,VoltDB gain performance
MySQL performance 20 – 4 ops / sec

Tilmann Rabl - VLDB 2012

8/24/2012
Bounded Throughput –
Write Latency






Workload R, normalized
Maximum throughput in previous tests 100%
Steadily decreasing for most systems
HBase not as stable (but below 0.1 ms)
Tilmann Rabl - VLDB 2012

8/24/2012
Bounded Throughput –
Read Latency






Redis and Voldemort slightly decrease
HBase two states
Cassandra decreases linearly
MySQL decreases and then stays constant
Tilmann Rabl - VLDB 2012

8/24/2012
Disk Usage






Raw data: 75 byte per record, 0.7GB/10M
Cassandra: 2.5GB / 10M
HBase: 7.5GB / 10M
No compression
Tilmann Rabl - VLDB 2012

8/24/2012
Cluster D Results – Throughput




Disk bound, 150M records on 8 nodes
More writes – more throughput




Cassandra: 26x
Hbase: 15x
Voldemort 3x
Tilmann Rabl - VLDB 2012

8/24/2012
Cluster D Results – Latency Writes






Low latency for writes for all systems
Relatively stable latency for writes
Lowest for HBase
Equal for Voldemort and Cassandra
Tilmann Rabl - VLDB 2012

8/24/2012
Cluster D Results – Latency Reads






Cassandra latency decreases with more writes
Voldemort latency low 5-20ms
HBase latency high (up to 200 ms)
Cassandra in between
Tilmann Rabl - VLDB 2012

8/24/2012
Lessons Learned


YCSB




Cassandra




Higher number of connections might lead to better results

MySQL




Jedis distribution uneven

Voldemort




Difficult setup, special JVM settings necessary

Redis




Optimal tokens for data distribution necessary

HBase




Client to host ratio 1:3 better 1:2

Eager scan evaluation

VoltDB


Synchronous communication slow on multiple nodes
Tilmann Rabl - VLDB 2012

8/24/2012
Conclusions I


Cassandra




HBase




Read and write latency stable at low level

Redis




Scales well, latency decreases with higher scales

Voldemort




Low write latency, high read latency, low throughput

Sharded MySQL




Winner in terms of scalability and throughput

Standalone has high throughput, sharded version does not scale well

VoltDB


High single node throughput, does not scale for synchronous access

Tilmann Rabl - VLDB 2012

8/24/2012
Conclusions II


Cassandra’s performance close to APM requirements




Additional improvements needed for reliably sustaining APM
workload

Future work



Benchmark impact of replication, compression
Monitor the benchmark runs using APM tool

Tilmann Rabl - VLDB 2012

8/26/2012
Thanks!

 Questions?



Contact: Tilmann Rabl
tilmann.rabl@utoronto.ca

Tilmann Rabl - VLDB 2012

8/24/2012

Solving Big Data Challenges for Enterprise Application Performance Management

  • 1.
    MIDDLEWARE SYSTEMS RESEARCH GROUP MSRG.ORG SolvingBig Data Challenges for Enterprise Application Performance Management Tilmann Rabl, Mohammad Sadoghi, Hans-Arno Jacobsen University of Toronto Sergio Gomez-Villamor Universitat Politecnica de Catalunya Victor Muntes-Mulero*, Serge Mankowskii CA Labs (Europe*)
  • 2.
    Agenda  Application Performance Management  APMBenchmark  Benchmarked Systems  Test Results Tilmann Rabl - VLDB 2012 8/26/2012
  • 3.
    Motivation Tilmann Rabl -VLDB 2012 8/26/2012
  • 4.
    Enterprise System Architecture SAP Agent Client Client Client Identity Manager Agent WebServer Agent Application Server Agent Application Server Agent Message Queue Database Agent Message Broker Agent Agent Web Service Agent Application Server Client Main Frame 3rd Party Database Agent Measurements Agent Agent Tilmann Rabl - VLDB 2012 Agent 8/26/2012
  • 5.
  • 6.
    APM in Numbers  Nodesin an enterprise system      10 sec    100B / event Raw data  Up to 50K Avg 10K Reporting period Data size  Metrics per node   100 – 10K  100MB / sec 355GB / h 2.8 PB / y Event rate at storage  > 1M / sec Tilmann Rabl - VLDB 2012 8/24/2012
  • 7.
    APM Benchmark  Based onYahoo! Cloud Serving Benchmark (YCSB)   Single table     CRUD operations 25 byte key 5 values (10 byte each) 75 byte / record Five workloads  50 rows scan length Tilmann Rabl - VLDB 2012 8/24/2012
  • 8.
    Benchmarked Systems  6 systems        Categories        Cassandra HBase ProjectVoldemort Redis VoltDB MySQL Key-value stores Extensible record stores Scalable relational stores Sharded systems Main memory systems Disk based systems Chosen by  Previous results, popularity, maturity, availability Tilmann Rabl - VLDB 2012 8/26/2012
  • 9.
    Classification of Benchmarked Systems Disk-Based Stores Distributed In-MemorySharded Stores Key-value stores Extensible Row Stores Scalable Relational Stores Tilmann Rabl - VLDB 2012 8/26/2012
  • 10.
    Experimental Testbed Two clusters Cluster M (memory-bound)      16 nodes (plus master node) 2x quad core CPU,16 GB RAM, 2x 74GB HDD (RAID 0) 10 million records per node (~700 MB raw) 128 connections per node (8 per core) Cluster D (disk-bound)     24 nodes 2x dual core CPU, 4 GB RAM, 74 GB HDD 150 million records on 12 nodes (~10.5 GB raw) 8 connections per node Tilmann Rabl - VLDB 2012 8/24/2012
  • 11.
    Evaluation     Minimum 3 runsper workload and system Fresh install for each run 10 minutes runtime Up to 5 clients for 12 nodes   To make sure YCSB is no bottleneck Maximum achievable throughput Tilmann Rabl - VLDB 2012 8/24/2012
  • 12.
    Workload W -Throughput      Cassandra dominates Higher throughput for Cassandra and HBase Lower throughput for other systems Scalability not as good for all web stores VoltDB best single node throughput Tilmann Rabl - VLDB 2012 8/24/2012
  • 13.
    Workload W –Latency Writes  Same latencies for   Cassandra,Voldemort,VoltDB,Redis, MySQL HBase latency increased Tilmann Rabl - VLDB 2012 8/24/2012
  • 14.
    Workload W –Latency Reads  Same latency as for R for   Cassandra,Voldemort, Redis,VoltDB, HBase HBase latency in second range Tilmann Rabl - VLDB 2012 8/24/2012
  • 15.
    Workload R -Throughput      95% reads, 5% writes On a single node, main memory systems have best performance Linear scalability for web data stores Sublinear scalability for sharded systems Slow-down for VoltDB Tilmann Rabl - VLDB 2012 8/24/2012
  • 16.
    Workload RW -Throughput     50% reads, 50% writes VoltDB highest single node throughput HBase and Cassandra throughput increase MySQL and Voldemort throughput reduction Tilmann Rabl - VLDB 2012 8/24/2012
  • 17.
    Workload RS –Latency Scans    HBase latency equal to reads in Workload R MySQL latency very high due to full table scans Similar but increased latency for  Cassandra, Redis,VoltDB Tilmann Rabl - VLDB 2012 8/24/2012
  • 18.
    Workload RWS -Throughput    25% reads, 25% scans, 50% writes Cassandra, HBase, Redis,VoltDB gain performance MySQL performance 20 – 4 ops / sec Tilmann Rabl - VLDB 2012 8/24/2012
  • 19.
    Bounded Throughput – WriteLatency     Workload R, normalized Maximum throughput in previous tests 100% Steadily decreasing for most systems HBase not as stable (but below 0.1 ms) Tilmann Rabl - VLDB 2012 8/24/2012
  • 20.
    Bounded Throughput – ReadLatency     Redis and Voldemort slightly decrease HBase two states Cassandra decreases linearly MySQL decreases and then stays constant Tilmann Rabl - VLDB 2012 8/24/2012
  • 21.
    Disk Usage     Raw data:75 byte per record, 0.7GB/10M Cassandra: 2.5GB / 10M HBase: 7.5GB / 10M No compression Tilmann Rabl - VLDB 2012 8/24/2012
  • 22.
    Cluster D Results– Throughput   Disk bound, 150M records on 8 nodes More writes – more throughput    Cassandra: 26x Hbase: 15x Voldemort 3x Tilmann Rabl - VLDB 2012 8/24/2012
  • 23.
    Cluster D Results– Latency Writes     Low latency for writes for all systems Relatively stable latency for writes Lowest for HBase Equal for Voldemort and Cassandra Tilmann Rabl - VLDB 2012 8/24/2012
  • 24.
    Cluster D Results– Latency Reads     Cassandra latency decreases with more writes Voldemort latency low 5-20ms HBase latency high (up to 200 ms) Cassandra in between Tilmann Rabl - VLDB 2012 8/24/2012
  • 25.
    Lessons Learned  YCSB   Cassandra   Higher numberof connections might lead to better results MySQL   Jedis distribution uneven Voldemort   Difficult setup, special JVM settings necessary Redis   Optimal tokens for data distribution necessary HBase   Client to host ratio 1:3 better 1:2 Eager scan evaluation VoltDB  Synchronous communication slow on multiple nodes Tilmann Rabl - VLDB 2012 8/24/2012
  • 26.
    Conclusions I  Cassandra   HBase   Read andwrite latency stable at low level Redis   Scales well, latency decreases with higher scales Voldemort   Low write latency, high read latency, low throughput Sharded MySQL   Winner in terms of scalability and throughput Standalone has high throughput, sharded version does not scale well VoltDB  High single node throughput, does not scale for synchronous access Tilmann Rabl - VLDB 2012 8/24/2012
  • 27.
    Conclusions II  Cassandra’s performanceclose to APM requirements   Additional improvements needed for reliably sustaining APM workload Future work   Benchmark impact of replication, compression Monitor the benchmark runs using APM tool Tilmann Rabl - VLDB 2012 8/26/2012
  • 28.
    Thanks!  Questions?  Contact: TilmannRabl tilmann.rabl@utoronto.ca Tilmann Rabl - VLDB 2012 8/24/2012