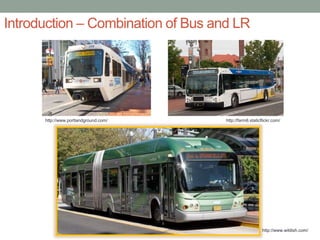
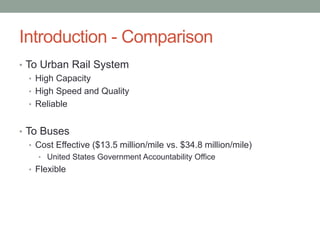
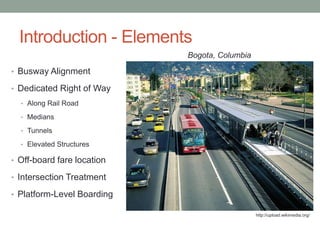
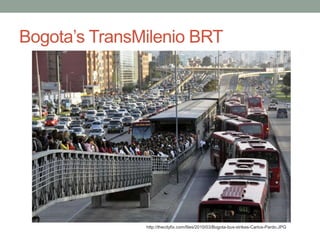
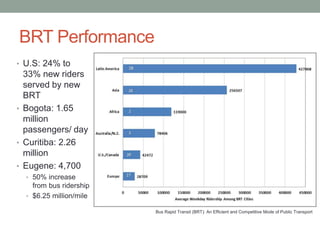
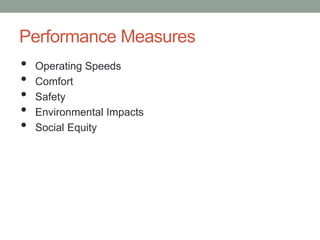
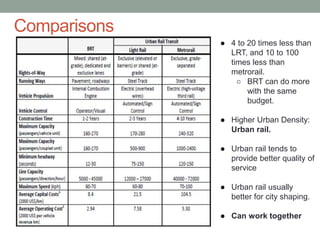
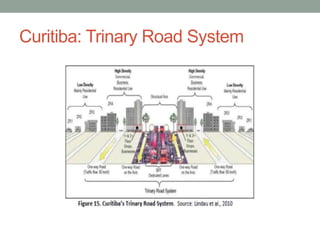
BUS RAPID TRANSIT 
(BRT) 
Presented by: Sina Vadaei, Ali Razmpa, and 
Nick Stoll 
USP 537
Introduction – Combination of Bus and LR 
http://farm6.staticflickr.com/ 
http://www.wildish.com/ 
http://www.portlandground.com/
Introduction - Comparison 
• To Urban Rail System 
• High Capacity 
• High Speed and Quality 
• Reliable 
• To Buses 
• Cost Effective ($13.5 million/mile vs. $34.8 million/mile) 
• United States Government Accountability Office 
• Flexible
Introduction - Elements 
• Busway Alignment 
• Dedicated Right of Way 
• Along Rail Road 
• Medians 
• Tunnels 
• Elevated Structures 
• Off-board fare location 
• Intersection Treatment 
• Platform-Level Boarding 
http://upload.wikimedia.org/ 
Bogota, Columbia
Bogota’s TransMilenio BRT 
http://thecityfix.com/files/2010/03/Bogota-bus-strikes-Carlos-Pardo.JPG
BRT Performance 
• U.S: 24% to 
33% new riders 
served by new 
BRT 
• Bogota: 1.65 
million 
passengers/ day 
• Curitiba: 2.26 
million 
• Eugene: 4,700 
• 50% increase 
from bus ridership 
• $6.25 million/mile 
Bus Rapid Transit (BRT): An Efficient and Competitive Mode of Public Transport
Performance Measures 
• Operating Speeds 
• Comfort 
• Safety 
• Environmental Impacts 
• Social Equity
Comparisons 
● 4 to 20 times less than 
LRT, and 10 to 100 
times less than 
metrorail. 
○ BRT can do more 
with the same 
budget. 
● Higher Urban Density: 
Urban rail. 
● Urban rail tends to 
provide better quality of 
service 
● Urban rail usually 
better for city shaping. 
● Can work together
Curitiba: Trinary Road System
“Managed Competition” 
• Public control, private operation 
o similar to privatization seen last week. 
o awarded to lowest bidder. 
o Bogota: incentives given for service instead of number of 
passengers.
“Ultimately, the obstacle to BRT development are more 
likely to be political than financial or technical. However, 
for the few political leaders who take the chance to 
redefine their cities with full BRT, the rewards are clear.” 
-Lloyd Wright
A Review Over Bus Rapid Transit (BRT) and Economic Development Article: 
Case Study of the Eugene-Springfield BRT System 
Economies of Agglomeration : 
“The decline in average cost as more production occurs within a specified geographical area”
Research Method and Data: 
The Emx BRT system is evaluated for its economic development outcomes in terms of 
employment change within 0.25 and 0.50 miles of BRT stations. 
Employment data obtained from the Local Employment Dynamics (LED) database. 
8% 
-19% 
-43% -37% 
4% 
7% 
37% 
13% 10% 
-6% 
118% 
55% 
23% 
17% 
-14% 
12% 15% 
-2% 
49% 
-22% 
-41% 
-15% 
3% 
160% 
-14% 
24% 
3% 
-6% 
-23% 
-32% 
17% 
52% 
130% 
-1% 
9% 
13% 
Change in Jobs with Respect to Distance from EmX BRT 
Stations, 2004 and 2010 
Change in Jobs within 0.25 mile of Emx Station,2004- 2010 
Change in Jobs between 0.25 and 0.5 mile of Emx Station, 2004-2010
-38 -8 -41 
-103 
118 69 
361 
187 
111 
-7 
281 
846 
95 
-615 
-134 
26 
91 
-542 
698 
30 
-14 -8 -10 
59 87 
-86 
110 
31 0 
-43 
-341 
10 
242 
55 
-132 
23 
-1 
12 
Shift-share distribution of employment change with respect to 
BRT station areas, Eugene-Springfield metropolitan area, 2004–2010 
BRT Shift 0.25 Mile BRT Shift .25-0.5 Mile
Questions 
• Many great benefits were mentioned about BRT. What are 
some of the downfalls and shortcomings of a BRT 
system? 
• Third world countries take advantage of BRT due to its 
low cost. If money is not an issue would a light rail system 
be a better choice? Would a new right rail system attract 
more new transit users or BRT?
Questions 
• What negative effects might BRT system have on job 
changes and distribution of employment? (Assuming in 
Portland) 
• According to the graphs, Please give some reasons for 
considerable changes in certain jobs and distribution of 
employment ?
Questions 
• What would be some good ways to improve the social 
image of BRT? 
• With increased focus and environmental technologies, 
what do you see as the future for BRT systems? 
• In doing a CBA for implementing a BRT vs. a LRT system, 
what factors would you consider?

Bus Rapid Transit (BRT)

  • 1.
    BUS RAPID TRANSIT (BRT) Presented by: Sina Vadaei, Ali Razmpa, and Nick Stoll USP 537
  • 2.
    Introduction – Combinationof Bus and LR http://farm6.staticflickr.com/ http://www.wildish.com/ http://www.portlandground.com/
  • 3.
    Introduction - Comparison • To Urban Rail System • High Capacity • High Speed and Quality • Reliable • To Buses • Cost Effective ($13.5 million/mile vs. $34.8 million/mile) • United States Government Accountability Office • Flexible
  • 4.
    Introduction - Elements • Busway Alignment • Dedicated Right of Way • Along Rail Road • Medians • Tunnels • Elevated Structures • Off-board fare location • Intersection Treatment • Platform-Level Boarding http://upload.wikimedia.org/ Bogota, Columbia
  • 5.
    Bogota’s TransMilenio BRT http://thecityfix.com/files/2010/03/Bogota-bus-strikes-Carlos-Pardo.JPG
  • 6.
    BRT Performance •U.S: 24% to 33% new riders served by new BRT • Bogota: 1.65 million passengers/ day • Curitiba: 2.26 million • Eugene: 4,700 • 50% increase from bus ridership • $6.25 million/mile Bus Rapid Transit (BRT): An Efficient and Competitive Mode of Public Transport
  • 7.
    Performance Measures •Operating Speeds • Comfort • Safety • Environmental Impacts • Social Equity
  • 8.
    Comparisons ● 4to 20 times less than LRT, and 10 to 100 times less than metrorail. ○ BRT can do more with the same budget. ● Higher Urban Density: Urban rail. ● Urban rail tends to provide better quality of service ● Urban rail usually better for city shaping. ● Can work together
  • 9.
  • 10.
    “Managed Competition” •Public control, private operation o similar to privatization seen last week. o awarded to lowest bidder. o Bogota: incentives given for service instead of number of passengers.
  • 11.
    “Ultimately, the obstacleto BRT development are more likely to be political than financial or technical. However, for the few political leaders who take the chance to redefine their cities with full BRT, the rewards are clear.” -Lloyd Wright
  • 12.
    A Review OverBus Rapid Transit (BRT) and Economic Development Article: Case Study of the Eugene-Springfield BRT System Economies of Agglomeration : “The decline in average cost as more production occurs within a specified geographical area”
  • 13.
    Research Method andData: The Emx BRT system is evaluated for its economic development outcomes in terms of employment change within 0.25 and 0.50 miles of BRT stations. Employment data obtained from the Local Employment Dynamics (LED) database. 8% -19% -43% -37% 4% 7% 37% 13% 10% -6% 118% 55% 23% 17% -14% 12% 15% -2% 49% -22% -41% -15% 3% 160% -14% 24% 3% -6% -23% -32% 17% 52% 130% -1% 9% 13% Change in Jobs with Respect to Distance from EmX BRT Stations, 2004 and 2010 Change in Jobs within 0.25 mile of Emx Station,2004- 2010 Change in Jobs between 0.25 and 0.5 mile of Emx Station, 2004-2010
  • 14.
    -38 -8 -41 -103 118 69 361 187 111 -7 281 846 95 -615 -134 26 91 -542 698 30 -14 -8 -10 59 87 -86 110 31 0 -43 -341 10 242 55 -132 23 -1 12 Shift-share distribution of employment change with respect to BRT station areas, Eugene-Springfield metropolitan area, 2004–2010 BRT Shift 0.25 Mile BRT Shift .25-0.5 Mile
  • 15.
    Questions • Manygreat benefits were mentioned about BRT. What are some of the downfalls and shortcomings of a BRT system? • Third world countries take advantage of BRT due to its low cost. If money is not an issue would a light rail system be a better choice? Would a new right rail system attract more new transit users or BRT?
  • 16.
    Questions • Whatnegative effects might BRT system have on job changes and distribution of employment? (Assuming in Portland) • According to the graphs, Please give some reasons for considerable changes in certain jobs and distribution of employment ?
  • 17.
    Questions • Whatwould be some good ways to improve the social image of BRT? • With increased focus and environmental technologies, what do you see as the future for BRT systems? • In doing a CBA for implementing a BRT vs. a LRT system, what factors would you consider?

Editor's Notes

  • #8 Operating Speeds: higher speeds for better built BRT services. This can be increased by grade separation, overpasses, or use of exclusive lanes. Can also be increased by fast boarding techniques like multi-door boarding electronic payment. Make sure schedule is adhered to. Also seen an increase in operating speeds when switched to formalized public services. Istanbul Comfort: Usually has high marks in customer comfort. In the case of Adelaide and Los Angeles, was rated higher than on-street bus or other rail services. BRT Standard 2013 has defined standards to make BRT station comfortable: protection from weather, well-lit, and security. Safety: Grade separation can make BRT more safe than other modes of transit. However, safety can cause a modest effect in lowering efficiency of services. Environmental impacts: Likely positive. Removing cars and replacing slow moving buses likely improves conditions relative to the status quo. BRT is cleaner than LRT. Social Equity: Pro-poor. Successful is implemented with good pricing scheme and focus on the right demographics (Johannesburg the bad example)
  • #9 BRT is usually the most cost-effective alternative. Provides a faster return on investment. However, generally has lower carrying capacity. Urban rail usually provides better connectivity, and tends to have stronger city shaping capabilities. Because urban rail cost more, higher urban densities are needed to justify costs. Urban rail usually provides better quality of service: higher operating speeds and coverage. BRT is often hurt by social stigma. Can be implemented in pieces (attached to existing roadways), so provides service more quickly. Takes more careful planning for BRT to be effective in shaping growth (Ottawa and Curitiba) as best examples. Infrastructure and political support crucial for success of BRT to shape city growth. For larger metro areas, BRT and Urban Rail can often work together. BRT is versatile, cheap, good in low density, feeder system, and can be a could way to link to urban rail.
  • #10 Dedicated BRT lanes. High density around BRT, with low density on the outside. Infrastructure and political support.
  • #11 Most BRT systems, exceptions in the developed world. public authority controls planning, policies, designing routes and schedules, fare setting and collection, services standards, and marketing. private operation control is given to the lowest bidder, who can meet the quality-control standards. Bogota: income to operators is given on the basis of services provided, and not number of people. Payment based on kilometers of service provided and quality (on time). Fined if don’t meet standards. Extra money given to best performing firms.
  • #12 Cheap, versatile way to move people. Often hurt by social stigma and shifting political landscapes.