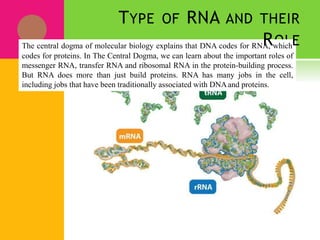
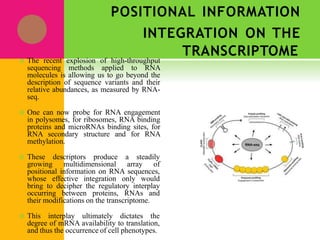
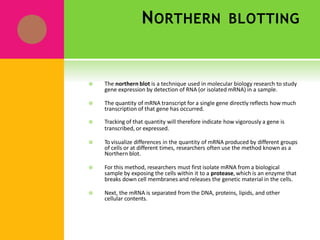
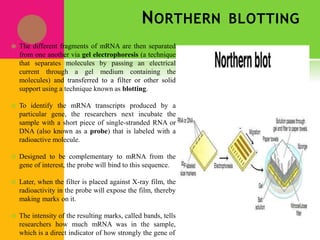
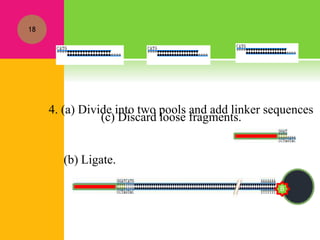
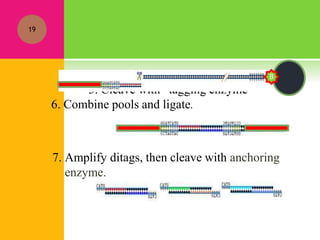
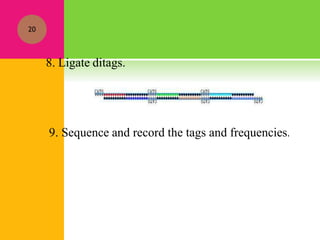
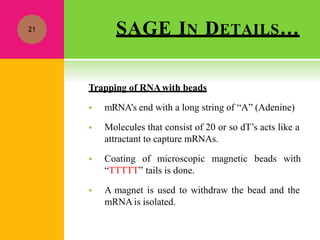
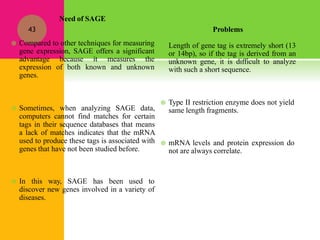
SlideShare a Scribd company logo
TRANSCRIPTOME ANALYSIS
TRANSCRIPTOME: A BRIEF
HISTORY
 Transcriptomics is the study of RNA, single-stranded nucleic acid, which
was not separated from the DNA world until the central dogma was
formulated by Francis Crick in 1958, i.e., the idea that genetic information
is transcribed from DNA to RNA and then translated from RNA into
protein.
 In 1961, Jacob and Monod proposed a model that the protein-coding gene
is transcribed into a special short-lived intermediate associated with the
ribosome, which was designated as messenger RNA(mRNA).
 A short, stable RNA, transfer RNA (tRNA), was identified as the
predicted “adaptor”.
 Shortly, ribosomal RNA (rRNA) involved in protein synthesis was
purified.
 During RNA splicing, the introns are cut out from the primary transcripts
and degraded, while the exons are reassembled into different mature
messenger RNAs (mRNAs) (alternative splicing).
 The discovery of the split gene was a complete surprise and had
revolutionized our understanding of the architecture of genes.
 Since the late 1970s, Altman and Cech revealed respectively that
RNA can function as a catalyst. In 1982, Kruger put forward the
“ribozyme” concept, demonstrating that RNA could act as both
genetic material (like DNA) and a biological catalyst (like protein
enzymes).
 In the early 1990s, it was observed by a number of scientists
independently that RNA inhibited gene expression in plants and
fungi with unknown mechanism. In 1998, Fire and Mello found
that double-stranded RNAs (dsRNAs) could recognize specific
mRNA sequence and then led to the degradation of the target
mRNAs, which was known as RNAinterference (RNAi).
 Further studies indicated that the actual molecules that
directly caused RNAi were short dsRNA fragments of
21–25 base pair, called small interfering RNA
(siRNA).
 In 1977, Sharp and Roberts showed that the mRNA
sequence of adenovirus displayed discontinuous
distribution in the genome, and therefore first
suggested that a typical eukaryotic gene consists of
exons, the protein- coding sequence, and introns, the
non-coding sequence; the protein-coding sequence was
interrupted by the non-coding sequence.
TRANSCRIPTOME
 Transcriptome is the whole set of RNAs
transcribed by the genome from a specific tissue
or cell type at a developmental stage and/or under
a certain physiological condition.
 After the genome has been sequenced,
transcriptome analysis allows us to understand
the expression of genome at the transcription
level, which provides information on gene
structure, regulation of gene expression, gene
product function, and genome dynamics.
TRANSCRIPT FORMATION
STEPS OF TRANSCRIPTION
STRUCTURE OF RNA
OL
TYPE OF RNA AND THEIR
The central dogma of molecular biology explains that DNA codes for RNA
R
, whichE
codes for proteins. In The Central Dogma, we can learn about the important roles of
messenger RNA, transfer RNA and ribosomal RNA in the protein-building process.
But RNA does more than just build proteins. RNA has many jobs in the cell,
including jobs that have been traditionally associated with DNAand proteins.
POSITIONAL INFORMATION
INTEGRATION ON THE
TRANSCRIPTOME
 The recent explosion of high-throughput
sequencing methods applied to RNA
molecules is allowing us to go beyond the
description of sequence variants and their
relative abundances, as measured by RNA-
seq.
 One can now probe for RNA engagement
in polysomes, for ribosomes, RNA binding
proteins and microRNAs binding sites, for
RNA secondary structure and for RNA
methylation.
 These descriptors produce a steadily
growing multidimensional array of
positional information on RNA sequences,
whose effective integration only would
bring to decipher the regulatory interplay
occurring between proteins, RNAs and
their modifications on the transcriptome.
 This interplay ultimately dictates the
degree of mRNA availability to translation,
and thus the occurrence of cell phenotypes.
NORTHERN BLOTTING
 The northern blot is a technique used in molecular biology research to study
gene expression by detection of RNA (or isolated mRNA) in a sample.
 The quantity of mRNA transcript for a single gene directly reflects how much
transcription of that gene has occurred.
 Tracking of that quantity will therefore indicate how vigorously a gene is
transcribed, or expressed.
 To visualize differences in the quantity of mRNA produced by different groups
of cells or at different times, researchers often use the method known as a
Northern blot.
 For this method, researchers must first isolate mRNA from a biological
sample by exposing the cells within it to a protease, which is an enzyme that
breaks down cell membranes and releases the genetic material in the cells.
 Next, the mRNA is separated from the DNA, proteins, lipids, and other
cellular contents.
NORTHERN BLOTTING
 The different fragments of mRNA are then separated
from one another via gel electrophoresis (a technique
that separates molecules by passing an electrical
current through a gel medium containing the
molecules) and transferred to a filter or other solid
support using a technique known as blotting.
 To identify the mRNA transcripts produced by a
particular gene, the researchers next incubate the
sample with a short piece of single-stranded RNA or
DNA (also known as a probe) that is labeled with a
radioactive molecule.
 Designed to be complementary to mRNA from the
gene of interest, the probe will bind to this sequence.
 Later, when the filter is placed against X-ray film, the
radioactivity in the probe will expose the film, thereby
making marks on it.
 The intensity of the resulting marks, called bands, tells
researchers how much mRNA was in the sample,
which is a direct indicator of how strongly the gene of
DRAW BACK AND
MODIFICATION
 Until recently, scientists studied gene expression by looking at only one
or very few gene transcripts at a time.
 Thankfully, new techniques now make large-scale studies of gene
expression possible.
 One such technique is SAGE (serial analysis of gene expression). A
method for measuring the expression patterns of many genes at once,
SAGE not only allows scientists to analyze thousands of gene transcripts
simultaneously, but it also enables them to determine which genes are
active in different tissues or at different stages of cellular development.
 Serial analysis of gene expression (SAGE) is a powerful tool that allows
the analysis of overall gene expression patterns with digital analysis.
Because SAGE does not require a preexisting clone, it can be used to
identify and quantitate new genes as well as known genes.
SAGE
 SAGE invented at Johns Hopkins University in USA(Oncology Center) by
Dr. Victor Velculescu in 1995.
 Serial analysis of gene expression (SAGE) is an approach that allows rapid
and detailed analysis of overall gene expression patterns.
 SAGE identifies and counts the mRNA transcripts in a cell with the help of
short snippets of the genetic code, called tags.
 In most cases, each tag contains enough information to uniquely identify a
transcript.
 The name "serial analysis" refers to the fact that tags are read sequentially as
a continuous string of information.
 SAGE provides quantitative and comprehensive expression profiling in a
given cell population.
 The basic steps of the SAGE technique are:
THE BASIC STEPS OF THE
SAGE TECHNIQUE ARE
OUTLINED BELOW
Capturing mRNA
Rewriting mRNAinto cDNA
Cutting tags from each cDNA
Linking tags together in chains for sequencing
Copying and reading the chains
Identifying and counting the tags
SAGE FLOWCHART…
17
1. Isolate mRNA.
2. (a)Add biotin-labeled dT primer:
(b) Synthesize ds cDNA.
3. (a) Bind to streptavidin-coated beads.
(b) Cleave with “anchoring enzyme”.
B
B
B
(c) Discard loose fragments.
18
4. (a) Divide into two pools and add linker sequences
(b) Ligate.
B
5. Cleave with “tagging enzyme”
19
6. Combine pools and ligate.
7. Amplify ditags, then cleave with anchoring
enzyme.
B
8. Ligate ditags.
9. Sequence and record the tags and frequencies.
20
SAGE IN DETAILS…
Trapping of RNAwith beads
 mRNA’s end with a long string of “A” (Adenine)
 Molecules that consist of 20 or so dT’s acts like a
attractant to capture mRNAs.
 Coating of microscopic magnetic beads with
“TTTTT” tails is done.
 A magnet is used to withdraw the bead and the
mRNA is isolated.
21
22
Microscopic
bead coated
with TTTT’s
23
23
Microscopic
bead coated
with TTTT’s
cDNA synthesis
 ds cDNA is synthesized from the extracted
mRNA by means of biotinylated oligo (dT)
primer.
 cDNA synthesis is immobilized to streptavidin
beads.
24
25
B
B
B
B
B
Biotinylated oligo dT (primers)
B
B
Streptavidin
beads
B
B
B
Enzymatic cleavage of cDNA
 The cDNA molecule is cleaved with a restriction
enzyme.
 Type II restriction enzyme used (E.g. NlaIII.)
 Average length of cDNA – 256bp with sticky
ends created.
26
27
B
B
B
Nla III
(Restriction
enzyme)
B
Ligation of Linkers to bound cDNA
 Captured cDNA are then ligated to linkers at their
ends.
 Linkers must contain:
 NlaIII 4-nucleotide cohesive overhang.
 Type IIs recognition sequence.
 PCR primer sequence.
28
B
29
Linkers
B
B
B
Pool A Pool B
Cleaving with tagging enzyme
 Tagging enzyme, (usually BsmF1) cleave DNA,
releasing the linker-adapted SAGE tag from each
cDNA.
 Repair of ends to make blunt ended tags using
DNA polymerase (Klenow fragments) and
dNTPs.
30
31
B
B
Bsm FI
(tagging Enzyme)
Linker adapted
SAGE tag
Formation of Ditags
 The left thing is the collection of short tags taken
from each molecule.
 Two groups of cDNAs are ligated to each other,
to create a “ditag” with linkers on either end.
 Two tags are linked together using T4 DNA
ligase.
32
33
PCR amplification of Ditags
 The linker-ditag-linker constructs are amplified
by PCR using primers specific to the linkers.
34
35
PCR Amplification
Isolation of Ditags
 The cDNAis again digested by theAnchoring
enzyme (AE)
 Breaking the linker off right where it was added
in beginning.
 This leaves a “sticky” end with the sequence
GTAC (or CAGT on the other strand) at each end
of the ditag.
36
Nla III
(Anchoring enzyme)
37
37
37
37
Concatamerization of Ditags
 Tags are combined into much longer molecules,
called concatamers.
 Each ditag is having an AE site, allowing the
scientist and the computer to recognize where one
ends and the next begins.
38
39
Concatemirize
Cloning Concatamers and Sequencing…
 40Lots of copies are required – so the concatamers are inserted into bacteria,
which act like living “copy machines” to create millions of copies from
original.
 Copies are then sequenced, using machines that can read the nucleotides
in DNA. The result is a long list of nucleotides that has to be analyzed by
computer.
 Analysis will do several things: count the tags, determine which one come
from the same RNA molecule, and figure out which ones come from
known, well studied genes and which ones are new.
Vast amount of data is produced, which must be shifted and ordered for useful
information to become apparent.
SAGE reference databases:
 SAGE map
SAGE Genie
http://www.ncbi.nlm.nih.gov/cgap
HOW DOES THE DATA
LOOK LIKE?
41
42 From Tags to Genes…
 Collect sequence records from GenBank.
 Assign sequence orientation (by finding poly-A tail)
 Assign UniGene identifier to each sequence with a SAGE tag.
 Record (for each tag-gene pair)
 Advantages:
 mRNA sequence does not need to be known prior, so genes of variants
which are not known can be discovered.
 Its more accurate as it involves direct counting of the number of
transcripts.
Problems
Length of gene tag is extremely short (13
or 14bp), so if the tag is derived from an
unknown gene, it is difficult to analyze
with such a short sequence.
 Type II restriction enzyme does not yield
same length fragments.
 mRNA levels and protein expression do
not are always correlate.
Need of SAGE
 Sometimes, when analyzing SAGE data,
computers cannot find matches for certain
tags in their sequence databases that means
a lack of matches indicates that the mRNA
used to produce these tags is associated with
genes that have not been studied before.
 In this way, SAGE has been used to
discover new genes involved in a variety of
diseases.
43
 Compared to other techniques for measuring
gene expression, SAGE offers a significant
advantage because it measures the
expression of both known and unknown
genes.
RNA-SEQ/ NGS
(RNASeq) is revolutionizing the study of the
 RNA sequencing
transcriptome.
 It is providing visibility to previously undetected changes occurring in
disease states, in response to therapeutics, under different environmental
conditions and across a broad range of other study designs.
 Compared with Sanger sequencing, the core of NGS is massive parallel
sequencing.
 Development of nanotechnology makes it possible to sequence hundreds
of thousands of DNA molecules simultaneously.
 The prototype of NGS is massive parallel signature sequencing (MPSS),
which applies four rounds of restriction enzyme digestion and ligation
reactions to determine the nucleotide sequence of cDNA ends generating a
17–20 bp sequence as the fingerprint of a corresponding RNA.
 MPSS is used to digitize the quantitative transcriptome with the capacity
to produce more than 100000 signatures at a time.
 However, due to the nature of digestion and ligation reactions, a large
fraction of the sequence signatures obtained is not long enough to be
unique fingerprints of RNAmolecules.
 Overcoming the limits of MPSS, Illumina, Roche, Lifescientific, and other
companies developed their own platforms with considerable improvement
on the throughput, reading length, and sequencing accuracy. Based on
these platforms, the RNA-seq methodology became the most convenient
and cost effective tool for transcriptome analysis.
 RNASeq allows researchers to detect both known and novel features in a
single assay, enabling the detection of transcript isoforms, gene fusions,
single nucleotide variants, allele specific gene expression and other
features without the limitation of prior knowledge.
 High throughput sequencing also called Next Generation Sequencing
(NGS) have the capacity to sequence full genomes. Bacteriophage fX174,
was the first genome to be sequenced, a viral genome with only 5,368
base pairs (bp).
RNA-Seq or Transcriptome Sequencing
Sequencing technologies applicable to RNA-Seq
High throughput
• Illumina HiSeq 2500
• Illumina Next-Seq 500
• Illumina MiSeq
• Illumina X Ten
“Lower” throughput
• Roche 454
Low throughput
• Sanger
Illumina…
Martin J.A. and Wang Z., Nat. Rev. Genet. (2011) 12:671–682
From RNA -> sequence data
Martin J.A. and Wang Z., Nat. Rev. Genet. (2011) 12:671–682
From RNA -> sequence data
Ready for sequencing
DNA
(0.1-5.0 μg)
Library Preparation
1 2 3 9
4 5 6
T G T A C G A T …
ILLUMINA SEQUENCING TECHNOLOGY WORKFLOW
C
C
C
A
A
A
T
T
G
G
G
G
Sequencing
Single molecule array
Cluster Growth
7 8
Image Acquisition Base Calling
5’
3’ 5’
T
G
T
A
C
G
A
T
C
A
C
C
C
G
A
T
C
G
A
A
49
Alvaro Hernandez
Martin J.A. and Wang Z., Nat. Rev. Genet. (2011) 12:671–682
From RNA -> sequence data
Other Technologies to Study Expression
1. Expressed Sequence Tags (ESTs)
2. RT-PCR
3. DNA Microarray’s
4. Bioinformatics
EST AND MICROARRAY
 Sanger sequencing of EST or cDNA library provided
information for genome annotation in the early days of
genome research.
 Due to the limitations on throughput and cost, it is
impossible to achieve transcriptome quantitative
analysis using EST methods.
 With serial analysis of gene expression (SAGE) and
CAGE, respectively, multiple 3′ and 5′ cDNA ends
were concatenated to be one clone.
 Therefore, multiple sequence tags can be recovered
from one Sanger sequencing reaction, which overcomes
those limits and makes quantitative analysis possible.
 However, due to the high cost of Sanger sequencing
and the difficulty to map the short sequence (~20 bp)
tags to genome, CAGE and SAGE were replaced by
DNAmicroarray shortly.
• Short, annotated sequences at 3’or 5’end
• Can be used to determine the number of genes/genome
DNA MICROARRAYS
 DNA microarray or chip method is based on nucleic acid
hybridization.
 Fluorescent labeled cDNAs incubate with oligonucleotide probes
on the chip, then the abundance of RNA is determined by
measuring fluorescence density.
 High-density gene chip allowed relatively low cost gene
expression profiling.
 Specific microarrays were designed according to the purpose of
the experiment, such as arrays to detect different isoforms from
alternative splicing.
 In addition, the genome tiling array is an unbiased design, without
prior knowledge of genome transcription information, using a set
of overlapping oligonucleotide probes for the detection of whole
genome expression with the resolution up to a few nucleotides.
 However, for large genomes, tiling array is expensive. Another
limiting factor of hybridization methodology is high background,
because it is unable to distinguish RNA molecules sharing high
sequence similarity.
• High-throughput
• Allows for simultaneous detection of genome-wide expression
• Can provide relative quantitative information about expression…
Microarray vs. SAGE
QRT-PCR
•Can be used to both detect &
quantify gene expression
• Not high-throughput
• Can only be used on a limited scale
BIOINFORMATICS ANALYSIS
Data alignment
We need to align the sequence data to our genome of interest
 If aligning RNA-Seq data to the genome, always pick a slice-aware aligner
TopHat2, MapSplice, SOAPSplice, Passion, SpliceMap, RUM, ABMapper, CRAC,
GSNAP, HMMSplicer, Olego, BLAT
 There are excellent aligners available that are not splice-aware. These are useful
for aligning directly to an already available transcriptome (gene models, so you
are not worrying about introns). However, be aware that you will lose isoform
information.
Bowtie2, BWA, Novoalign (not free), SOAPaligner
Sequence formats
• FASTA
• FASTQ
Alignment formats
• SAM/BAM
Feature formats
• GFF (– Gene feature
format)
• GTF(Gene transfer format)
File formats
A brief note
STATUS OF TRANSCRIPTOME
ANALYSIS IN INDIA
 Plant Biotechnology Division, CSIR- Indian Institute
of Integrative Medicine, Sanat Nagar, Srinagar, J&K,
India.
 Academy of Science and Innovative Research
(AcSIR),Anusandhan Bhawan, New Delhi, India.
 Division of Biotechnology, CSIR- Institute of
Himalayan Bioresource Technology, Palampur, India
 School of Biotechnology, University of Jammu,
Jammu, Jammu & Kashmir, India,
 National Institute of Plant Genome Research (NIPGR),
ArunaAsafAli Marg, New Delhi, India
APPLICATION
 Transcriptome analysis will further reveal the regulation network of biological
processes and eventually give some guidance in disease diagnosis and crop
improvement.
 RNA-Seq is a powerful approach that enables researchers to discover, profile
and quantify RNA transcripts in the whole transcriptome. As this method does
not use predesigned probes or primers, it becomes an unbiased hypothesis free
approach providing researchers with applications that are not possible by
traditional microarray based methods.
 RNASEQUENCING IS USED WIDELY FOR:
 Studies of gene expression and discovery of novel transcripts and isoforms
 SNPdiscovery in the coding portions of the genome
 Denovo transcriptome assembly
 Basis for expression quantification in RNA-Seq
CONCLUSION
To analyze differences between gene expression patterns of cancer cells and their normal counter parts.
Examining which transcripts are present in a cell.
Allows rapid, detailed analysis of thousands of transcripts in a cell.
By comparing different types of cells, generate profiles that will help to understand healthy cells and what
goes wrong in diseases.
By comparing different types of cells, generate profiles that will help to understand healthy cells and what
goes wrong in diseases.
To identify downstream targets of oncogenes and tumor suppresser genes.
Studied the tumors of pancreatic and colon tumors.
Zhang et al.(1997)Science, 276(5316), 1268-1272.
59

More Related Content

Similar to BTC 810 Analysis of Transcriptomes.pptx

Study of Transcriptome
Study of TranscriptomeStudy of Transcriptome
Study of Transcriptome
BOTANYWith
 
Principle and method of RNAi-Creative Biogene
Principle and method of RNAi-Creative BiogenePrinciple and method of RNAi-Creative Biogene
Principle and method of RNAi-Creative Biogene
Donglin Bao
 
BIOTECHNOLOGY PPT.pptx
BIOTECHNOLOGY PPT.pptxBIOTECHNOLOGY PPT.pptx
BIOTECHNOLOGY PPT.pptx
Chirag Dhankhar
 
Transcriptomics approaches
Transcriptomics approachesTranscriptomics approaches
Transcriptomics approaches
CharupriyaChauhan1
 
Microarray @ujjwal sirohi
Microarray @ujjwal sirohiMicroarray @ujjwal sirohi
Microarray @ujjwal sirohi
ujjwal sirohi
 
Restriction mapping
Restriction mappingRestriction mapping
Restriction mapping
ArdraArdra1
 
Gene expression profiling
Gene expression profilingGene expression profiling
Gene expression profiling
PriyankaPriyanka63
 
Non Coding RNA.pdf
Non Coding RNA.pdfNon Coding RNA.pdf
Non Coding RNA.pdf
Babita Neupane
 
Genetic engineering
Genetic engineering Genetic engineering
Genetic engineering
Diya Khan
 
The research and application progress of transcriptome sequencing technology (i)
The research and application progress of transcriptome sequencing technology (i)The research and application progress of transcriptome sequencing technology (i)
The research and application progress of transcriptome sequencing technology (i)
creativebiolabs11
 
DNA library ppt.pptx
DNA library ppt.pptxDNA library ppt.pptx
DNA library ppt.pptx
PrabhatSingh628463
 
HGP, the human genome project
HGP, the human genome projectHGP, the human genome project
HGP, the human genome project
Bahauddin Zakariya University lahore
 
LncRNA (Long noncoding RNA)
LncRNA (Long noncoding RNA)LncRNA (Long noncoding RNA)
LncRNA (Long noncoding RNA)
sogand vahidi
 
16S Ribosomal DNA Sequence Analysis
16S Ribosomal DNA Sequence Analysis16S Ribosomal DNA Sequence Analysis
16S Ribosomal DNA Sequence AnalysisAbdulrahman Muhammad
 
Differentiated Fern Research Paper
Differentiated Fern Research PaperDifferentiated Fern Research Paper
Differentiated Fern Research Paper
Alison Reed
 
SAGE- Serial Analysis of Gene Expression
SAGE- Serial Analysis of Gene ExpressionSAGE- Serial Analysis of Gene Expression
SAGE- Serial Analysis of Gene Expression
Aashish Patel
 
Research methodology Chapter 6 summary
Research methodology Chapter 6 summaryResearch methodology Chapter 6 summary
Research methodology Chapter 6 summary
Bobeisha Black Pre.
 
Biochem synthesis of rna(june.23.2010)
Biochem   synthesis of rna(june.23.2010)Biochem   synthesis of rna(june.23.2010)
Biochem synthesis of rna(june.23.2010)MBBS IMS MSU
 
NORTHERN BLOTTING.pptx
NORTHERN BLOTTING.pptxNORTHERN BLOTTING.pptx
NORTHERN BLOTTING.pptx
Nusrat Sheikh
 
Evolutionary analysis across mammals reveals distinct classes of long non-cod...
Evolutionary analysis across mammals reveals distinct classes of long non-cod...Evolutionary analysis across mammals reveals distinct classes of long non-cod...
Evolutionary analysis across mammals reveals distinct classes of long non-cod...
Jacob Hanna - Weizmann Institute of Science
 

Similar to BTC 810 Analysis of Transcriptomes.pptx (20)

Study of Transcriptome
Study of TranscriptomeStudy of Transcriptome
Study of Transcriptome
 
Principle and method of RNAi-Creative Biogene
Principle and method of RNAi-Creative BiogenePrinciple and method of RNAi-Creative Biogene
Principle and method of RNAi-Creative Biogene
 
BIOTECHNOLOGY PPT.pptx
BIOTECHNOLOGY PPT.pptxBIOTECHNOLOGY PPT.pptx
BIOTECHNOLOGY PPT.pptx
 
Transcriptomics approaches
Transcriptomics approachesTranscriptomics approaches
Transcriptomics approaches
 
Microarray @ujjwal sirohi
Microarray @ujjwal sirohiMicroarray @ujjwal sirohi
Microarray @ujjwal sirohi
 
Restriction mapping
Restriction mappingRestriction mapping
Restriction mapping
 
Gene expression profiling
Gene expression profilingGene expression profiling
Gene expression profiling
 
Non Coding RNA.pdf
Non Coding RNA.pdfNon Coding RNA.pdf
Non Coding RNA.pdf
 
Genetic engineering
Genetic engineering Genetic engineering
Genetic engineering
 
The research and application progress of transcriptome sequencing technology (i)
The research and application progress of transcriptome sequencing technology (i)The research and application progress of transcriptome sequencing technology (i)
The research and application progress of transcriptome sequencing technology (i)
 
DNA library ppt.pptx
DNA library ppt.pptxDNA library ppt.pptx
DNA library ppt.pptx
 
HGP, the human genome project
HGP, the human genome projectHGP, the human genome project
HGP, the human genome project
 
LncRNA (Long noncoding RNA)
LncRNA (Long noncoding RNA)LncRNA (Long noncoding RNA)
LncRNA (Long noncoding RNA)
 
16S Ribosomal DNA Sequence Analysis
16S Ribosomal DNA Sequence Analysis16S Ribosomal DNA Sequence Analysis
16S Ribosomal DNA Sequence Analysis
 
Differentiated Fern Research Paper
Differentiated Fern Research PaperDifferentiated Fern Research Paper
Differentiated Fern Research Paper
 
SAGE- Serial Analysis of Gene Expression
SAGE- Serial Analysis of Gene ExpressionSAGE- Serial Analysis of Gene Expression
SAGE- Serial Analysis of Gene Expression
 
Research methodology Chapter 6 summary
Research methodology Chapter 6 summaryResearch methodology Chapter 6 summary
Research methodology Chapter 6 summary
 
Biochem synthesis of rna(june.23.2010)
Biochem   synthesis of rna(june.23.2010)Biochem   synthesis of rna(june.23.2010)
Biochem synthesis of rna(june.23.2010)
 
NORTHERN BLOTTING.pptx
NORTHERN BLOTTING.pptxNORTHERN BLOTTING.pptx
NORTHERN BLOTTING.pptx
 
Evolutionary analysis across mammals reveals distinct classes of long non-cod...
Evolutionary analysis across mammals reveals distinct classes of long non-cod...Evolutionary analysis across mammals reveals distinct classes of long non-cod...
Evolutionary analysis across mammals reveals distinct classes of long non-cod...
 

More from ChijiokeNsofor

BTC 509 Intersection of AI and Biotechnolog.pptx
BTC 509 Intersection of AI and Biotechnolog.pptxBTC 509 Intersection of AI and Biotechnolog.pptx
BTC 509 Intersection of AI and Biotechnolog.pptx
ChijiokeNsofor
 
BTC 810 Mass spectrometry and it applications.ppt
BTC 810 Mass spectrometry and it applications.pptBTC 810 Mass spectrometry and it applications.ppt
BTC 810 Mass spectrometry and it applications.ppt
ChijiokeNsofor
 
Work Report- October 2021.pptx
Work Report- October 2021.pptxWork Report- October 2021.pptx
Work Report- October 2021.pptx
ChijiokeNsofor
 
FRS 310 Bite mark evidence.ppt
FRS 310 Bite mark evidence.pptFRS 310 Bite mark evidence.ppt
FRS 310 Bite mark evidence.ppt
ChijiokeNsofor
 
Project Report.pptx
Project Report.pptxProject Report.pptx
Project Report.pptx
ChijiokeNsofor
 
cells of immune system.ppt
cells of immune system.pptcells of immune system.ppt
cells of immune system.ppt
ChijiokeNsofor
 
FRS 301 Analysis of biological fluids.pptx
FRS 301 Analysis of biological fluids.pptxFRS 301 Analysis of biological fluids.pptx
FRS 301 Analysis of biological fluids.pptx
ChijiokeNsofor
 
FRS 411-POST MORTEM CHANGES.ppt
FRS 411-POST MORTEM CHANGES.pptFRS 411-POST MORTEM CHANGES.ppt
FRS 411-POST MORTEM CHANGES.ppt
ChijiokeNsofor
 
FRS 411-Death.pptx
FRS 411-Death.pptxFRS 411-Death.pptx
FRS 411-Death.pptx
ChijiokeNsofor
 
FRS 310 Bite mark.pptx
FRS 310 Bite mark.pptxFRS 310 Bite mark.pptx
FRS 310 Bite mark.pptx
ChijiokeNsofor
 
antibody engineering.ppt
antibody engineering.pptantibody engineering.ppt
antibody engineering.ppt
ChijiokeNsofor
 
BTC 506 Phylogenetic Tree.pptx
BTC 506 Phylogenetic Tree.pptxBTC 506 Phylogenetic Tree.pptx
BTC 506 Phylogenetic Tree.pptx
ChijiokeNsofor
 
FRS 304 Forensic Anthropology-Introduction.pptx
FRS 304 Forensic Anthropology-Introduction.pptxFRS 304 Forensic Anthropology-Introduction.pptx
FRS 304 Forensic Anthropology-Introduction.pptx
ChijiokeNsofor
 
cells of immune system.ppt
cells of immune system.pptcells of immune system.ppt
cells of immune system.ppt
ChijiokeNsofor
 
BTC 506 Gene Identification using Bioinformatic Tools-230302130331.pptx
BTC 506 Gene Identification using Bioinformatic Tools-230302130331.pptxBTC 506 Gene Identification using Bioinformatic Tools-230302130331.pptx
BTC 506 Gene Identification using Bioinformatic Tools-230302130331.pptx
ChijiokeNsofor
 
bioassay.pdf
bioassay.pdfbioassay.pdf
bioassay.pdf
ChijiokeNsofor
 
BTC 506 Phylogenetic Analysis.pptx
BTC 506 Phylogenetic Analysis.pptxBTC 506 Phylogenetic Analysis.pptx
BTC 506 Phylogenetic Analysis.pptx
ChijiokeNsofor
 
cancer prevention.pptx
cancer prevention.pptxcancer prevention.pptx
cancer prevention.pptx
ChijiokeNsofor
 
bioassay-converted.pptx
bioassay-converted.pptxbioassay-converted.pptx
bioassay-converted.pptx
ChijiokeNsofor
 
bacterial genome organization.pptx
bacterial genome organization.pptxbacterial genome organization.pptx
bacterial genome organization.pptx
ChijiokeNsofor
 

More from ChijiokeNsofor (20)

BTC 509 Intersection of AI and Biotechnolog.pptx
BTC 509 Intersection of AI and Biotechnolog.pptxBTC 509 Intersection of AI and Biotechnolog.pptx
BTC 509 Intersection of AI and Biotechnolog.pptx
 
BTC 810 Mass spectrometry and it applications.ppt
BTC 810 Mass spectrometry and it applications.pptBTC 810 Mass spectrometry and it applications.ppt
BTC 810 Mass spectrometry and it applications.ppt
 
Work Report- October 2021.pptx
Work Report- October 2021.pptxWork Report- October 2021.pptx
Work Report- October 2021.pptx
 
FRS 310 Bite mark evidence.ppt
FRS 310 Bite mark evidence.pptFRS 310 Bite mark evidence.ppt
FRS 310 Bite mark evidence.ppt
 
Project Report.pptx
Project Report.pptxProject Report.pptx
Project Report.pptx
 
cells of immune system.ppt
cells of immune system.pptcells of immune system.ppt
cells of immune system.ppt
 
FRS 301 Analysis of biological fluids.pptx
FRS 301 Analysis of biological fluids.pptxFRS 301 Analysis of biological fluids.pptx
FRS 301 Analysis of biological fluids.pptx
 
FRS 411-POST MORTEM CHANGES.ppt
FRS 411-POST MORTEM CHANGES.pptFRS 411-POST MORTEM CHANGES.ppt
FRS 411-POST MORTEM CHANGES.ppt
 
FRS 411-Death.pptx
FRS 411-Death.pptxFRS 411-Death.pptx
FRS 411-Death.pptx
 
FRS 310 Bite mark.pptx
FRS 310 Bite mark.pptxFRS 310 Bite mark.pptx
FRS 310 Bite mark.pptx
 
antibody engineering.ppt
antibody engineering.pptantibody engineering.ppt
antibody engineering.ppt
 
BTC 506 Phylogenetic Tree.pptx
BTC 506 Phylogenetic Tree.pptxBTC 506 Phylogenetic Tree.pptx
BTC 506 Phylogenetic Tree.pptx
 
FRS 304 Forensic Anthropology-Introduction.pptx
FRS 304 Forensic Anthropology-Introduction.pptxFRS 304 Forensic Anthropology-Introduction.pptx
FRS 304 Forensic Anthropology-Introduction.pptx
 
cells of immune system.ppt
cells of immune system.pptcells of immune system.ppt
cells of immune system.ppt
 
BTC 506 Gene Identification using Bioinformatic Tools-230302130331.pptx
BTC 506 Gene Identification using Bioinformatic Tools-230302130331.pptxBTC 506 Gene Identification using Bioinformatic Tools-230302130331.pptx
BTC 506 Gene Identification using Bioinformatic Tools-230302130331.pptx
 
bioassay.pdf
bioassay.pdfbioassay.pdf
bioassay.pdf
 
BTC 506 Phylogenetic Analysis.pptx
BTC 506 Phylogenetic Analysis.pptxBTC 506 Phylogenetic Analysis.pptx
BTC 506 Phylogenetic Analysis.pptx
 
cancer prevention.pptx
cancer prevention.pptxcancer prevention.pptx
cancer prevention.pptx
 
bioassay-converted.pptx
bioassay-converted.pptxbioassay-converted.pptx
bioassay-converted.pptx
 
bacterial genome organization.pptx
bacterial genome organization.pptxbacterial genome organization.pptx
bacterial genome organization.pptx
 

Recently uploaded

The Benefits and Techniques of Trenchless Pipe Repair.pdf
The Benefits and Techniques of Trenchless Pipe Repair.pdfThe Benefits and Techniques of Trenchless Pipe Repair.pdf
The Benefits and Techniques of Trenchless Pipe Repair.pdf
Pipe Restoration Solutions
 
ASME IX(9) 2007 Full Version .pdf
ASME IX(9)  2007 Full Version       .pdfASME IX(9)  2007 Full Version       .pdf
ASME IX(9) 2007 Full Version .pdf
AhmedHussein950959
 
English lab ppt no titlespecENG PPTt.pdf
English lab ppt no titlespecENG PPTt.pdfEnglish lab ppt no titlespecENG PPTt.pdf
English lab ppt no titlespecENG PPTt.pdf
BrazilAccount1
 
Industrial Training at Shahjalal Fertilizer Company Limited (SFCL)
Industrial Training at Shahjalal Fertilizer Company Limited (SFCL)Industrial Training at Shahjalal Fertilizer Company Limited (SFCL)
Industrial Training at Shahjalal Fertilizer Company Limited (SFCL)
MdTanvirMahtab2
 
space technology lecture notes on satellite
space technology lecture notes on satellitespace technology lecture notes on satellite
space technology lecture notes on satellite
ongomchris
 
H.Seo, ICLR 2024, MLILAB, KAIST AI.pdf
H.Seo,  ICLR 2024, MLILAB,  KAIST AI.pdfH.Seo,  ICLR 2024, MLILAB,  KAIST AI.pdf
H.Seo, ICLR 2024, MLILAB, KAIST AI.pdf
MLILAB
 
Railway Signalling Principles Edition 3.pdf
Railway Signalling Principles Edition 3.pdfRailway Signalling Principles Edition 3.pdf
Railway Signalling Principles Edition 3.pdf
TeeVichai
 
一比一原版(UofT毕业证)多伦多大学毕业证成绩单如何办理
一比一原版(UofT毕业证)多伦多大学毕业证成绩单如何办理一比一原版(UofT毕业证)多伦多大学毕业证成绩单如何办理
一比一原版(UofT毕业证)多伦多大学毕业证成绩单如何办理
ydteq
 
weather web application report.pdf
weather web application report.pdfweather web application report.pdf
weather web application report.pdf
Pratik Pawar
 
Sachpazis:Terzaghi Bearing Capacity Estimation in simple terms with Calculati...
Sachpazis:Terzaghi Bearing Capacity Estimation in simple terms with Calculati...Sachpazis:Terzaghi Bearing Capacity Estimation in simple terms with Calculati...
Sachpazis:Terzaghi Bearing Capacity Estimation in simple terms with Calculati...
Dr.Costas Sachpazis
 
Governing Equations for Fundamental Aerodynamics_Anderson2010.pdf
Governing Equations for Fundamental Aerodynamics_Anderson2010.pdfGoverning Equations for Fundamental Aerodynamics_Anderson2010.pdf
Governing Equations for Fundamental Aerodynamics_Anderson2010.pdf
WENKENLI1
 
NO1 Uk best vashikaran specialist in delhi vashikaran baba near me online vas...
NO1 Uk best vashikaran specialist in delhi vashikaran baba near me online vas...NO1 Uk best vashikaran specialist in delhi vashikaran baba near me online vas...
NO1 Uk best vashikaran specialist in delhi vashikaran baba near me online vas...
Amil Baba Dawood bangali
 
Nuclear Power Economics and Structuring 2024
Nuclear Power Economics and Structuring 2024Nuclear Power Economics and Structuring 2024
Nuclear Power Economics and Structuring 2024
Massimo Talia
 
Cosmetic shop management system project report.pdf
Cosmetic shop management system project report.pdfCosmetic shop management system project report.pdf
Cosmetic shop management system project report.pdf
Kamal Acharya
 
Hybrid optimization of pumped hydro system and solar- Engr. Abdul-Azeez.pdf
Hybrid optimization of pumped hydro system and solar- Engr. Abdul-Azeez.pdfHybrid optimization of pumped hydro system and solar- Engr. Abdul-Azeez.pdf
Hybrid optimization of pumped hydro system and solar- Engr. Abdul-Azeez.pdf
fxintegritypublishin
 
AP LAB PPT.pdf ap lab ppt no title specific
AP LAB PPT.pdf ap lab ppt no title specificAP LAB PPT.pdf ap lab ppt no title specific
AP LAB PPT.pdf ap lab ppt no title specific
BrazilAccount1
 
block diagram and signal flow graph representation
block diagram and signal flow graph representationblock diagram and signal flow graph representation
block diagram and signal flow graph representation
Divya Somashekar
 
J.Yang, ICLR 2024, MLILAB, KAIST AI.pdf
J.Yang,  ICLR 2024, MLILAB, KAIST AI.pdfJ.Yang,  ICLR 2024, MLILAB, KAIST AI.pdf
J.Yang, ICLR 2024, MLILAB, KAIST AI.pdf
MLILAB
 
ML for identifying fraud using open blockchain data.pptx
ML for identifying fraud using open blockchain data.pptxML for identifying fraud using open blockchain data.pptx
ML for identifying fraud using open blockchain data.pptx
Vijay Dialani, PhD
 
RAT: Retrieval Augmented Thoughts Elicit Context-Aware Reasoning in Long-Hori...
RAT: Retrieval Augmented Thoughts Elicit Context-Aware Reasoning in Long-Hori...RAT: Retrieval Augmented Thoughts Elicit Context-Aware Reasoning in Long-Hori...
RAT: Retrieval Augmented Thoughts Elicit Context-Aware Reasoning in Long-Hori...
thanhdowork
 

Recently uploaded (20)

The Benefits and Techniques of Trenchless Pipe Repair.pdf
The Benefits and Techniques of Trenchless Pipe Repair.pdfThe Benefits and Techniques of Trenchless Pipe Repair.pdf
The Benefits and Techniques of Trenchless Pipe Repair.pdf
 
ASME IX(9) 2007 Full Version .pdf
ASME IX(9)  2007 Full Version       .pdfASME IX(9)  2007 Full Version       .pdf
ASME IX(9) 2007 Full Version .pdf
 
English lab ppt no titlespecENG PPTt.pdf
English lab ppt no titlespecENG PPTt.pdfEnglish lab ppt no titlespecENG PPTt.pdf
English lab ppt no titlespecENG PPTt.pdf
 
Industrial Training at Shahjalal Fertilizer Company Limited (SFCL)
Industrial Training at Shahjalal Fertilizer Company Limited (SFCL)Industrial Training at Shahjalal Fertilizer Company Limited (SFCL)
Industrial Training at Shahjalal Fertilizer Company Limited (SFCL)
 
space technology lecture notes on satellite
space technology lecture notes on satellitespace technology lecture notes on satellite
space technology lecture notes on satellite
 
H.Seo, ICLR 2024, MLILAB, KAIST AI.pdf
H.Seo,  ICLR 2024, MLILAB,  KAIST AI.pdfH.Seo,  ICLR 2024, MLILAB,  KAIST AI.pdf
H.Seo, ICLR 2024, MLILAB, KAIST AI.pdf
 
Railway Signalling Principles Edition 3.pdf
Railway Signalling Principles Edition 3.pdfRailway Signalling Principles Edition 3.pdf
Railway Signalling Principles Edition 3.pdf
 
一比一原版(UofT毕业证)多伦多大学毕业证成绩单如何办理
一比一原版(UofT毕业证)多伦多大学毕业证成绩单如何办理一比一原版(UofT毕业证)多伦多大学毕业证成绩单如何办理
一比一原版(UofT毕业证)多伦多大学毕业证成绩单如何办理
 
weather web application report.pdf
weather web application report.pdfweather web application report.pdf
weather web application report.pdf
 
Sachpazis:Terzaghi Bearing Capacity Estimation in simple terms with Calculati...
Sachpazis:Terzaghi Bearing Capacity Estimation in simple terms with Calculati...Sachpazis:Terzaghi Bearing Capacity Estimation in simple terms with Calculati...
Sachpazis:Terzaghi Bearing Capacity Estimation in simple terms with Calculati...
 
Governing Equations for Fundamental Aerodynamics_Anderson2010.pdf
Governing Equations for Fundamental Aerodynamics_Anderson2010.pdfGoverning Equations for Fundamental Aerodynamics_Anderson2010.pdf
Governing Equations for Fundamental Aerodynamics_Anderson2010.pdf
 
NO1 Uk best vashikaran specialist in delhi vashikaran baba near me online vas...
NO1 Uk best vashikaran specialist in delhi vashikaran baba near me online vas...NO1 Uk best vashikaran specialist in delhi vashikaran baba near me online vas...
NO1 Uk best vashikaran specialist in delhi vashikaran baba near me online vas...
 
Nuclear Power Economics and Structuring 2024
Nuclear Power Economics and Structuring 2024Nuclear Power Economics and Structuring 2024
Nuclear Power Economics and Structuring 2024
 
Cosmetic shop management system project report.pdf
Cosmetic shop management system project report.pdfCosmetic shop management system project report.pdf
Cosmetic shop management system project report.pdf
 
Hybrid optimization of pumped hydro system and solar- Engr. Abdul-Azeez.pdf
Hybrid optimization of pumped hydro system and solar- Engr. Abdul-Azeez.pdfHybrid optimization of pumped hydro system and solar- Engr. Abdul-Azeez.pdf
Hybrid optimization of pumped hydro system and solar- Engr. Abdul-Azeez.pdf
 
AP LAB PPT.pdf ap lab ppt no title specific
AP LAB PPT.pdf ap lab ppt no title specificAP LAB PPT.pdf ap lab ppt no title specific
AP LAB PPT.pdf ap lab ppt no title specific
 
block diagram and signal flow graph representation
block diagram and signal flow graph representationblock diagram and signal flow graph representation
block diagram and signal flow graph representation
 
J.Yang, ICLR 2024, MLILAB, KAIST AI.pdf
J.Yang,  ICLR 2024, MLILAB, KAIST AI.pdfJ.Yang,  ICLR 2024, MLILAB, KAIST AI.pdf
J.Yang, ICLR 2024, MLILAB, KAIST AI.pdf
 
ML for identifying fraud using open blockchain data.pptx
ML for identifying fraud using open blockchain data.pptxML for identifying fraud using open blockchain data.pptx
ML for identifying fraud using open blockchain data.pptx
 
RAT: Retrieval Augmented Thoughts Elicit Context-Aware Reasoning in Long-Hori...
RAT: Retrieval Augmented Thoughts Elicit Context-Aware Reasoning in Long-Hori...RAT: Retrieval Augmented Thoughts Elicit Context-Aware Reasoning in Long-Hori...
RAT: Retrieval Augmented Thoughts Elicit Context-Aware Reasoning in Long-Hori...
 

BTC 810 Analysis of Transcriptomes.pptx

  • 2. TRANSCRIPTOME: A BRIEF HISTORY  Transcriptomics is the study of RNA, single-stranded nucleic acid, which was not separated from the DNA world until the central dogma was formulated by Francis Crick in 1958, i.e., the idea that genetic information is transcribed from DNA to RNA and then translated from RNA into protein.  In 1961, Jacob and Monod proposed a model that the protein-coding gene is transcribed into a special short-lived intermediate associated with the ribosome, which was designated as messenger RNA(mRNA).  A short, stable RNA, transfer RNA (tRNA), was identified as the predicted “adaptor”.  Shortly, ribosomal RNA (rRNA) involved in protein synthesis was purified.  During RNA splicing, the introns are cut out from the primary transcripts and degraded, while the exons are reassembled into different mature messenger RNAs (mRNAs) (alternative splicing).
  • 3.  The discovery of the split gene was a complete surprise and had revolutionized our understanding of the architecture of genes.  Since the late 1970s, Altman and Cech revealed respectively that RNA can function as a catalyst. In 1982, Kruger put forward the “ribozyme” concept, demonstrating that RNA could act as both genetic material (like DNA) and a biological catalyst (like protein enzymes).  In the early 1990s, it was observed by a number of scientists independently that RNA inhibited gene expression in plants and fungi with unknown mechanism. In 1998, Fire and Mello found that double-stranded RNAs (dsRNAs) could recognize specific mRNA sequence and then led to the degradation of the target mRNAs, which was known as RNAinterference (RNAi).
  • 4.  Further studies indicated that the actual molecules that directly caused RNAi were short dsRNA fragments of 21–25 base pair, called small interfering RNA (siRNA).  In 1977, Sharp and Roberts showed that the mRNA sequence of adenovirus displayed discontinuous distribution in the genome, and therefore first suggested that a typical eukaryotic gene consists of exons, the protein- coding sequence, and introns, the non-coding sequence; the protein-coding sequence was interrupted by the non-coding sequence.
  • 5. TRANSCRIPTOME  Transcriptome is the whole set of RNAs transcribed by the genome from a specific tissue or cell type at a developmental stage and/or under a certain physiological condition.  After the genome has been sequenced, transcriptome analysis allows us to understand the expression of genome at the transcription level, which provides information on gene structure, regulation of gene expression, gene product function, and genome dynamics.
  • 9. OL TYPE OF RNA AND THEIR The central dogma of molecular biology explains that DNA codes for RNA R , whichE codes for proteins. In The Central Dogma, we can learn about the important roles of messenger RNA, transfer RNA and ribosomal RNA in the protein-building process. But RNA does more than just build proteins. RNA has many jobs in the cell, including jobs that have been traditionally associated with DNAand proteins.
  • 10. POSITIONAL INFORMATION INTEGRATION ON THE TRANSCRIPTOME  The recent explosion of high-throughput sequencing methods applied to RNA molecules is allowing us to go beyond the description of sequence variants and their relative abundances, as measured by RNA- seq.  One can now probe for RNA engagement in polysomes, for ribosomes, RNA binding proteins and microRNAs binding sites, for RNA secondary structure and for RNA methylation.  These descriptors produce a steadily growing multidimensional array of positional information on RNA sequences, whose effective integration only would bring to decipher the regulatory interplay occurring between proteins, RNAs and their modifications on the transcriptome.  This interplay ultimately dictates the degree of mRNA availability to translation, and thus the occurrence of cell phenotypes.
  • 11. NORTHERN BLOTTING  The northern blot is a technique used in molecular biology research to study gene expression by detection of RNA (or isolated mRNA) in a sample.  The quantity of mRNA transcript for a single gene directly reflects how much transcription of that gene has occurred.  Tracking of that quantity will therefore indicate how vigorously a gene is transcribed, or expressed.  To visualize differences in the quantity of mRNA produced by different groups of cells or at different times, researchers often use the method known as a Northern blot.  For this method, researchers must first isolate mRNA from a biological sample by exposing the cells within it to a protease, which is an enzyme that breaks down cell membranes and releases the genetic material in the cells.  Next, the mRNA is separated from the DNA, proteins, lipids, and other cellular contents.
  • 12. NORTHERN BLOTTING  The different fragments of mRNA are then separated from one another via gel electrophoresis (a technique that separates molecules by passing an electrical current through a gel medium containing the molecules) and transferred to a filter or other solid support using a technique known as blotting.  To identify the mRNA transcripts produced by a particular gene, the researchers next incubate the sample with a short piece of single-stranded RNA or DNA (also known as a probe) that is labeled with a radioactive molecule.  Designed to be complementary to mRNA from the gene of interest, the probe will bind to this sequence.  Later, when the filter is placed against X-ray film, the radioactivity in the probe will expose the film, thereby making marks on it.  The intensity of the resulting marks, called bands, tells researchers how much mRNA was in the sample, which is a direct indicator of how strongly the gene of
  • 13.
  • 14. DRAW BACK AND MODIFICATION  Until recently, scientists studied gene expression by looking at only one or very few gene transcripts at a time.  Thankfully, new techniques now make large-scale studies of gene expression possible.  One such technique is SAGE (serial analysis of gene expression). A method for measuring the expression patterns of many genes at once, SAGE not only allows scientists to analyze thousands of gene transcripts simultaneously, but it also enables them to determine which genes are active in different tissues or at different stages of cellular development.  Serial analysis of gene expression (SAGE) is a powerful tool that allows the analysis of overall gene expression patterns with digital analysis. Because SAGE does not require a preexisting clone, it can be used to identify and quantitate new genes as well as known genes.
  • 15. SAGE  SAGE invented at Johns Hopkins University in USA(Oncology Center) by Dr. Victor Velculescu in 1995.  Serial analysis of gene expression (SAGE) is an approach that allows rapid and detailed analysis of overall gene expression patterns.  SAGE identifies and counts the mRNA transcripts in a cell with the help of short snippets of the genetic code, called tags.  In most cases, each tag contains enough information to uniquely identify a transcript.  The name "serial analysis" refers to the fact that tags are read sequentially as a continuous string of information.  SAGE provides quantitative and comprehensive expression profiling in a given cell population.  The basic steps of the SAGE technique are:
  • 16. THE BASIC STEPS OF THE SAGE TECHNIQUE ARE OUTLINED BELOW Capturing mRNA Rewriting mRNAinto cDNA Cutting tags from each cDNA Linking tags together in chains for sequencing Copying and reading the chains Identifying and counting the tags
  • 17. SAGE FLOWCHART… 17 1. Isolate mRNA. 2. (a)Add biotin-labeled dT primer: (b) Synthesize ds cDNA. 3. (a) Bind to streptavidin-coated beads. (b) Cleave with “anchoring enzyme”. B B B
  • 18. (c) Discard loose fragments. 18 4. (a) Divide into two pools and add linker sequences (b) Ligate. B
  • 19. 5. Cleave with “tagging enzyme” 19 6. Combine pools and ligate. 7. Amplify ditags, then cleave with anchoring enzyme. B
  • 20. 8. Ligate ditags. 9. Sequence and record the tags and frequencies. 20
  • 21. SAGE IN DETAILS… Trapping of RNAwith beads  mRNA’s end with a long string of “A” (Adenine)  Molecules that consist of 20 or so dT’s acts like a attractant to capture mRNAs.  Coating of microscopic magnetic beads with “TTTTT” tails is done.  A magnet is used to withdraw the bead and the mRNA is isolated. 21
  • 24. cDNA synthesis  ds cDNA is synthesized from the extracted mRNA by means of biotinylated oligo (dT) primer.  cDNA synthesis is immobilized to streptavidin beads. 24
  • 25. 25 B B B B B Biotinylated oligo dT (primers) B B Streptavidin beads B B B
  • 26. Enzymatic cleavage of cDNA  The cDNA molecule is cleaved with a restriction enzyme.  Type II restriction enzyme used (E.g. NlaIII.)  Average length of cDNA – 256bp with sticky ends created. 26
  • 28. Ligation of Linkers to bound cDNA  Captured cDNA are then ligated to linkers at their ends.  Linkers must contain:  NlaIII 4-nucleotide cohesive overhang.  Type IIs recognition sequence.  PCR primer sequence. 28
  • 30. Cleaving with tagging enzyme  Tagging enzyme, (usually BsmF1) cleave DNA, releasing the linker-adapted SAGE tag from each cDNA.  Repair of ends to make blunt ended tags using DNA polymerase (Klenow fragments) and dNTPs. 30
  • 32. Formation of Ditags  The left thing is the collection of short tags taken from each molecule.  Two groups of cDNAs are ligated to each other, to create a “ditag” with linkers on either end.  Two tags are linked together using T4 DNA ligase. 32
  • 33. 33
  • 34. PCR amplification of Ditags  The linker-ditag-linker constructs are amplified by PCR using primers specific to the linkers. 34
  • 36. Isolation of Ditags  The cDNAis again digested by theAnchoring enzyme (AE)  Breaking the linker off right where it was added in beginning.  This leaves a “sticky” end with the sequence GTAC (or CAGT on the other strand) at each end of the ditag. 36
  • 38. Concatamerization of Ditags  Tags are combined into much longer molecules, called concatamers.  Each ditag is having an AE site, allowing the scientist and the computer to recognize where one ends and the next begins. 38
  • 40. Cloning Concatamers and Sequencing…  40Lots of copies are required – so the concatamers are inserted into bacteria, which act like living “copy machines” to create millions of copies from original.  Copies are then sequenced, using machines that can read the nucleotides in DNA. The result is a long list of nucleotides that has to be analyzed by computer.  Analysis will do several things: count the tags, determine which one come from the same RNA molecule, and figure out which ones come from known, well studied genes and which ones are new. Vast amount of data is produced, which must be shifted and ordered for useful information to become apparent. SAGE reference databases:  SAGE map SAGE Genie http://www.ncbi.nlm.nih.gov/cgap
  • 41. HOW DOES THE DATA LOOK LIKE? 41
  • 42. 42 From Tags to Genes…  Collect sequence records from GenBank.  Assign sequence orientation (by finding poly-A tail)  Assign UniGene identifier to each sequence with a SAGE tag.  Record (for each tag-gene pair)  Advantages:  mRNA sequence does not need to be known prior, so genes of variants which are not known can be discovered.  Its more accurate as it involves direct counting of the number of transcripts.
  • 43. Problems Length of gene tag is extremely short (13 or 14bp), so if the tag is derived from an unknown gene, it is difficult to analyze with such a short sequence.  Type II restriction enzyme does not yield same length fragments.  mRNA levels and protein expression do not are always correlate. Need of SAGE  Sometimes, when analyzing SAGE data, computers cannot find matches for certain tags in their sequence databases that means a lack of matches indicates that the mRNA used to produce these tags is associated with genes that have not been studied before.  In this way, SAGE has been used to discover new genes involved in a variety of diseases. 43  Compared to other techniques for measuring gene expression, SAGE offers a significant advantage because it measures the expression of both known and unknown genes.
  • 44. RNA-SEQ/ NGS (RNASeq) is revolutionizing the study of the  RNA sequencing transcriptome.  It is providing visibility to previously undetected changes occurring in disease states, in response to therapeutics, under different environmental conditions and across a broad range of other study designs.  Compared with Sanger sequencing, the core of NGS is massive parallel sequencing.  Development of nanotechnology makes it possible to sequence hundreds of thousands of DNA molecules simultaneously.  The prototype of NGS is massive parallel signature sequencing (MPSS), which applies four rounds of restriction enzyme digestion and ligation reactions to determine the nucleotide sequence of cDNA ends generating a 17–20 bp sequence as the fingerprint of a corresponding RNA.  MPSS is used to digitize the quantitative transcriptome with the capacity to produce more than 100000 signatures at a time.
  • 45.  However, due to the nature of digestion and ligation reactions, a large fraction of the sequence signatures obtained is not long enough to be unique fingerprints of RNAmolecules.  Overcoming the limits of MPSS, Illumina, Roche, Lifescientific, and other companies developed their own platforms with considerable improvement on the throughput, reading length, and sequencing accuracy. Based on these platforms, the RNA-seq methodology became the most convenient and cost effective tool for transcriptome analysis.  RNASeq allows researchers to detect both known and novel features in a single assay, enabling the detection of transcript isoforms, gene fusions, single nucleotide variants, allele specific gene expression and other features without the limitation of prior knowledge.  High throughput sequencing also called Next Generation Sequencing (NGS) have the capacity to sequence full genomes. Bacteriophage fX174, was the first genome to be sequenced, a viral genome with only 5,368 base pairs (bp).
  • 46. RNA-Seq or Transcriptome Sequencing Sequencing technologies applicable to RNA-Seq High throughput • Illumina HiSeq 2500 • Illumina Next-Seq 500 • Illumina MiSeq • Illumina X Ten “Lower” throughput • Roche 454 Low throughput • Sanger Illumina…
  • 47. Martin J.A. and Wang Z., Nat. Rev. Genet. (2011) 12:671–682 From RNA -> sequence data
  • 48. Martin J.A. and Wang Z., Nat. Rev. Genet. (2011) 12:671–682 From RNA -> sequence data Ready for sequencing
  • 49. DNA (0.1-5.0 μg) Library Preparation 1 2 3 9 4 5 6 T G T A C G A T … ILLUMINA SEQUENCING TECHNOLOGY WORKFLOW C C C A A A T T G G G G Sequencing Single molecule array Cluster Growth 7 8 Image Acquisition Base Calling 5’ 3’ 5’ T G T A C G A T C A C C C G A T C G A A 49 Alvaro Hernandez
  • 50. Martin J.A. and Wang Z., Nat. Rev. Genet. (2011) 12:671–682 From RNA -> sequence data
  • 51. Other Technologies to Study Expression 1. Expressed Sequence Tags (ESTs) 2. RT-PCR 3. DNA Microarray’s 4. Bioinformatics
  • 52. EST AND MICROARRAY  Sanger sequencing of EST or cDNA library provided information for genome annotation in the early days of genome research.  Due to the limitations on throughput and cost, it is impossible to achieve transcriptome quantitative analysis using EST methods.  With serial analysis of gene expression (SAGE) and CAGE, respectively, multiple 3′ and 5′ cDNA ends were concatenated to be one clone.  Therefore, multiple sequence tags can be recovered from one Sanger sequencing reaction, which overcomes those limits and makes quantitative analysis possible.  However, due to the high cost of Sanger sequencing and the difficulty to map the short sequence (~20 bp) tags to genome, CAGE and SAGE were replaced by DNAmicroarray shortly. • Short, annotated sequences at 3’or 5’end • Can be used to determine the number of genes/genome
  • 53. DNA MICROARRAYS  DNA microarray or chip method is based on nucleic acid hybridization.  Fluorescent labeled cDNAs incubate with oligonucleotide probes on the chip, then the abundance of RNA is determined by measuring fluorescence density.  High-density gene chip allowed relatively low cost gene expression profiling.  Specific microarrays were designed according to the purpose of the experiment, such as arrays to detect different isoforms from alternative splicing.  In addition, the genome tiling array is an unbiased design, without prior knowledge of genome transcription information, using a set of overlapping oligonucleotide probes for the detection of whole genome expression with the resolution up to a few nucleotides.  However, for large genomes, tiling array is expensive. Another limiting factor of hybridization methodology is high background, because it is unable to distinguish RNA molecules sharing high sequence similarity. • High-throughput • Allows for simultaneous detection of genome-wide expression • Can provide relative quantitative information about expression…
  • 55. QRT-PCR •Can be used to both detect & quantify gene expression • Not high-throughput • Can only be used on a limited scale
  • 56. BIOINFORMATICS ANALYSIS Data alignment We need to align the sequence data to our genome of interest  If aligning RNA-Seq data to the genome, always pick a slice-aware aligner TopHat2, MapSplice, SOAPSplice, Passion, SpliceMap, RUM, ABMapper, CRAC, GSNAP, HMMSplicer, Olego, BLAT  There are excellent aligners available that are not splice-aware. These are useful for aligning directly to an already available transcriptome (gene models, so you are not worrying about introns). However, be aware that you will lose isoform information. Bowtie2, BWA, Novoalign (not free), SOAPaligner Sequence formats • FASTA • FASTQ Alignment formats • SAM/BAM Feature formats • GFF (– Gene feature format) • GTF(Gene transfer format) File formats A brief note
  • 57. STATUS OF TRANSCRIPTOME ANALYSIS IN INDIA  Plant Biotechnology Division, CSIR- Indian Institute of Integrative Medicine, Sanat Nagar, Srinagar, J&K, India.  Academy of Science and Innovative Research (AcSIR),Anusandhan Bhawan, New Delhi, India.  Division of Biotechnology, CSIR- Institute of Himalayan Bioresource Technology, Palampur, India  School of Biotechnology, University of Jammu, Jammu, Jammu & Kashmir, India,  National Institute of Plant Genome Research (NIPGR), ArunaAsafAli Marg, New Delhi, India
  • 58. APPLICATION  Transcriptome analysis will further reveal the regulation network of biological processes and eventually give some guidance in disease diagnosis and crop improvement.  RNA-Seq is a powerful approach that enables researchers to discover, profile and quantify RNA transcripts in the whole transcriptome. As this method does not use predesigned probes or primers, it becomes an unbiased hypothesis free approach providing researchers with applications that are not possible by traditional microarray based methods.  RNASEQUENCING IS USED WIDELY FOR:  Studies of gene expression and discovery of novel transcripts and isoforms  SNPdiscovery in the coding portions of the genome  Denovo transcriptome assembly  Basis for expression quantification in RNA-Seq
  • 59. CONCLUSION To analyze differences between gene expression patterns of cancer cells and their normal counter parts. Examining which transcripts are present in a cell. Allows rapid, detailed analysis of thousands of transcripts in a cell. By comparing different types of cells, generate profiles that will help to understand healthy cells and what goes wrong in diseases. By comparing different types of cells, generate profiles that will help to understand healthy cells and what goes wrong in diseases. To identify downstream targets of oncogenes and tumor suppresser genes. Studied the tumors of pancreatic and colon tumors. Zhang et al.(1997)Science, 276(5316), 1268-1272. 59