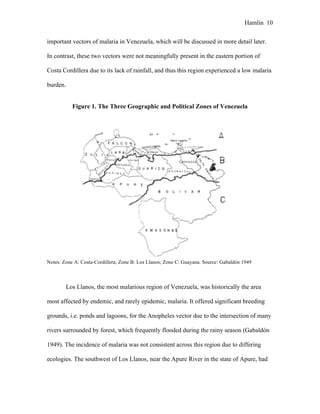
Download to read offline

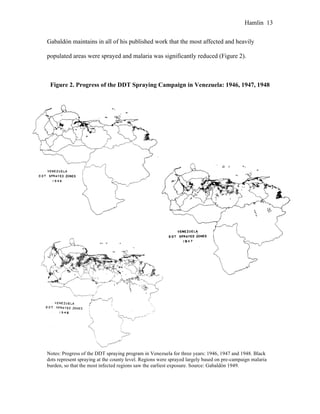
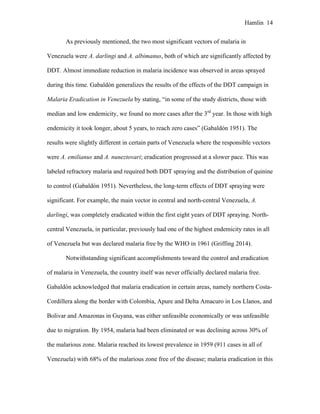
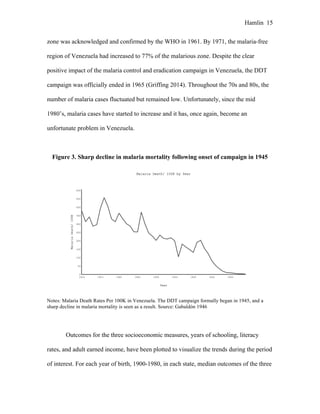
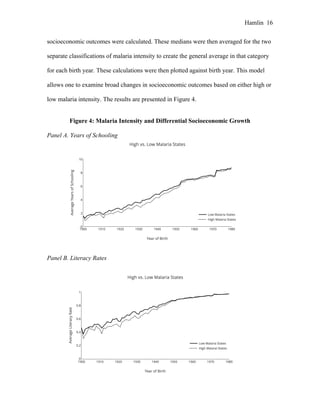
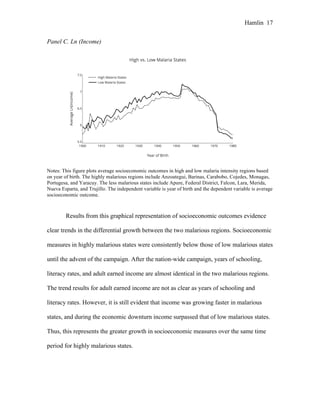

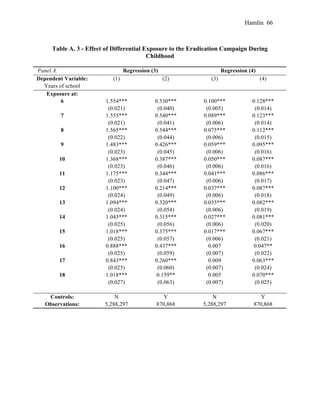
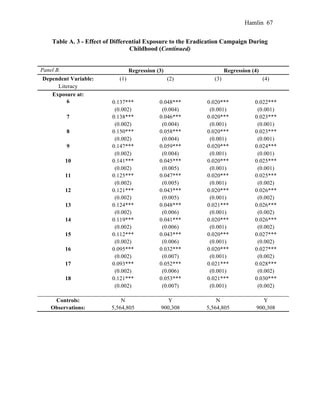
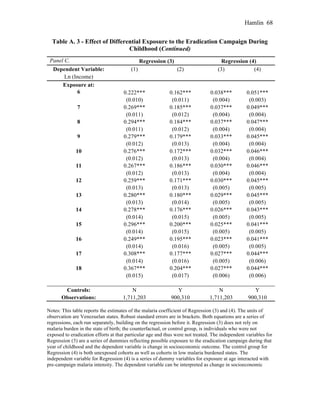


This document summarizes a thesis paper examining the socioeconomic impact of malaria control and eradication in Venezuela. It provides background on the malaria situation in Venezuela prior to a DDT campaign launched in 1945. Venezuela had the highest malaria mortality rate in Latin America before extensive control efforts. The campaign introduced DDT over four years between 1945-1948, varying by region. Exposure to the campaign during childhood is used to classify cohorts and analyze the impact on educational and economic outcomes like years of schooling, literacy rates, and income. Results found exposure in childhood led to better outcomes, indicating malaria negatively impacts development.


