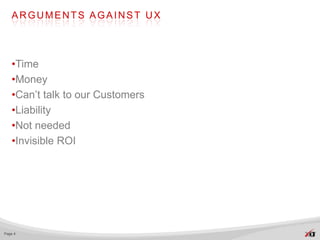
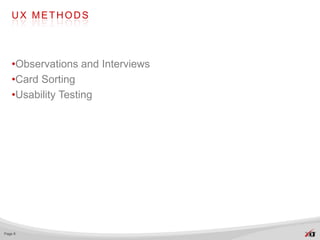
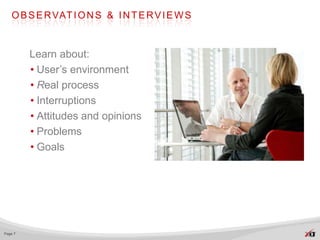
CodeMash 2012
                                                 January 13, 2012


SELLING

    
                                     BRING THE USERS:
 I N T E G R AT I N G U X I N T O Y O U R O R G A N I Z AT I O N


                      PRESENTED BY CAROL SMITH
                                   @CAROLOGIC
I N T E G R AT I N G U X


   1. Start Now!
   2. Show Off & Sell UX
   3. Create Evangelists


Page 2
Why not do UX?
ARGUMENTS AGAINST UX


   •Time
   •Money
   •Can’t talk to our Customers
   •Liability
   •Not needed
   •Invisible ROI


Page 4
Start Now!
UX METHODS


   •Observations and Interviews
   •Card Sorting
   •Usability Testing


Page 6
O B S E R VAT I O N S & I N T E R V I E W S


         Learn about:
         • User’s environment
         • Real process
         • Interruptions
         • Attitudes and opinions
         • Problems
         • Goals


Page 7
Artifacts!
         Collect, Copy, Photograph
Page 8    http://www.flickr.com/photos/heygabe/ via http://creativecommons.org/licenses/by-nc-sa/2.0/
          Actual Photo: http://www.flickr.com/photos/heygabe/47206241/
CARD SORTING


         Use to determine:
          • Order of information
          • Relationships
          • Labels for navigation
          • Verify correct audience


Page 9
             http://www.flickr.com/photos/rosenfeldmedia/ via http://creativecommons.org/licenses/by-nc-sa/2.0/
USABILITY TESTING


      •Real users doing real tasks
      •Using prototypes or live
      products
      •Not guided, but observed


                 http://creativecommons.org/licenses/by-sa/2.0/
                 http://www.flickr.com/photos/raphaelquinet/513351385/sizes/l/in/photostream/
Page 10
                 http://www.flickr.com/photos/raphaelquinet/
CONGRATULATIONS!!


                http://www.flickr.com/photos/13010608@N02/
                http://www.flickr.com/photos/13010608@N02/2441933336/sizes/z/in/photostream
Page 11
                http://creativecommons.org/licenses/by-nc/2.0/
Show Off & Sell UX
SHARE WHAT YOU LEARN


             http://creativecommons.org/licenses/by-sa/2.0/ http://www.flickr.com/photos/garryknight/
Page 13
             http://www.flickr.com/photos/garryknight/5542172347/sizes/l/in/photostream/
I N F O R M AT I O N R A D I AT O R S


   •Represent research
   •Facilitate:
     • communication
     • decision-making
   •Guide decisions about:
     • Navigation
     • Features
     • Design


Page 14
Sam Peterson
Editor, Math Specialist, 5 Years Experience


Technology                                       Goal
• Does personal banking, shopping                • Improve the educational system by
   and email online                                 making great courses for teachers and
                                                    students

Concerns                                         Responsibilities
• Needs a good tool for tracking all of the      • Manages many different projects at once
   assets for each of his projects               • Manages a great group of freelancers
• Too much time is spent fixing previous            allowing him to focus on other things
   projects instead of working on current ones   • Keeps track of many separate assets for
• Resigned to having to go back and forth           each project
   with the publisher a few times to get         • Checks work before passing it on to the
   everything just right                            publisher


Sam   is 29 years old and lives in New Albany, OH.                                          “I need help
He has a BS in Mathematics from Ohio State University where he also took                    keeping track of
 organizational psychology courses and found that he enjoyed management                      all of the assets
 challenges.                                                                                 for each of my
He has never been interested in teaching, but wants to improve the educational              projects.”
 system. When he saw a job opening at an educational company he felt that it would
 be a great opportunity to do just that.
Sam says despite the frustrations, his company is great to work for and the benefits
 can’t be beat.
He isn’t sure what is next for his career - he has taken some training that has been
 offered but is not currently interested in taking on new responsibilities.
GOALS OF SHARING


   •You learned something!
   •Help the team:
     • understand user’s point of view
     • prioritize content and solutions
     • design for user’s needs and behaviors
     • identify new opportunities
     • create new solutions


Page 16
SKEPTICS MIGHT ASK


          http://www.flickr.com/photos/cuppini/3211910657/sizes/o/in/photostream/
          http://www.flickr.com/photos/cuppini/
Page 17
          http://creativecommons.org/licenses/by-nc-nd/2.0/
OUR DESIGN HAS WON AWARDS,
          WHY WOULD WE WANT TO CHANGE IT?


Page 18
WHY CHANGE?


   •Visual appearance is important
   •Must also be usable
   •Even the best visual design won’t succeed if:
     • Users can’t use it
     • Doesn’t help complete their tasks in a timely and efficient
       manner


Page 19
More than 83% of Internet
users are likely to leave
a Web site if…
too many clicks to find
what they’re looking for.

- Arthur Andersen, 2001


   Bias, Randolph, G. and Deborah J. Mayhew. Cost-Justifying Usability: An Update for the Internet Age. 2005.
SAME AS A FOCUS GROUP?

      Focus Group                      Usability Studies
      • Recall what they did           • Observe actual process, step
        (may leave out steps             by step, including successes
        or miss-remember)                and difficulties
      • Louder individuals and/or      • Equity among participants
        strong opinions in a session   • Finds patterns of behavior
        can skew results
      • Finds preferences of
        users, likes and dislikes


Page 21
RETURN ON INVESTMENT (ROI)


   •Usability techniques allowed a high-tech company
   to reduce the time spent on one tedious development
   task by 40%.
   (Bias & Mayhew, 1994)

   •Cost-benefit ratio for usability is $1 : $10-$100
   (Gilb, 1988)

   •Small increments of time, counted over hundreds of
   employees, can result in huge savings.


          http://www.upassoc.org/usability_resources/usability_in_the_real_world/roi_of_usability.html
Page 22
          Bias, Randolph, G. and Deborah J. Mayhew. Cost-Justifying Usability: An Update for the Internet Age. 2005.
Once a system is in development,
correcting a problem
costs 10 times as much
as fixing the same problem in design.

If the system had been released,
it costs 100 times as much
relative to fixing in design.

                   - Gilb, 1988


  Bias, Randolph, G. and Deborah J. Mayhew. Cost-Justifying Usability: An Update for the Internet Age. 2005.
“If you dedicate at least 10
percent of your project budget to
usability activities, you will see an
average of 135 percent
improvement in usability"

- Jakob Nielsen, principal, Nielsen
Norman Group, 2003


http://www.allbusiness.com/company-activities-management/financial/5670570-1.html All Business. Dated:Jan. 8, 2003
ROI (CONTINUED)


   Small things can make a big difference

   • $300,000,000 Button


   • Can’t provide right recommendations without observing
      and talking with the customers


                       Spool, Jared. The $300 Million Button. January 14, 2009.
Page 25
                       http://www.uie.com/articles/three_hund_million_button/   Button: BD Create
WE KNOW IT’S DIFFICULT,
           WE HAVE A TRAINING PROGRAM!


          http://www.flickr.com/photos/kaptainkobold/5181464194/sizes/o/in/photostream/
Page 26
          http://www.flickr.com/photos/kaptainkobold/
TRAINING


   •Costs additional time and money
   •Usually less costly to find and correct issues in design than
   to provide training to work around the problem


Page 27
TRAINING


   •How much is their time worth?
     • 1 Hour of training?
     • 1 Day of training?
     • 1 Week of training?
   •Company was able to eliminate training and save $140,000
   •AT&T saved $2,500,000 in training expenses


          Bias & Mayhew, 1994
Page 28
          http://www.upassoc.org/usability_resources/usability_in_the_real_world/roi_of_usability.html
We have a survey set up

We are getting data from it

Why would we need anything
more?
SURVEYS


   •Survey questions are an art-form
   •Words can have multiple meanings and un-intended
   meanings
   •Self reporting cannot be trusted
   •People “save face”
     • Not that bad, my fault
     • I’m sure that’s great too


Page 30
HOW ABOUT OUR EMPLOYEES?


   •Easy to test people within this company
   •Not the way to get good results
   •Too close to the project
     • Know things others wouldn’t about product
   •Concerns about ego, job, co-workers, etc.
   •Not the intended user!


Page 31
Don’t we need to test
100s of users to get real
results?
N U M B E R O F PA R T I C I PA N T S


   Studies have shown
   that testing 5
   representative users
   of each user type
   will reveal ~80% of
   usability issues.


               http://www.useit.com/alertbox/20000319.html
Page 33
               Jakob Nielsen’s Alertbox. Why You Only Need to Test with 5 Users. March 19, 2000.
L O O K F O R PAT T E R N S


      • Statistical significance is not
         feasible
      • ROI would diminish entirely
      • Identify repetition
      • After pattern is
         found,       continuation of
         study:
        • Adds cost
        • Delays reporting
        • Low probability of many
          new findings


Page 34
CONTROVERSY OF 5 USERS


   •Not enough to uncover 80% of issues.
   •Spool and Schroeder in 2001 found that only 35%
   of usability issues were uncovered with 5 participants
     • Not enough to take into account individual differences
     • Scope of the website being evaluated was very large
       even though the task was well defined


Page 35         Albert, Bill and Tom Tullis. Measuring the User Experience. 2008. pg. 119
W H AT T H I S M E A N S


   •Very specific user group - 5 works
     • Must know your user and recruit carefully
   •Less well defined groups require more users
   (8-15 or more)
   •Budget for 15, do three tests with 5 users
     • Catch mistakes early and often
     • Redesign using what you’ve learned


Page 36
D O E S N O T M E A N T H AT …


   •Testing five users is always enough
   •Can test anyone and have the same results
   •Smaller groups equate better findings


Page 37
N U M B E R O F PA R T I C I PA N T S D E P E N D S O N
   PURPOSE

          Main Purpose                        Explanation                                                    # of
                                                                                                             Participants
          Convincing skeptics                 Demonstrate that serious usability                                               3
                                              problems exist in their product and
                                              effectiveness of usability testing.
          Find serious problems               Drive a useful iterative cycle: Find                                           9-12
                                              serious problems, correct them, find
                                              more serious problems.
          Find all serious                    Find all serious usability problems                                  Unknown
          problems
          Find all problems                   Find all usability problems                                          Unknown
          Measure Usability                   Measure key usability parameters,                                              >20
                                              (time to complete key tasks, user
                                              satisfaction, etc.)


             Adapted from: Molich, Rolf. A Critique of “How to Specify the Participant Group Size for Usability Studies: A
Page 38
             Practitioner’s Guide” by Macefield. Journal of Usability Studies. Vol. 5, Issue 3, May 2010. pg. 124-128.
IF TEST QUALITY IS POOR, GROUP SIZE
   D O E S N ’ T M AT T E R


   •Uneven or poor facilitation
   •Invalid test tasks
   •Poor use of the "think aloud" methodology


   •"Results of usability tests depend considerably on the
   evaluator"
         - Jacobsen and Hertzum, 2001


          Molich, Rolf. A Critique of “How to Specify the Participant Group Size for Usability Studies: A Practitioner’s Guide”
Page 39
          by Macefield. Journal of Usability Studies. Vol. 5, Issue 3, May 2010. pg. 124-128.
1 0 WAY S T O P R O M O T E U X


   1. Invite everyone to observe via remote observation
   2. Schedule testing at a regular time
   3. Promote availability of testing internally (Yammer)
   4. Network within organization and share what you do
   5. Hold Brownbag sessions
   6. Invite staff to local UX events
   7. Share recommendations and successes widely
   8. Post information radiators in shared locations
   9. Hold a World Usability Day Event
   10. Invite everyone to observe UX sessions in-person

Page 40
Create Evangelists
WHO IS ALREADY THERE?


   •Pay attention to who approaches you.
   •Look for your comrades
   •May not be in your area of the organization
   •Make time to chat with them
     • Share recent articles about UX
     • Invite to a UX event locally
     • Invite to join LinkedIn or other groups online


Page 42
C R E AT E N E W E VA N G E L I S T S


   •Use promotions to find new evangelists
   •Remind everyone of successes
   •Provide templates for planning that include UX activities
   •Provide highlights and/or reports that will help them sell UX


Page 43
B U I L D U X I N T H E O R G A N I Z AT I O N


   •Find a C-level person who could be a supporter
     • Get their support for a small study
     • Invite them to sessions
     • Make sure they see benefits gained
     • Remind them of this next time
   •Build department from within


Page 44
U N D E R S TA N D U X


   •Help everyone understand shared goals:
     • Increase sales
     • Save time and money
     • Create happy customers


Page 45
B E N E F I T T O C O M PA N I E S


   •Sell more product and discover unmet needs
   •Enhance company’s reputation
   •Save money on internal products
   •Reduce:
     • Support costs
     • Training costs
     • Need for updates and maintenance releases
   •Make documentation and training easier to develop


Page 46
            From A Practical Guide to Usability Testing by Joseph Dumas and Janice Redish, 1999. Page 18.
WHY YOU SHOULD CARE


   “Customers are the only stakeholders who are not
   represented in design meetings.

   If it hurts users and will cause customers to leave? Silence.

   Unless you speak up. So do it.”

                                                             -Jakob Nielsen


                Usability Evangelism: Beneficial or Land Grab? By Jakob Nielsen, Ph.D
Page 47
                http://www.developer.nokia.com/Design/Usability_evangelism.xhtml
Who Benefits from UX?
EVERYONE!


          http://www.flickr.com/photos/jamescridland/
          http://creativecommons.org/licenses/by/2.0/
Page 49
          http://www.flickr.com/photos/jamescridland/613445810/sizes/l/in/photostream/
RECOMMENDED READINGS


Page 50
                          5
C O N TA C T C A R O L


          @carologic

   Email: Carol.Smith@perficient.com

                  slideshare.net/carologic
                  and
                  slideshare.net/PerficientInc


   speakerrate.com/speakers/15585-caroljsmith

Page 51
REFERENCES


   •Cost-Justifying Usability: An Update for the Internet Age, Randolph G. Bias and
   Deborah J. Mayhew
   •The $300 Million Button by Jared Spool
   •Jakob Nielsen’s Alertbox. Why You Only Need to Test with 5 Users. March
   19, 2000.
   •Measuring the User Experience by Bill Albert and Tom Tullis
   •Usability Evangelism: Beneficial or Land Grab? by Jakob Nielsen, Ph.D
   •http://www.upassoc.org/usability_resources/usability_in_the_real_world/roi_of_
   usability.html
   •Molich, Rolf. A Critique of “How to Specify the Participant Group Size for
   Usability Studies: A Practitioner’s Guide” by Macefield. Journal of Usability
   Studies. Vol. 5, Issue 3, May 2010. pg. 124-128.


Page 52

Selling UX at CodeMash 2012

  • 1.
    CodeMash 2012 January 13, 2012 SELLING  BRING THE USERS: I N T E G R AT I N G U X I N T O Y O U R O R G A N I Z AT I O N PRESENTED BY CAROL SMITH @CAROLOGIC
  • 2.
    I N TE G R AT I N G U X 1. Start Now! 2. Show Off & Sell UX 3. Create Evangelists Page 2
  • 3.
  • 4.
    ARGUMENTS AGAINST UX •Time •Money •Can’t talk to our Customers •Liability •Not needed •Invisible ROI Page 4
  • 5.
  • 6.
    UX METHODS •Observations and Interviews •Card Sorting •Usability Testing Page 6
  • 7.
    O B SE R VAT I O N S & I N T E R V I E W S Learn about: • User’s environment • Real process • Interruptions • Attitudes and opinions • Problems • Goals Page 7
  • 8.
    Artifacts! Collect, Copy, Photograph Page 8 http://www.flickr.com/photos/heygabe/ via http://creativecommons.org/licenses/by-nc-sa/2.0/ Actual Photo: http://www.flickr.com/photos/heygabe/47206241/
  • 9.
    CARD SORTING Use to determine: • Order of information • Relationships • Labels for navigation • Verify correct audience Page 9 http://www.flickr.com/photos/rosenfeldmedia/ via http://creativecommons.org/licenses/by-nc-sa/2.0/
  • 10.
    USABILITY TESTING •Real users doing real tasks •Using prototypes or live products •Not guided, but observed http://creativecommons.org/licenses/by-sa/2.0/ http://www.flickr.com/photos/raphaelquinet/513351385/sizes/l/in/photostream/ Page 10 http://www.flickr.com/photos/raphaelquinet/
  • 11.
    CONGRATULATIONS!! http://www.flickr.com/photos/13010608@N02/ http://www.flickr.com/photos/13010608@N02/2441933336/sizes/z/in/photostream Page 11 http://creativecommons.org/licenses/by-nc/2.0/
  • 12.
    Show Off &Sell UX
  • 13.
    SHARE WHAT YOULEARN http://creativecommons.org/licenses/by-sa/2.0/ http://www.flickr.com/photos/garryknight/ Page 13 http://www.flickr.com/photos/garryknight/5542172347/sizes/l/in/photostream/
  • 14.
    I N FO R M AT I O N R A D I AT O R S •Represent research •Facilitate: • communication • decision-making •Guide decisions about: • Navigation • Features • Design Page 14
  • 15.
    Sam Peterson Editor, MathSpecialist, 5 Years Experience Technology Goal • Does personal banking, shopping • Improve the educational system by and email online making great courses for teachers and students Concerns Responsibilities • Needs a good tool for tracking all of the • Manages many different projects at once assets for each of his projects • Manages a great group of freelancers • Too much time is spent fixing previous allowing him to focus on other things projects instead of working on current ones • Keeps track of many separate assets for • Resigned to having to go back and forth each project with the publisher a few times to get • Checks work before passing it on to the everything just right publisher Sam is 29 years old and lives in New Albany, OH. “I need help He has a BS in Mathematics from Ohio State University where he also took keeping track of organizational psychology courses and found that he enjoyed management all of the assets challenges. for each of my He has never been interested in teaching, but wants to improve the educational projects.” system. When he saw a job opening at an educational company he felt that it would be a great opportunity to do just that. Sam says despite the frustrations, his company is great to work for and the benefits can’t be beat. He isn’t sure what is next for his career - he has taken some training that has been offered but is not currently interested in taking on new responsibilities.
  • 16.
    GOALS OF SHARING •You learned something! •Help the team: • understand user’s point of view • prioritize content and solutions • design for user’s needs and behaviors • identify new opportunities • create new solutions Page 16
  • 17.
    SKEPTICS MIGHT ASK http://www.flickr.com/photos/cuppini/3211910657/sizes/o/in/photostream/ http://www.flickr.com/photos/cuppini/ Page 17 http://creativecommons.org/licenses/by-nc-nd/2.0/
  • 18.
    OUR DESIGN HASWON AWARDS, WHY WOULD WE WANT TO CHANGE IT? Page 18
  • 19.
    WHY CHANGE? •Visual appearance is important •Must also be usable •Even the best visual design won’t succeed if: • Users can’t use it • Doesn’t help complete their tasks in a timely and efficient manner Page 19
  • 20.
    More than 83%of Internet users are likely to leave a Web site if… too many clicks to find what they’re looking for. - Arthur Andersen, 2001 Bias, Randolph, G. and Deborah J. Mayhew. Cost-Justifying Usability: An Update for the Internet Age. 2005.
  • 21.
    SAME AS AFOCUS GROUP? Focus Group Usability Studies • Recall what they did • Observe actual process, step (may leave out steps by step, including successes or miss-remember) and difficulties • Louder individuals and/or • Equity among participants strong opinions in a session • Finds patterns of behavior can skew results • Finds preferences of users, likes and dislikes Page 21
  • 22.
    RETURN ON INVESTMENT(ROI) •Usability techniques allowed a high-tech company to reduce the time spent on one tedious development task by 40%. (Bias & Mayhew, 1994) •Cost-benefit ratio for usability is $1 : $10-$100 (Gilb, 1988) •Small increments of time, counted over hundreds of employees, can result in huge savings. http://www.upassoc.org/usability_resources/usability_in_the_real_world/roi_of_usability.html Page 22 Bias, Randolph, G. and Deborah J. Mayhew. Cost-Justifying Usability: An Update for the Internet Age. 2005.
  • 23.
    Once a systemis in development, correcting a problem costs 10 times as much as fixing the same problem in design. If the system had been released, it costs 100 times as much relative to fixing in design. - Gilb, 1988 Bias, Randolph, G. and Deborah J. Mayhew. Cost-Justifying Usability: An Update for the Internet Age. 2005.
  • 24.
    “If you dedicateat least 10 percent of your project budget to usability activities, you will see an average of 135 percent improvement in usability" - Jakob Nielsen, principal, Nielsen Norman Group, 2003 http://www.allbusiness.com/company-activities-management/financial/5670570-1.html All Business. Dated:Jan. 8, 2003
  • 25.
    ROI (CONTINUED) Small things can make a big difference • $300,000,000 Button • Can’t provide right recommendations without observing and talking with the customers Spool, Jared. The $300 Million Button. January 14, 2009. Page 25 http://www.uie.com/articles/three_hund_million_button/ Button: BD Create
  • 26.
    WE KNOW IT’SDIFFICULT, WE HAVE A TRAINING PROGRAM! http://www.flickr.com/photos/kaptainkobold/5181464194/sizes/o/in/photostream/ Page 26 http://www.flickr.com/photos/kaptainkobold/
  • 27.
    TRAINING •Costs additional time and money •Usually less costly to find and correct issues in design than to provide training to work around the problem Page 27
  • 28.
    TRAINING •How much is their time worth? • 1 Hour of training? • 1 Day of training? • 1 Week of training? •Company was able to eliminate training and save $140,000 •AT&T saved $2,500,000 in training expenses Bias & Mayhew, 1994 Page 28 http://www.upassoc.org/usability_resources/usability_in_the_real_world/roi_of_usability.html
  • 29.
    We have asurvey set up We are getting data from it Why would we need anything more?
  • 30.
    SURVEYS •Survey questions are an art-form •Words can have multiple meanings and un-intended meanings •Self reporting cannot be trusted •People “save face” • Not that bad, my fault • I’m sure that’s great too Page 30
  • 31.
    HOW ABOUT OUREMPLOYEES? •Easy to test people within this company •Not the way to get good results •Too close to the project • Know things others wouldn’t about product •Concerns about ego, job, co-workers, etc. •Not the intended user! Page 31
  • 32.
    Don’t we needto test 100s of users to get real results?
  • 33.
    N U MB E R O F PA R T I C I PA N T S Studies have shown that testing 5 representative users of each user type will reveal ~80% of usability issues. http://www.useit.com/alertbox/20000319.html Page 33 Jakob Nielsen’s Alertbox. Why You Only Need to Test with 5 Users. March 19, 2000.
  • 34.
    L O OK F O R PAT T E R N S • Statistical significance is not feasible • ROI would diminish entirely • Identify repetition • After pattern is found, continuation of study: • Adds cost • Delays reporting • Low probability of many new findings Page 34
  • 35.
    CONTROVERSY OF 5USERS •Not enough to uncover 80% of issues. •Spool and Schroeder in 2001 found that only 35% of usability issues were uncovered with 5 participants • Not enough to take into account individual differences • Scope of the website being evaluated was very large even though the task was well defined Page 35 Albert, Bill and Tom Tullis. Measuring the User Experience. 2008. pg. 119
  • 36.
    W H ATT H I S M E A N S •Very specific user group - 5 works • Must know your user and recruit carefully •Less well defined groups require more users (8-15 or more) •Budget for 15, do three tests with 5 users • Catch mistakes early and often • Redesign using what you’ve learned Page 36
  • 37.
    D O ES N O T M E A N T H AT … •Testing five users is always enough •Can test anyone and have the same results •Smaller groups equate better findings Page 37
  • 38.
    N U MB E R O F PA R T I C I PA N T S D E P E N D S O N PURPOSE Main Purpose Explanation # of Participants Convincing skeptics Demonstrate that serious usability 3 problems exist in their product and effectiveness of usability testing. Find serious problems Drive a useful iterative cycle: Find 9-12 serious problems, correct them, find more serious problems. Find all serious Find all serious usability problems Unknown problems Find all problems Find all usability problems Unknown Measure Usability Measure key usability parameters, >20 (time to complete key tasks, user satisfaction, etc.) Adapted from: Molich, Rolf. A Critique of “How to Specify the Participant Group Size for Usability Studies: A Page 38 Practitioner’s Guide” by Macefield. Journal of Usability Studies. Vol. 5, Issue 3, May 2010. pg. 124-128.
  • 39.
    IF TEST QUALITYIS POOR, GROUP SIZE D O E S N ’ T M AT T E R •Uneven or poor facilitation •Invalid test tasks •Poor use of the "think aloud" methodology •"Results of usability tests depend considerably on the evaluator" - Jacobsen and Hertzum, 2001 Molich, Rolf. A Critique of “How to Specify the Participant Group Size for Usability Studies: A Practitioner’s Guide” Page 39 by Macefield. Journal of Usability Studies. Vol. 5, Issue 3, May 2010. pg. 124-128.
  • 40.
    1 0 WAYS T O P R O M O T E U X 1. Invite everyone to observe via remote observation 2. Schedule testing at a regular time 3. Promote availability of testing internally (Yammer) 4. Network within organization and share what you do 5. Hold Brownbag sessions 6. Invite staff to local UX events 7. Share recommendations and successes widely 8. Post information radiators in shared locations 9. Hold a World Usability Day Event 10. Invite everyone to observe UX sessions in-person Page 40
  • 41.
  • 42.
    WHO IS ALREADYTHERE? •Pay attention to who approaches you. •Look for your comrades •May not be in your area of the organization •Make time to chat with them • Share recent articles about UX • Invite to a UX event locally • Invite to join LinkedIn or other groups online Page 42
  • 43.
    C R EAT E N E W E VA N G E L I S T S •Use promotions to find new evangelists •Remind everyone of successes •Provide templates for planning that include UX activities •Provide highlights and/or reports that will help them sell UX Page 43
  • 44.
    B U IL D U X I N T H E O R G A N I Z AT I O N •Find a C-level person who could be a supporter • Get their support for a small study • Invite them to sessions • Make sure they see benefits gained • Remind them of this next time •Build department from within Page 44
  • 45.
    U N DE R S TA N D U X •Help everyone understand shared goals: • Increase sales • Save time and money • Create happy customers Page 45
  • 46.
    B E NE F I T T O C O M PA N I E S •Sell more product and discover unmet needs •Enhance company’s reputation •Save money on internal products •Reduce: • Support costs • Training costs • Need for updates and maintenance releases •Make documentation and training easier to develop Page 46 From A Practical Guide to Usability Testing by Joseph Dumas and Janice Redish, 1999. Page 18.
  • 47.
    WHY YOU SHOULDCARE “Customers are the only stakeholders who are not represented in design meetings. If it hurts users and will cause customers to leave? Silence. Unless you speak up. So do it.” -Jakob Nielsen Usability Evangelism: Beneficial or Land Grab? By Jakob Nielsen, Ph.D Page 47 http://www.developer.nokia.com/Design/Usability_evangelism.xhtml
  • 48.
  • 49.
    EVERYONE! http://www.flickr.com/photos/jamescridland/ http://creativecommons.org/licenses/by/2.0/ Page 49 http://www.flickr.com/photos/jamescridland/613445810/sizes/l/in/photostream/
  • 50.
  • 51.
    C O NTA C T C A R O L @carologic Email: Carol.Smith@perficient.com slideshare.net/carologic and slideshare.net/PerficientInc speakerrate.com/speakers/15585-caroljsmith Page 51
  • 52.
    REFERENCES •Cost-Justifying Usability: An Update for the Internet Age, Randolph G. Bias and Deborah J. Mayhew •The $300 Million Button by Jared Spool •Jakob Nielsen’s Alertbox. Why You Only Need to Test with 5 Users. March 19, 2000. •Measuring the User Experience by Bill Albert and Tom Tullis •Usability Evangelism: Beneficial or Land Grab? by Jakob Nielsen, Ph.D •http://www.upassoc.org/usability_resources/usability_in_the_real_world/roi_of_ usability.html •Molich, Rolf. A Critique of “How to Specify the Participant Group Size for Usability Studies: A Practitioner’s Guide” by Macefield. Journal of Usability Studies. Vol. 5, Issue 3, May 2010. pg. 124-128. Page 52