Download as PDF, PPTX
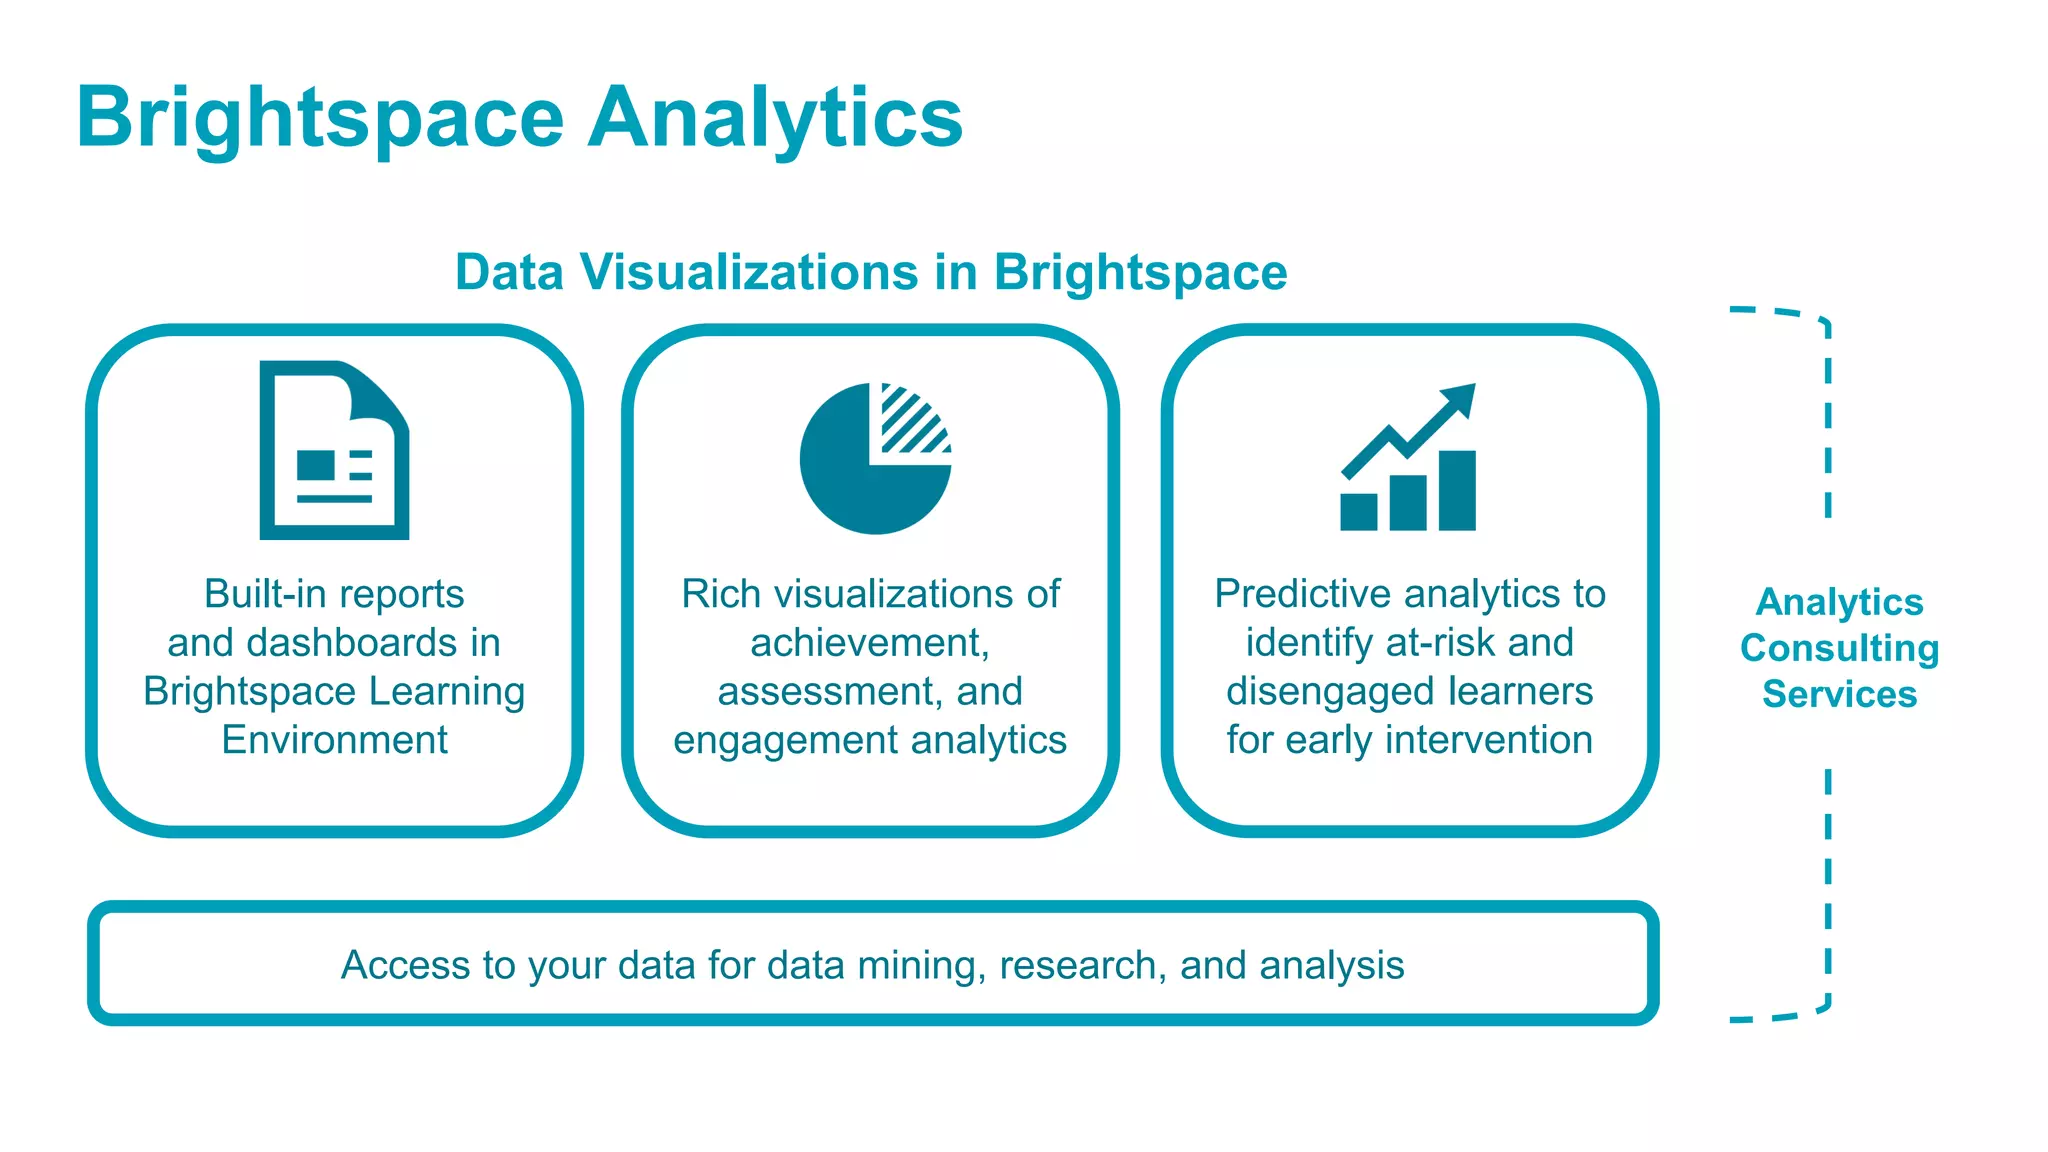
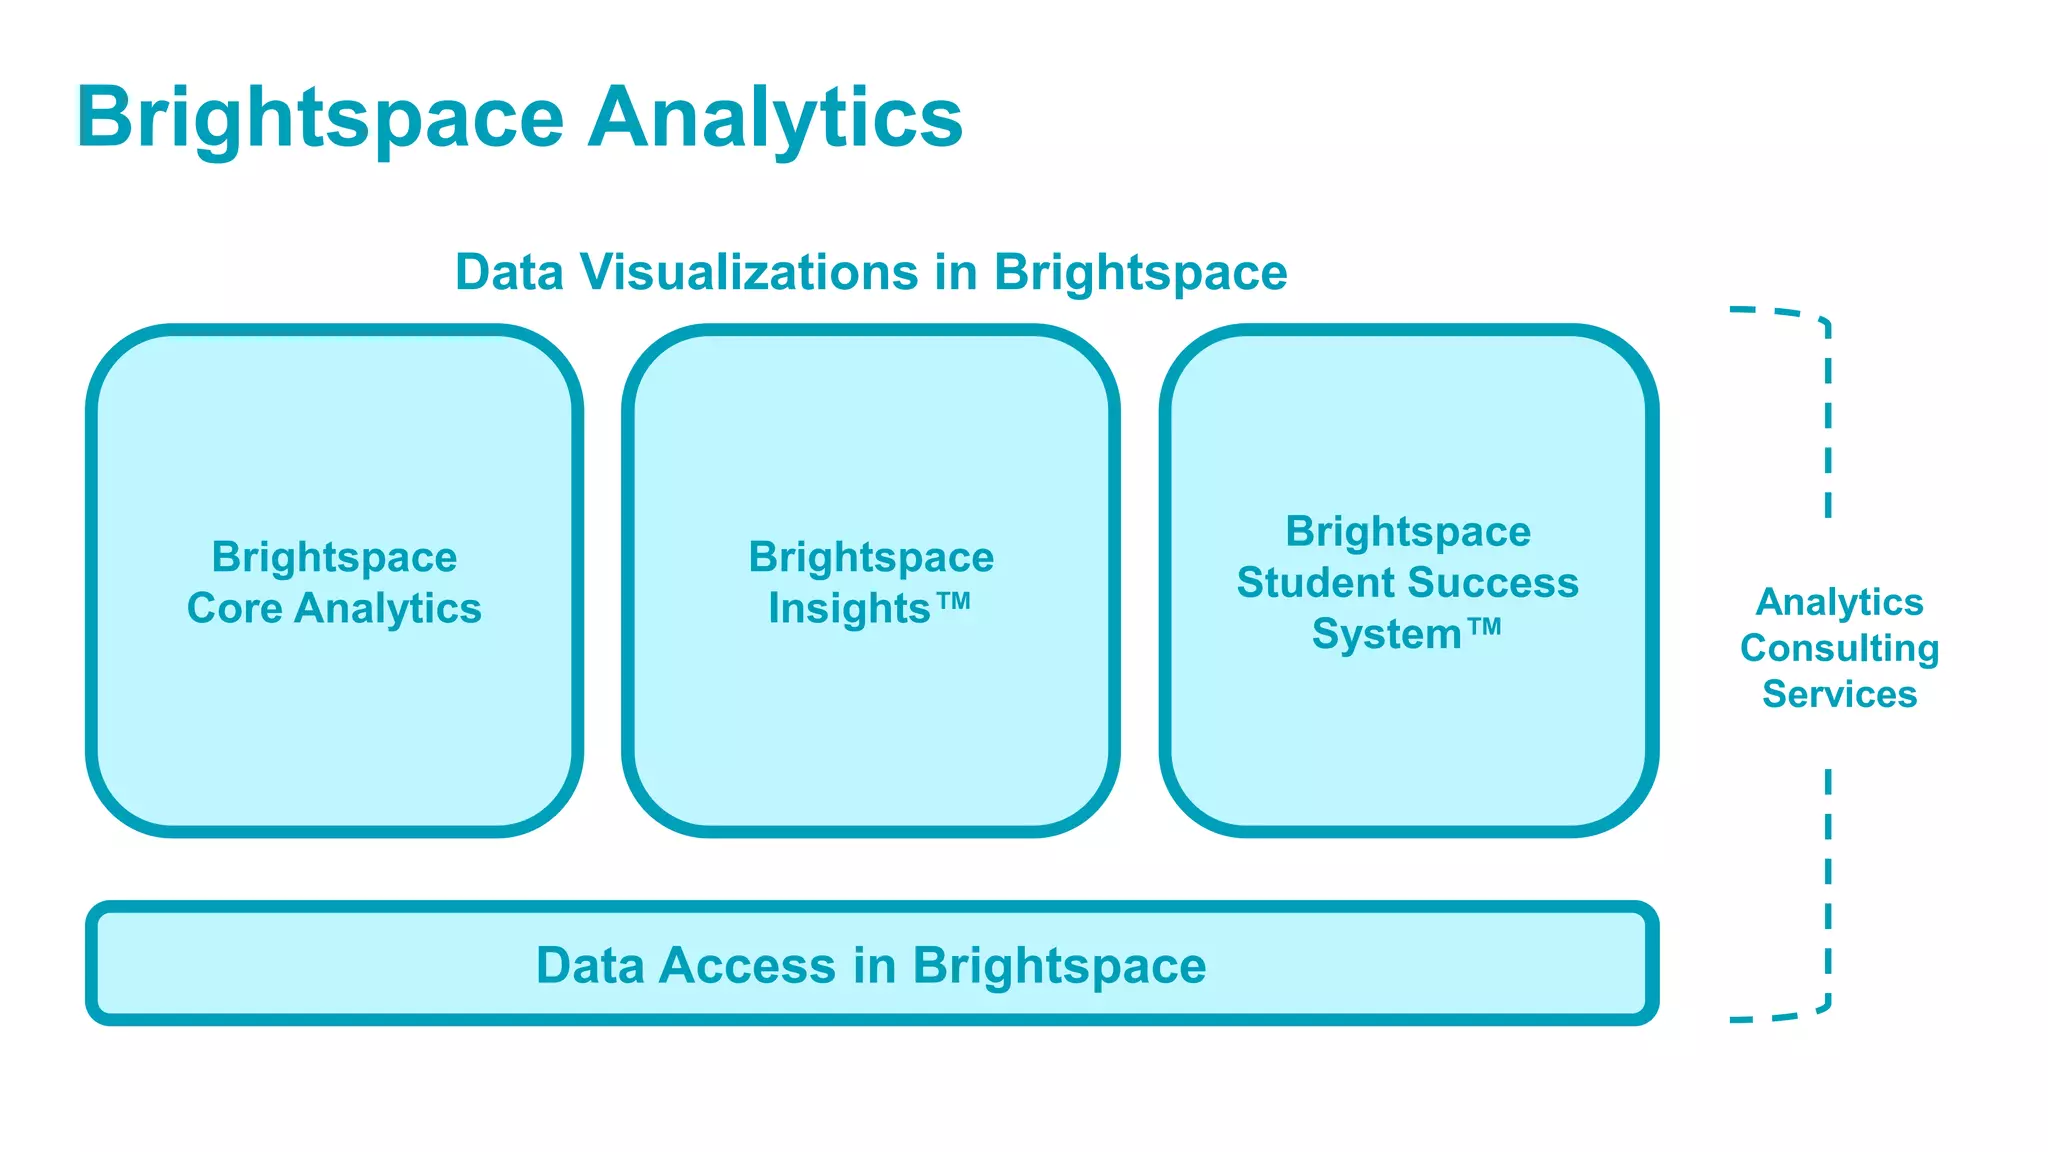
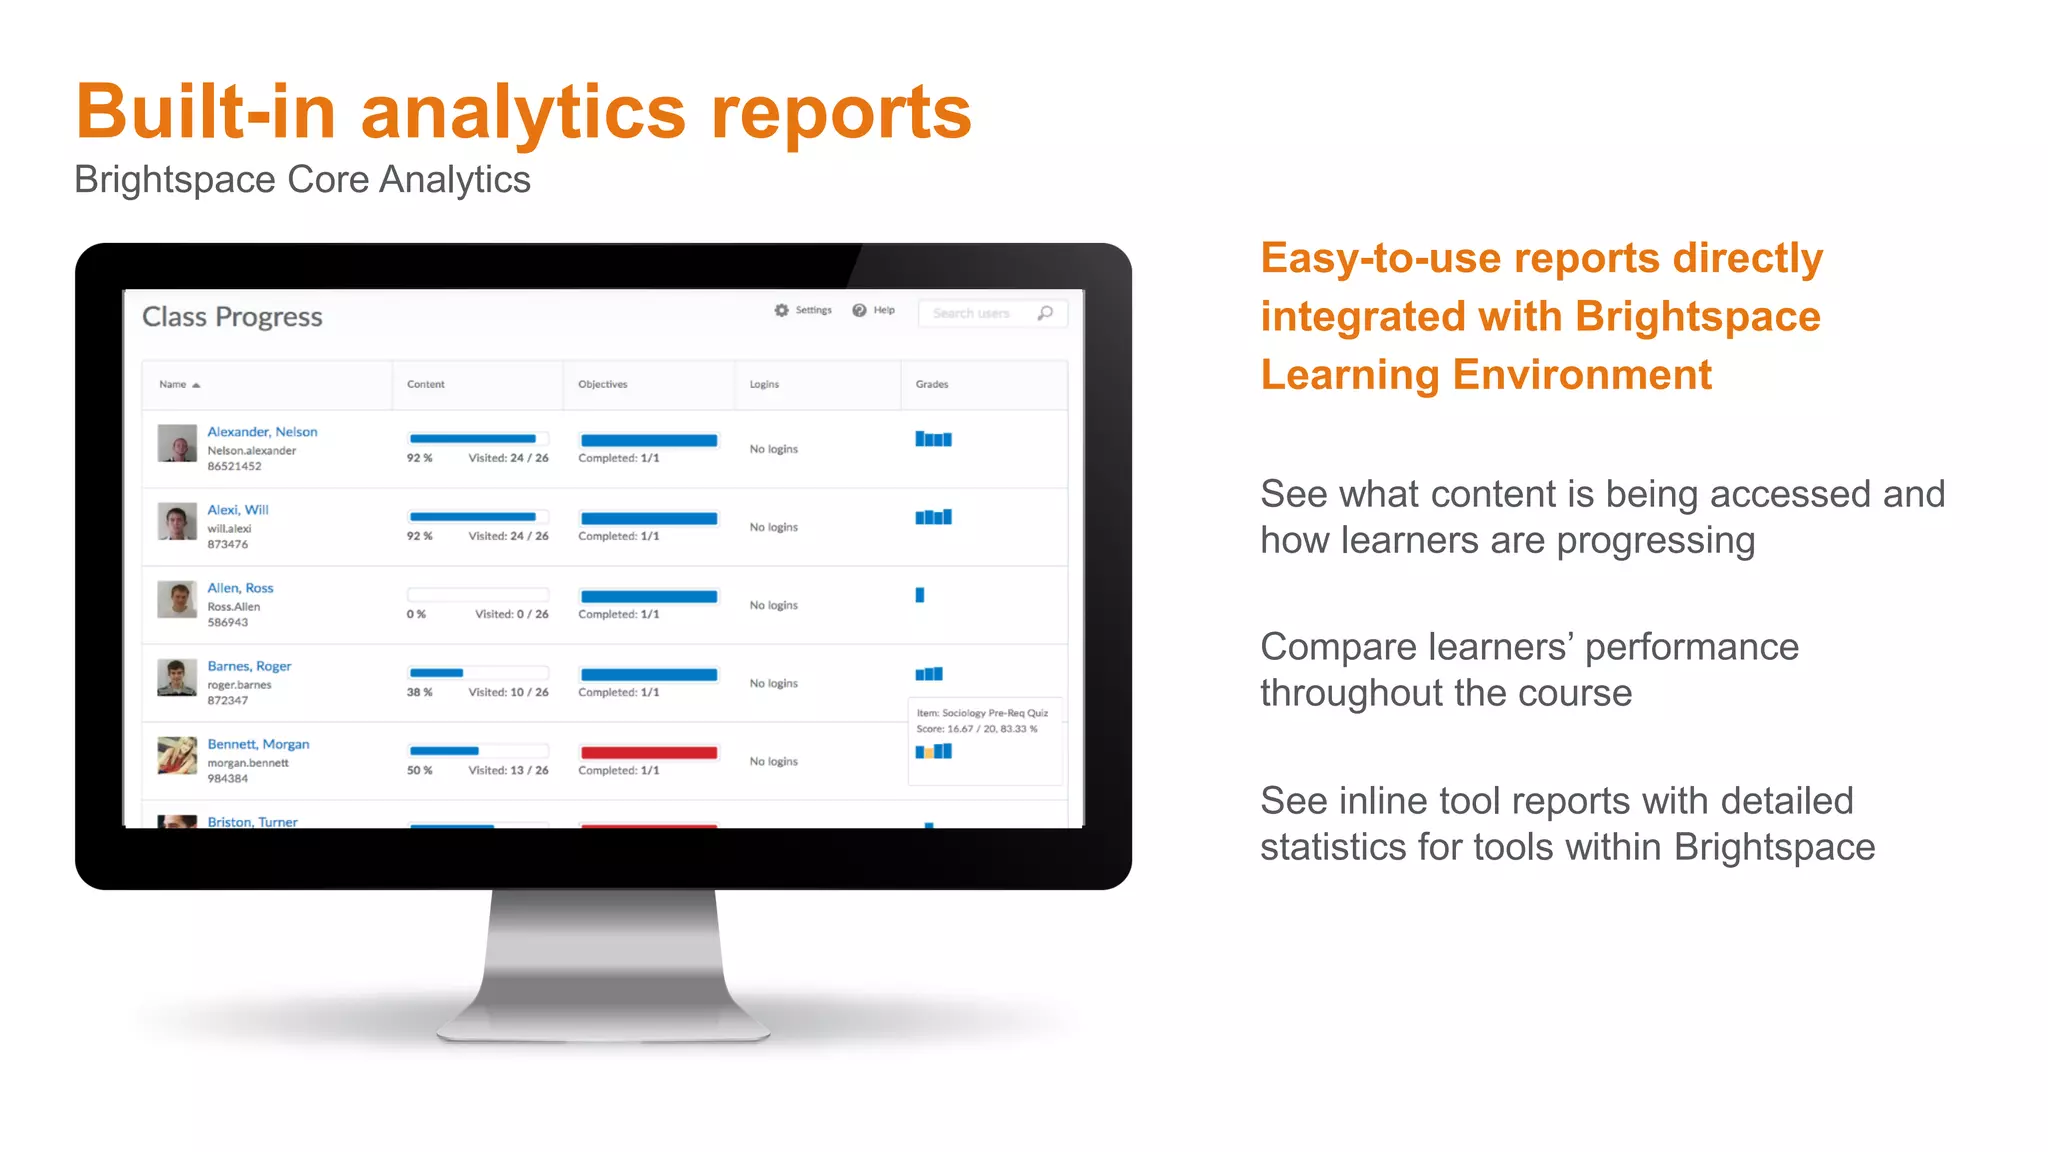
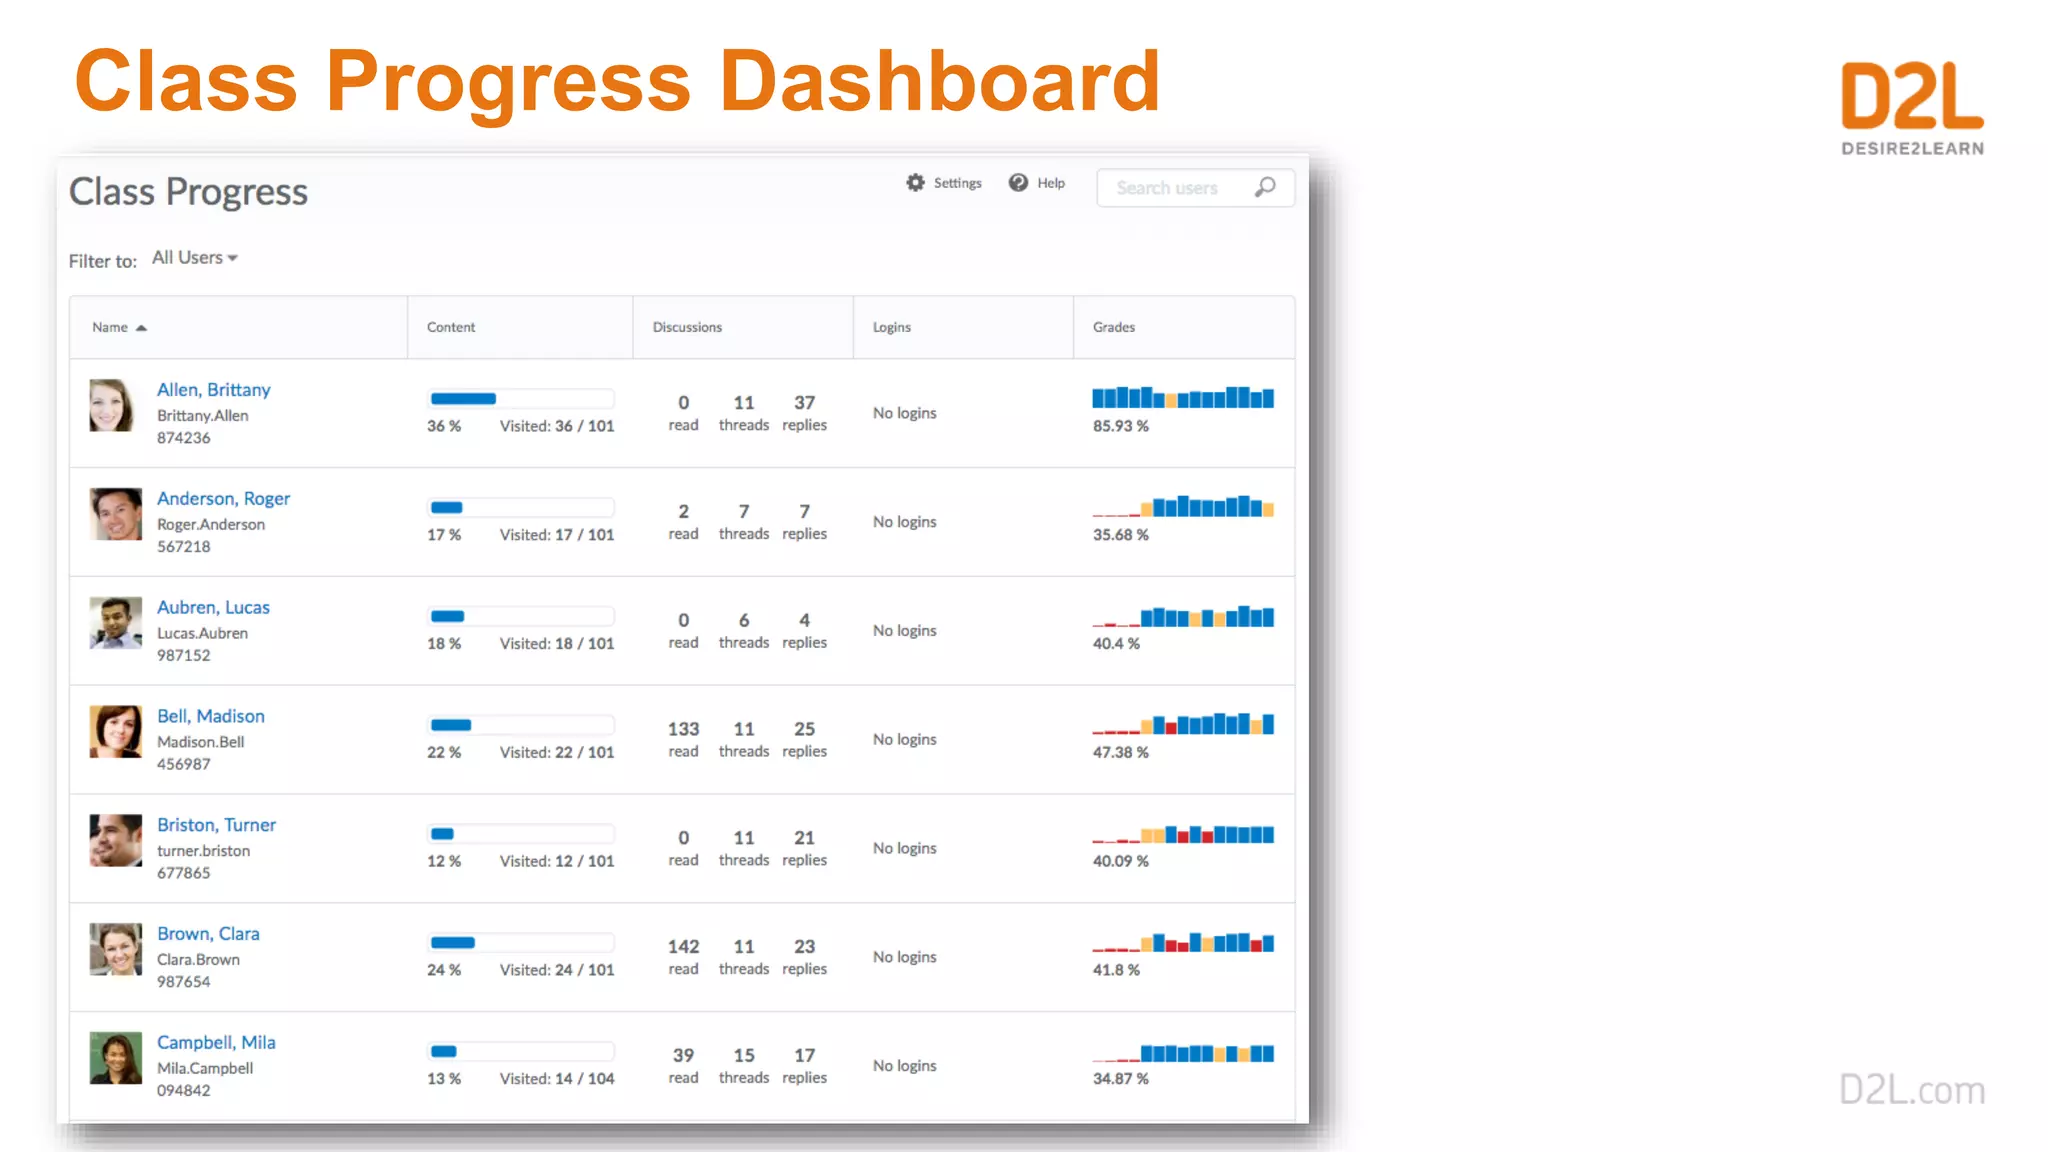
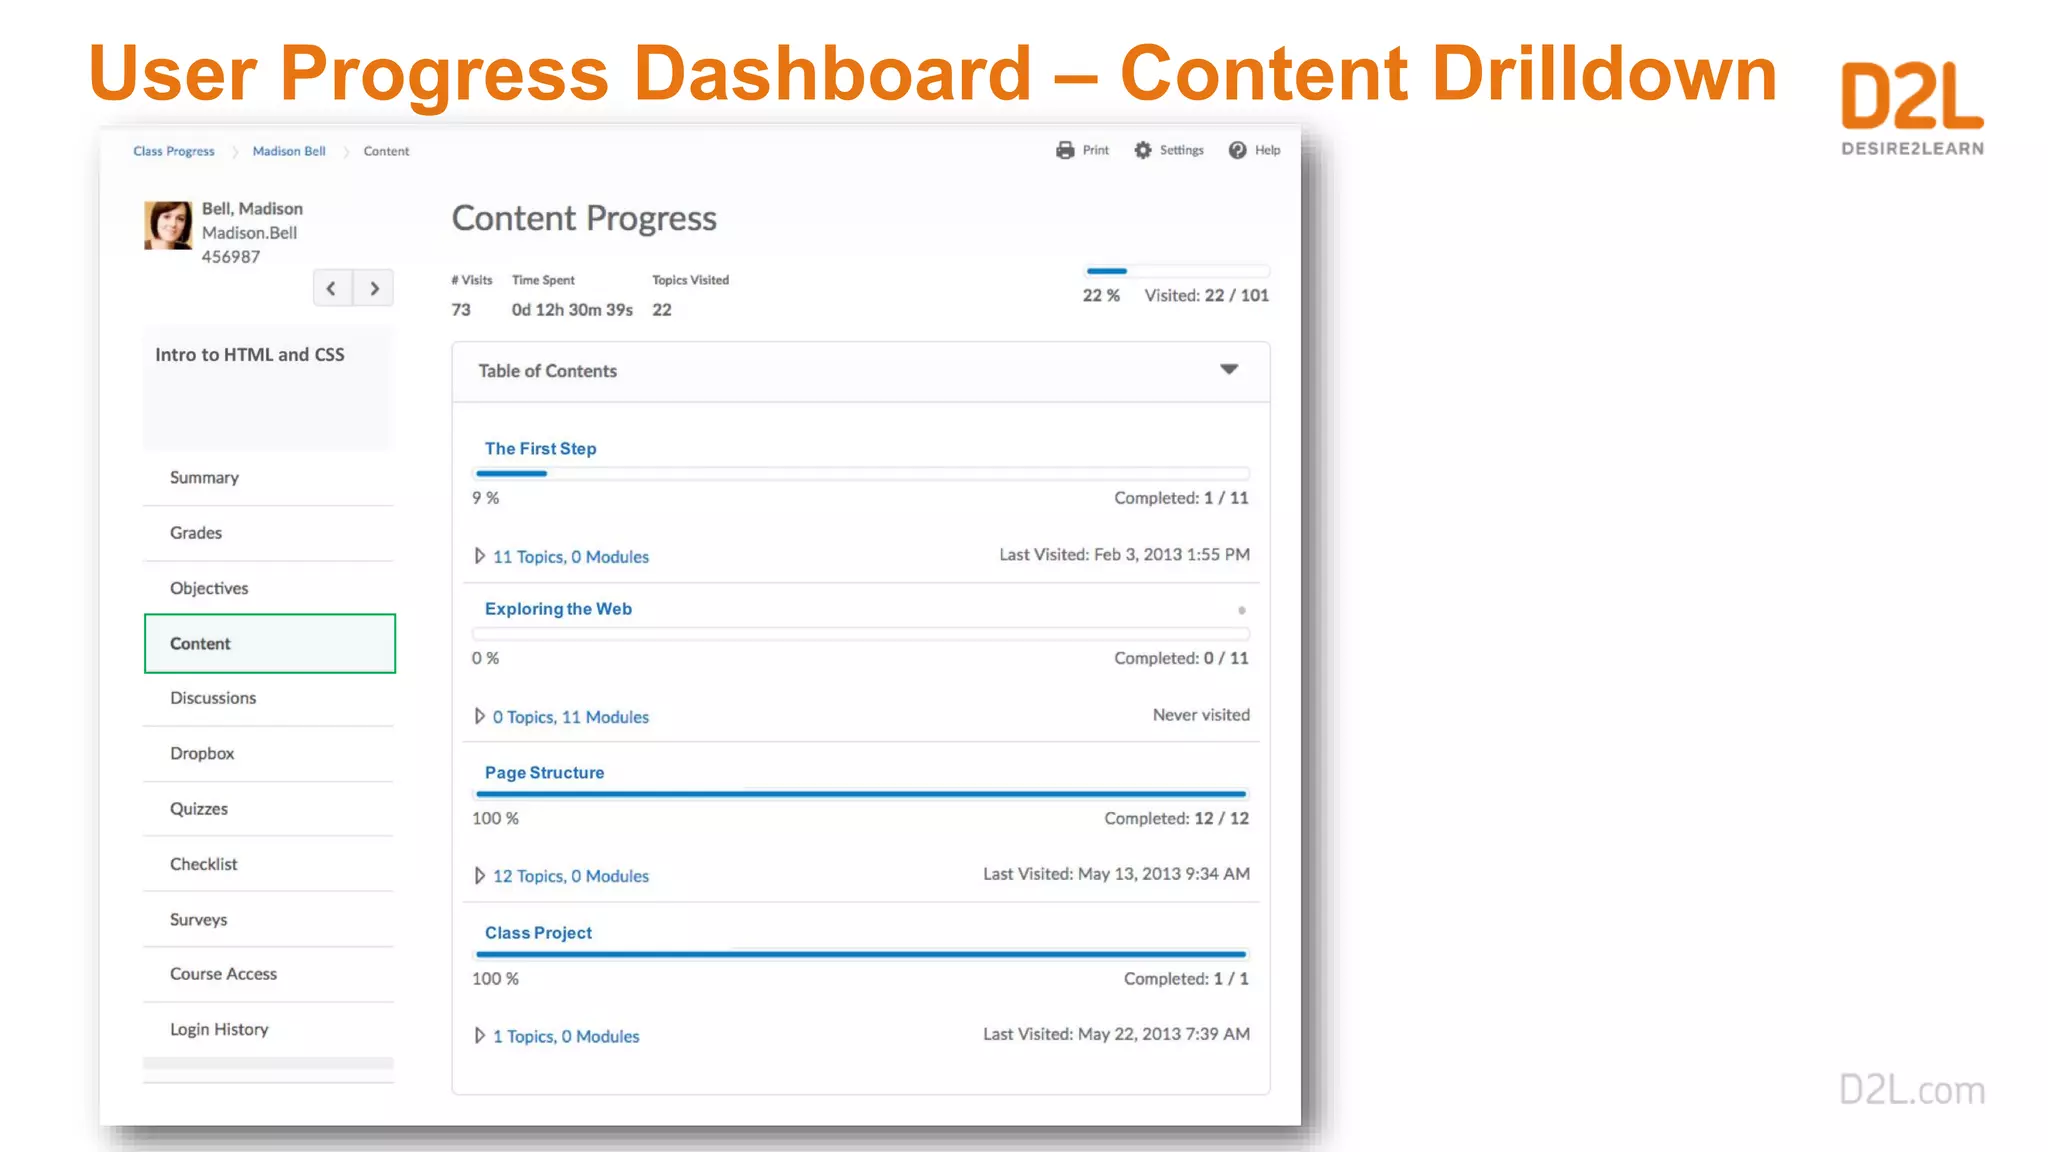
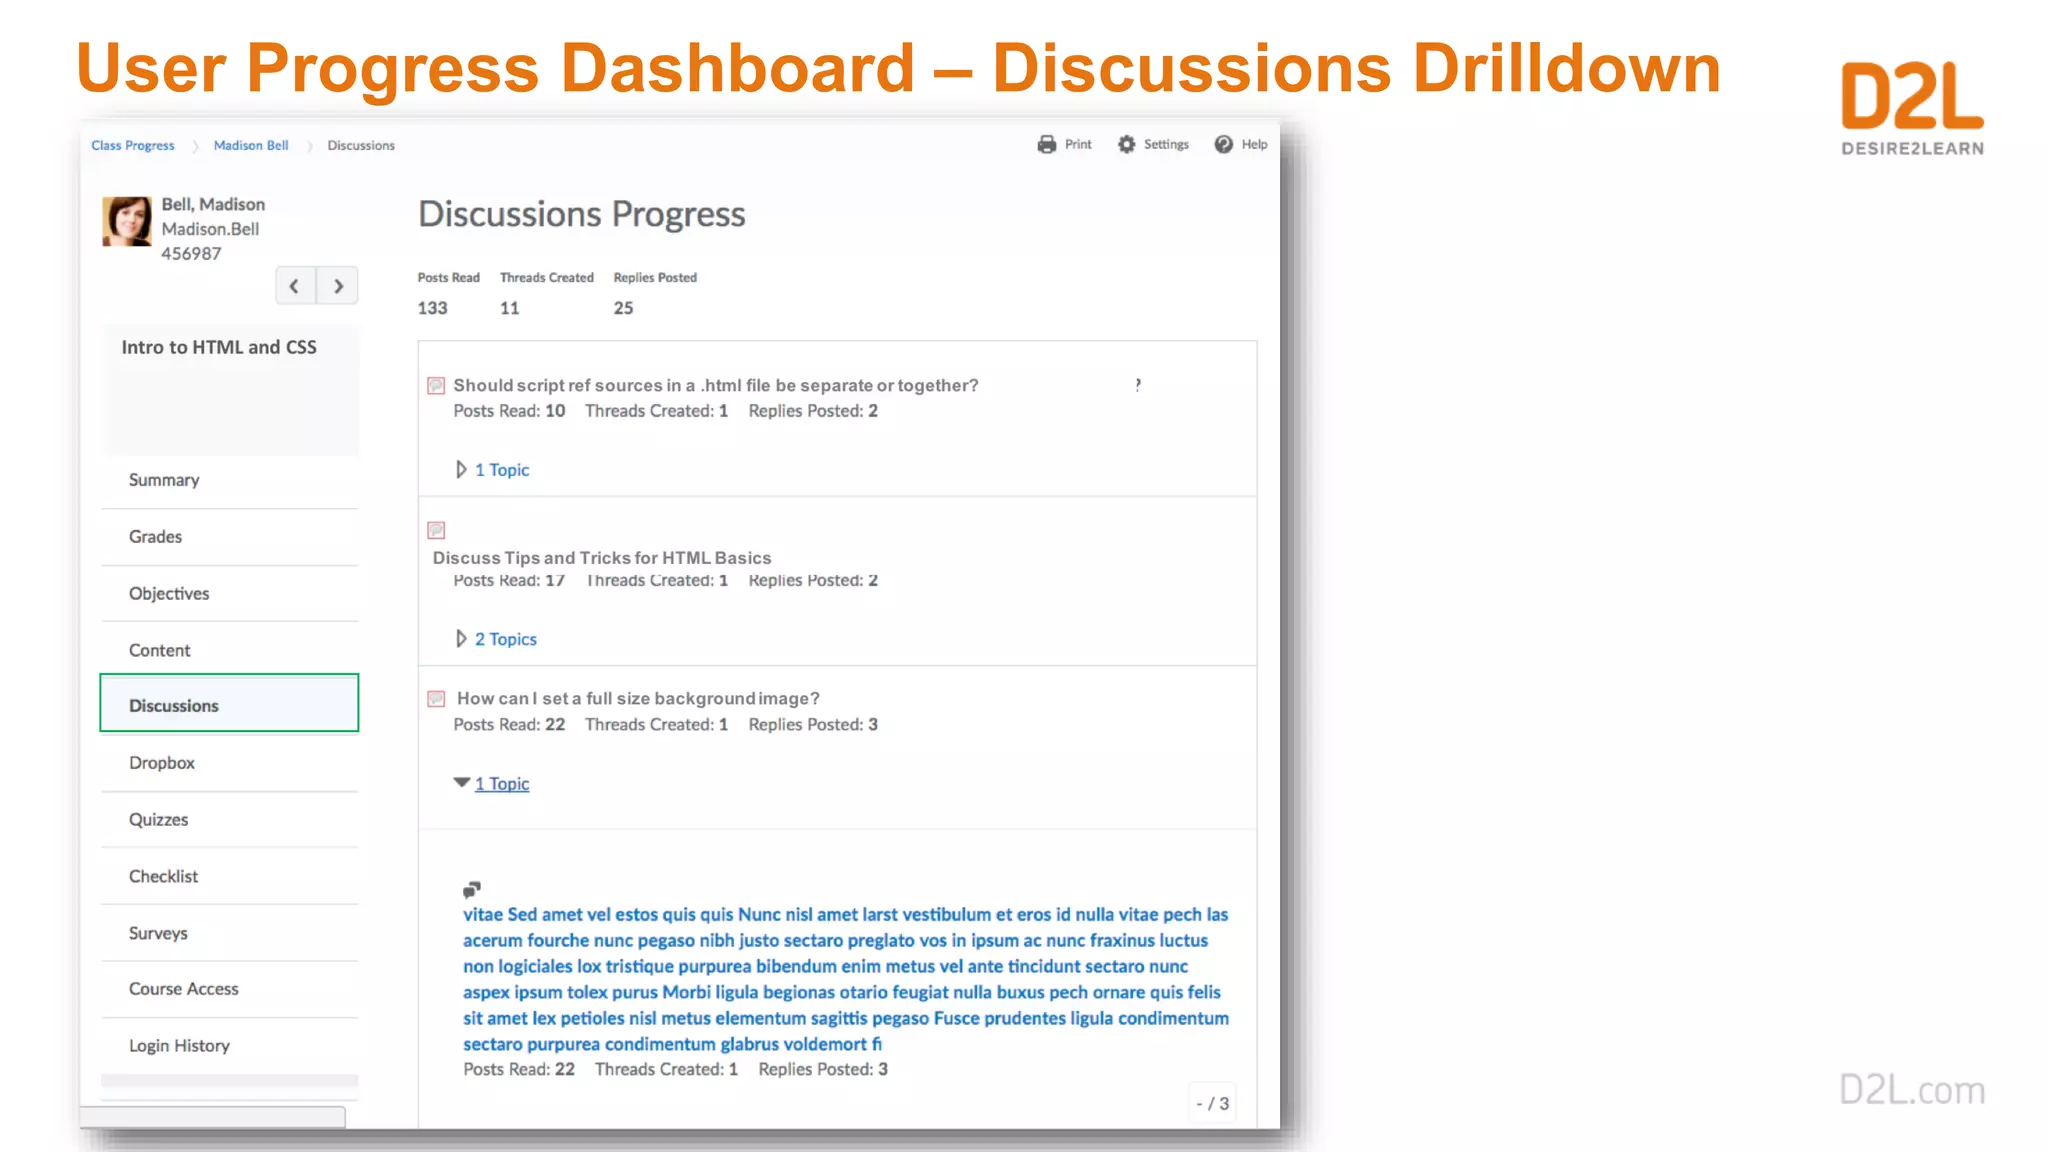
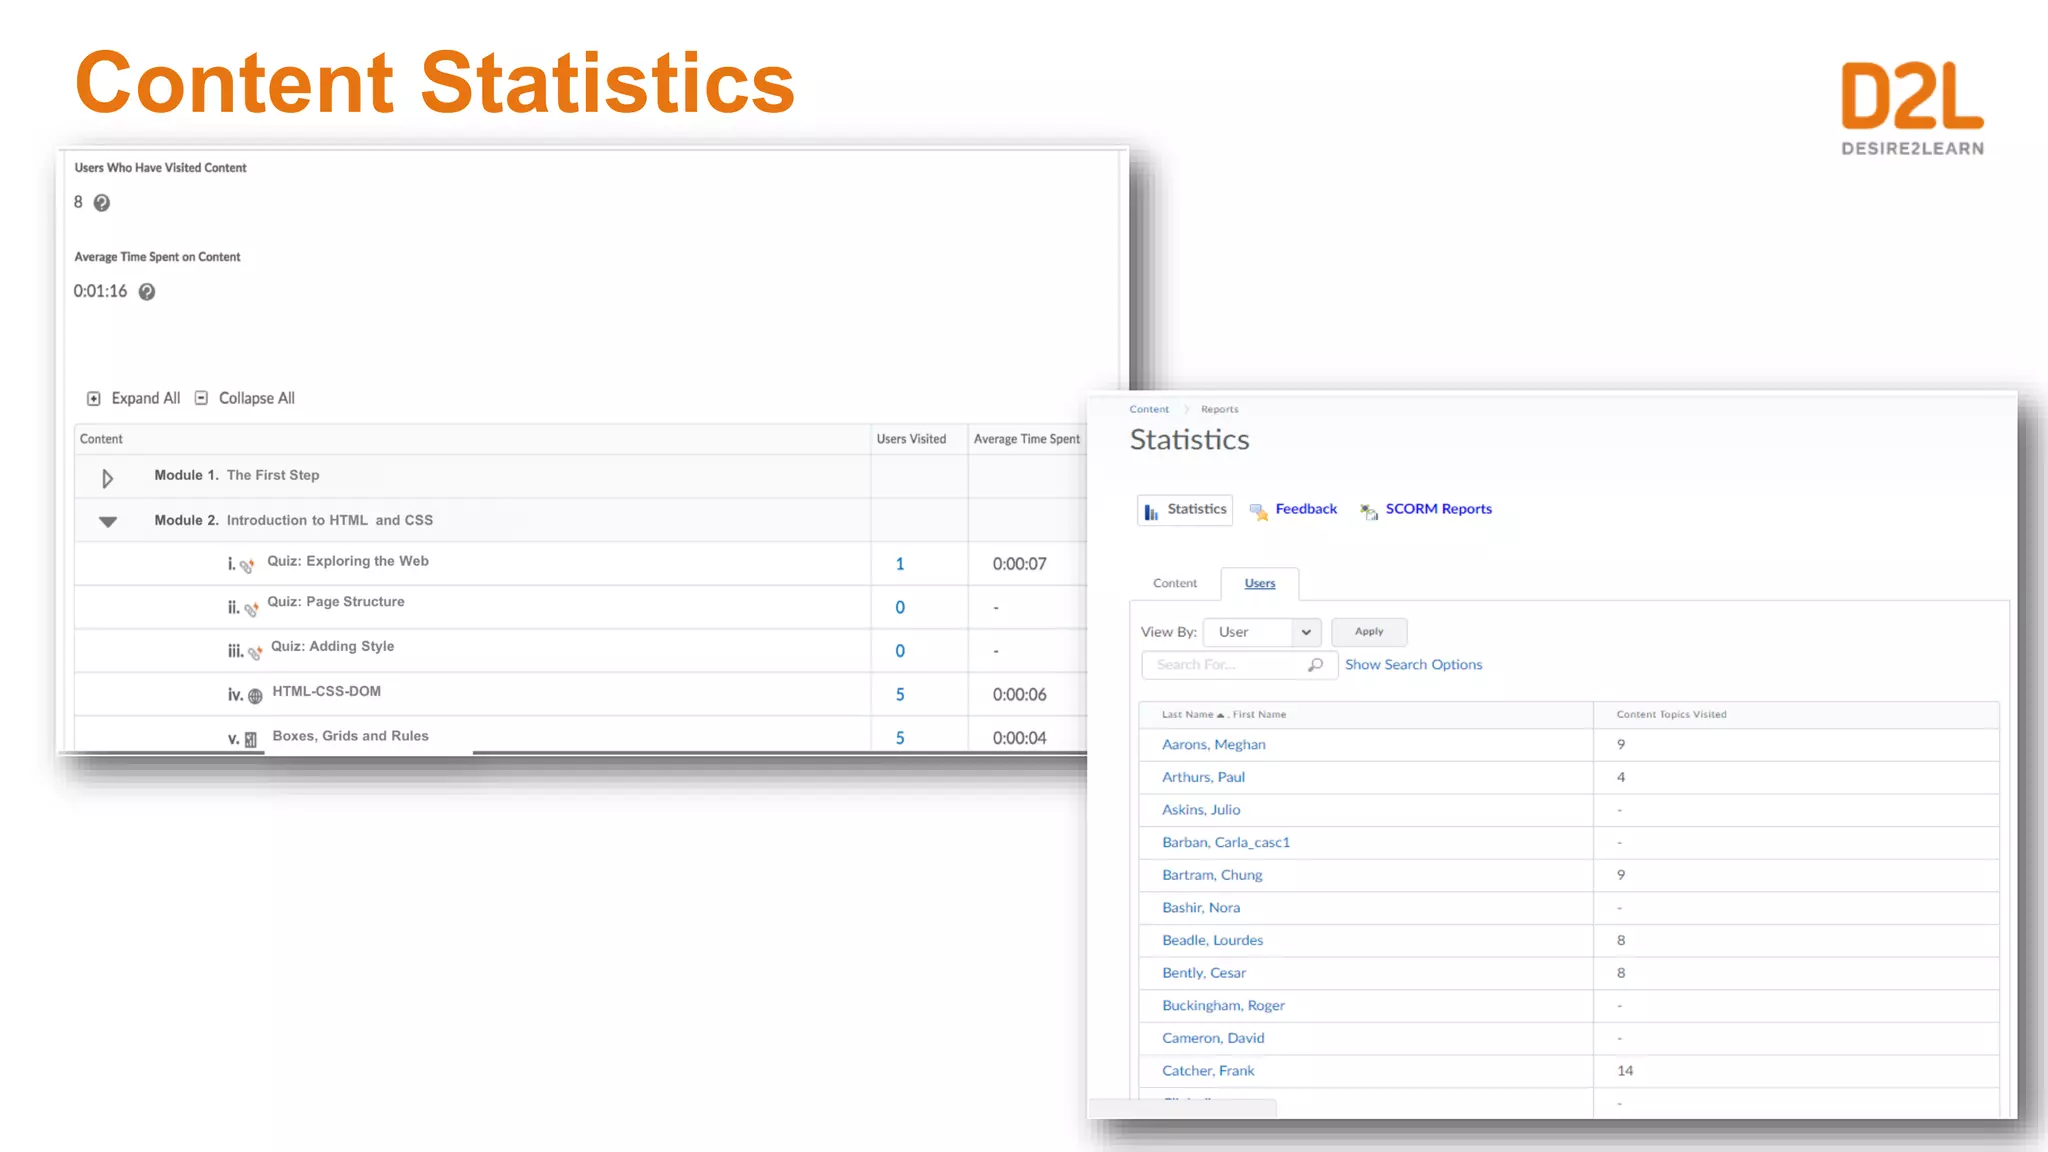
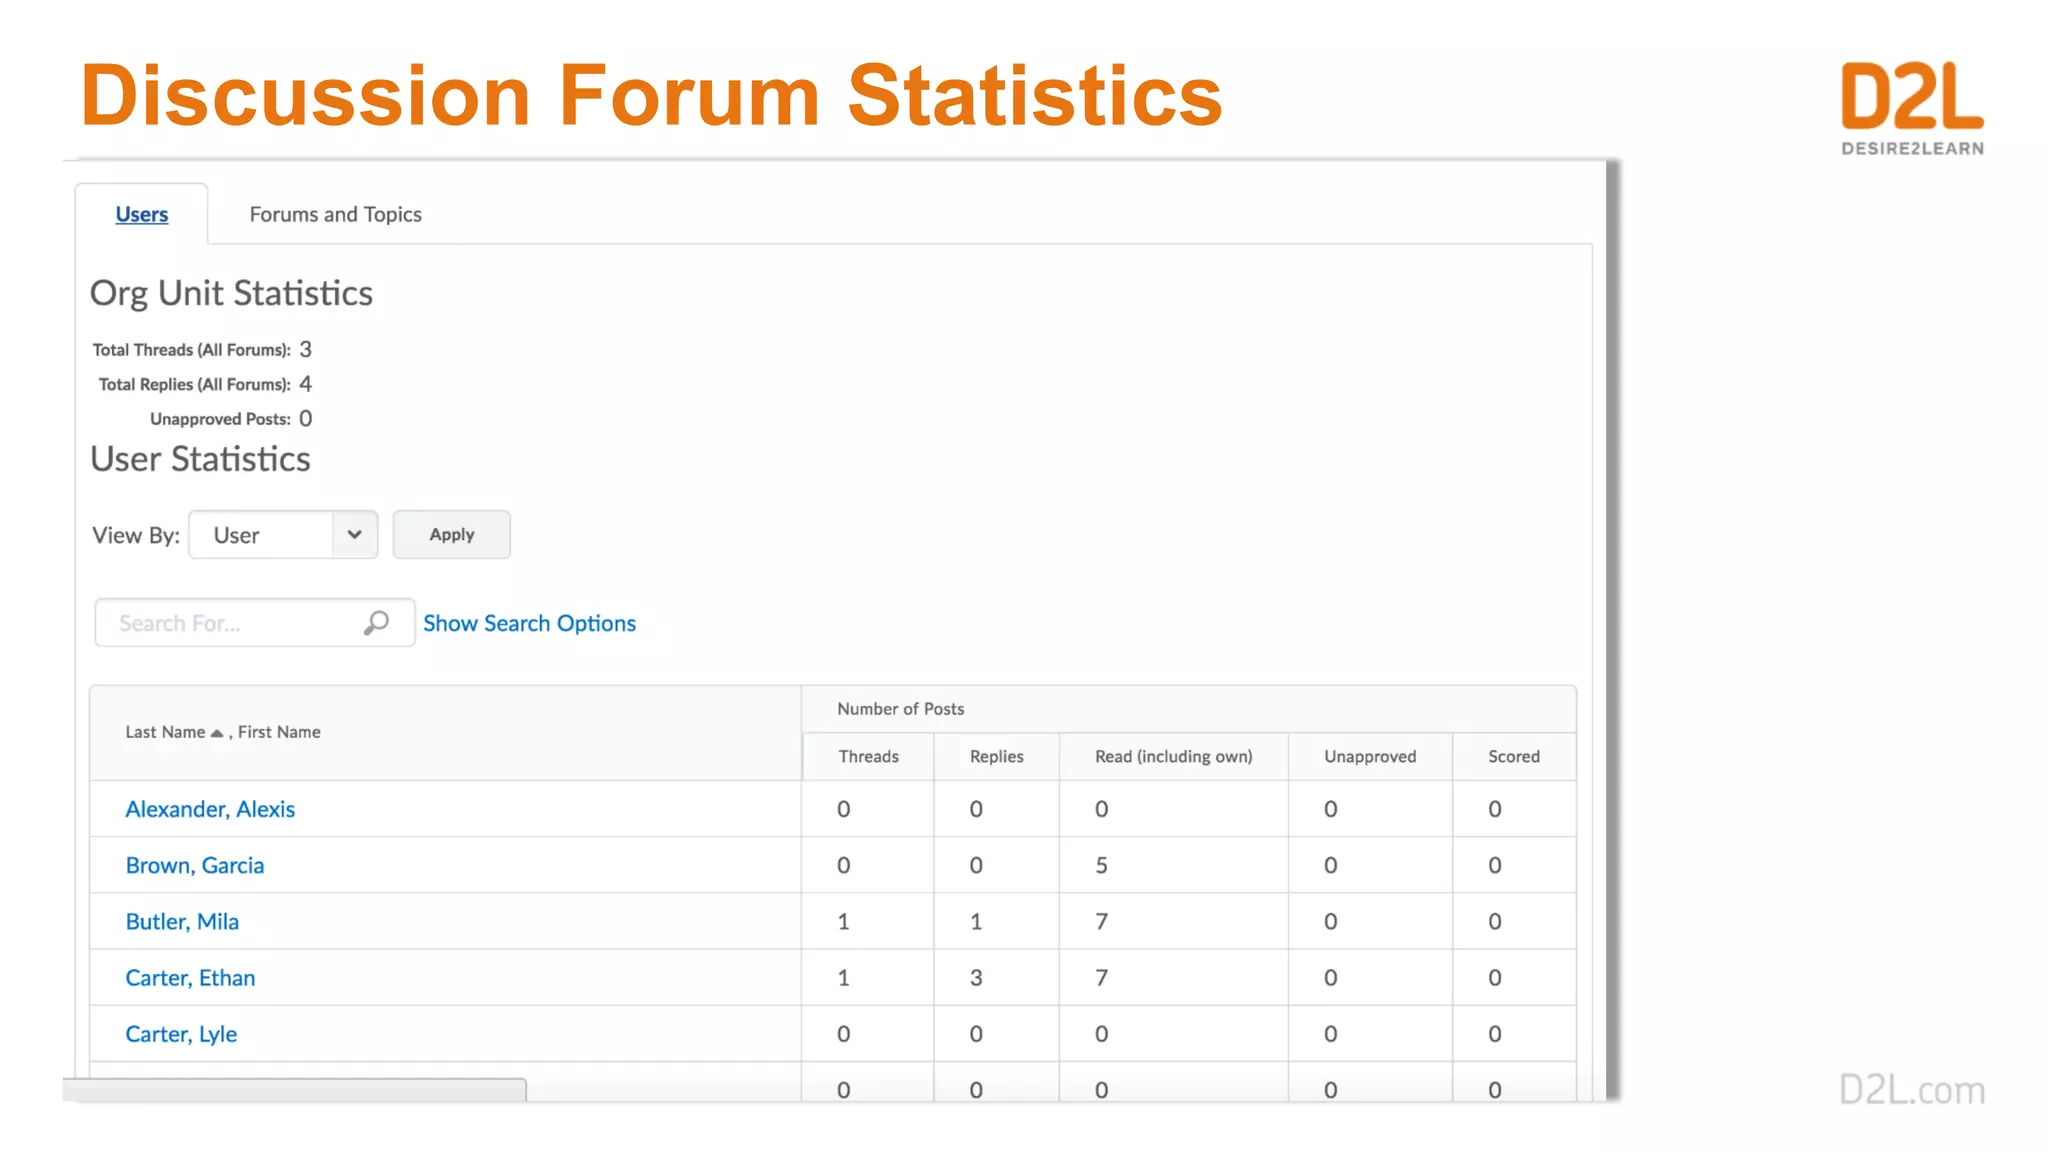
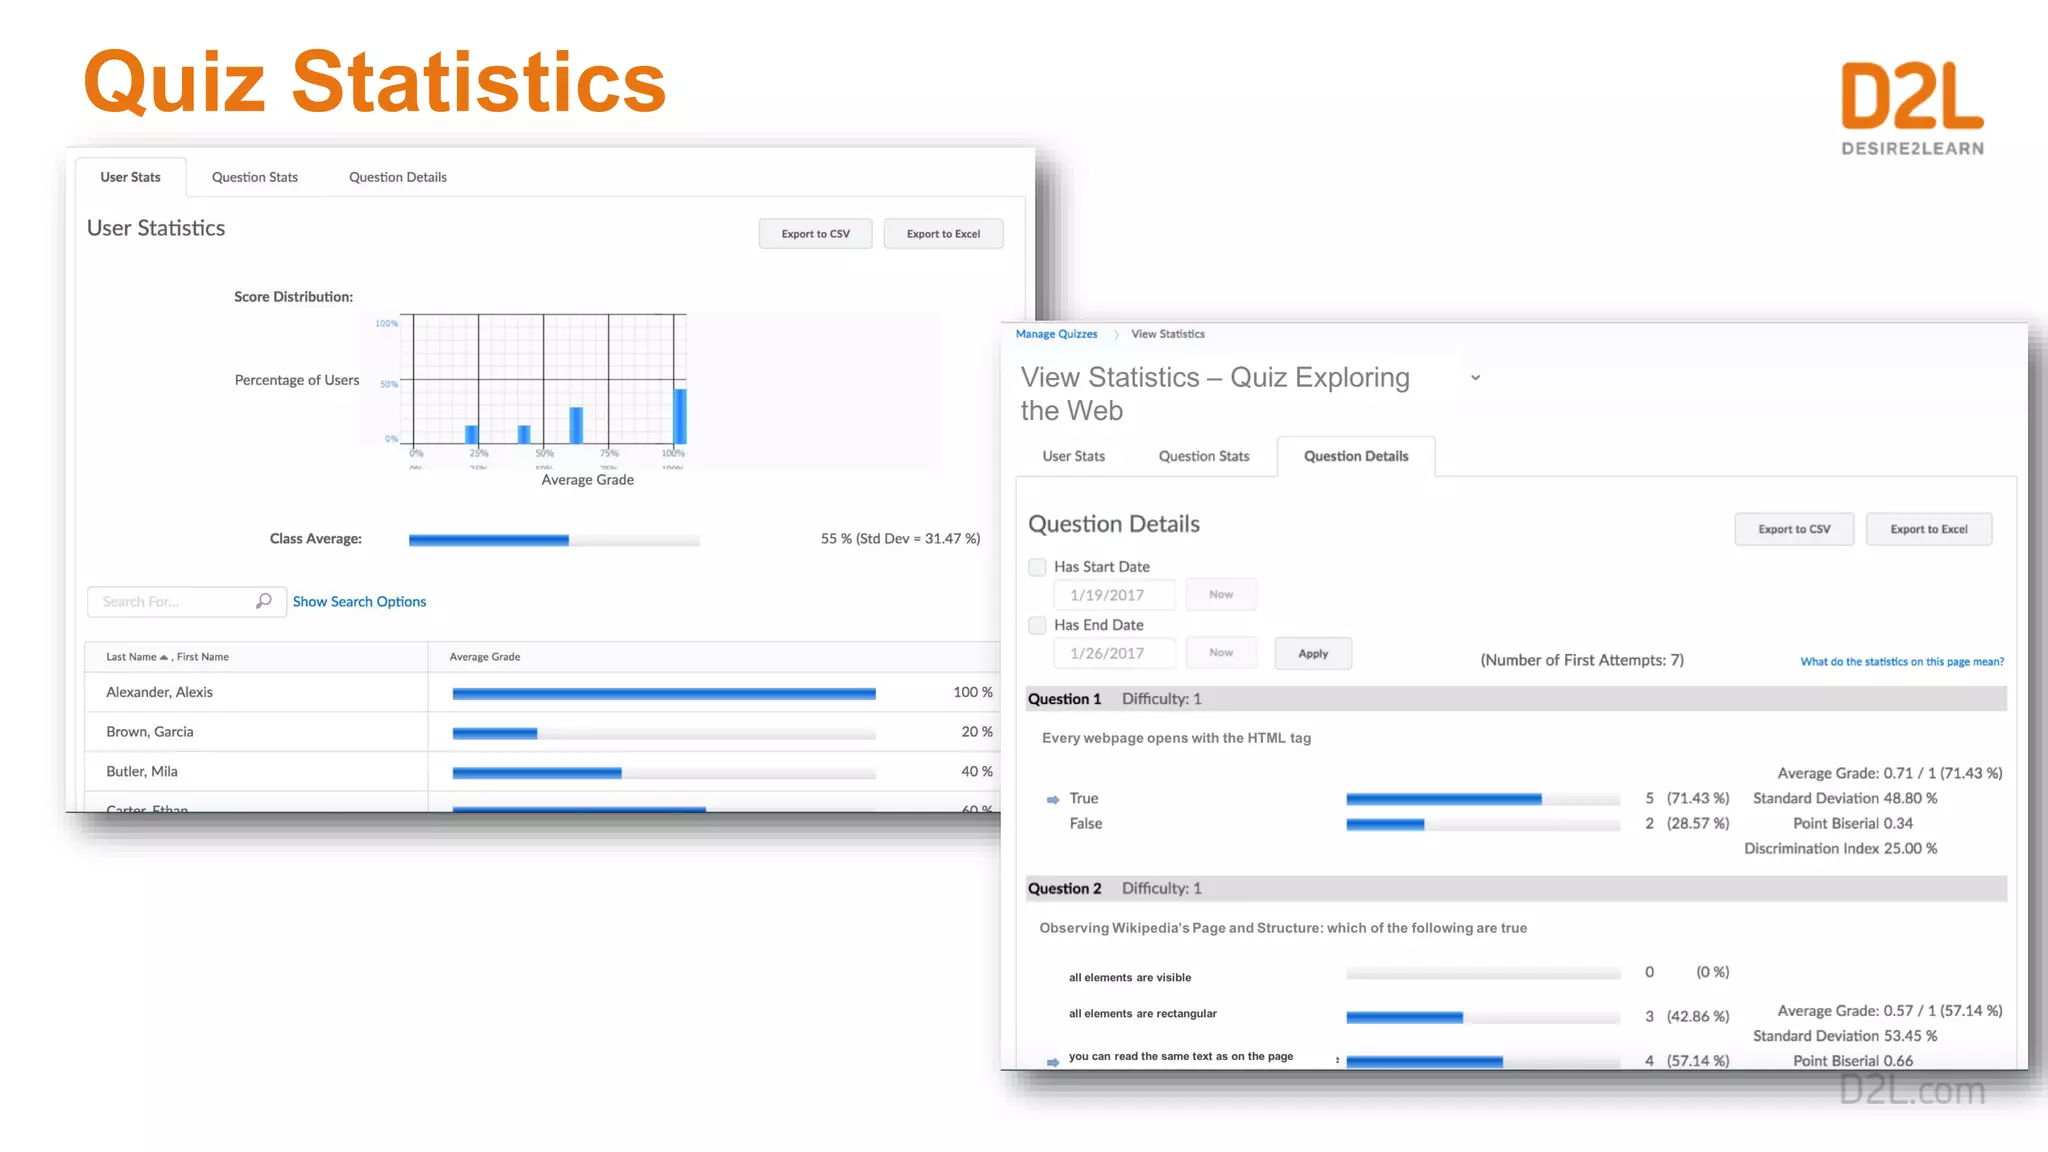
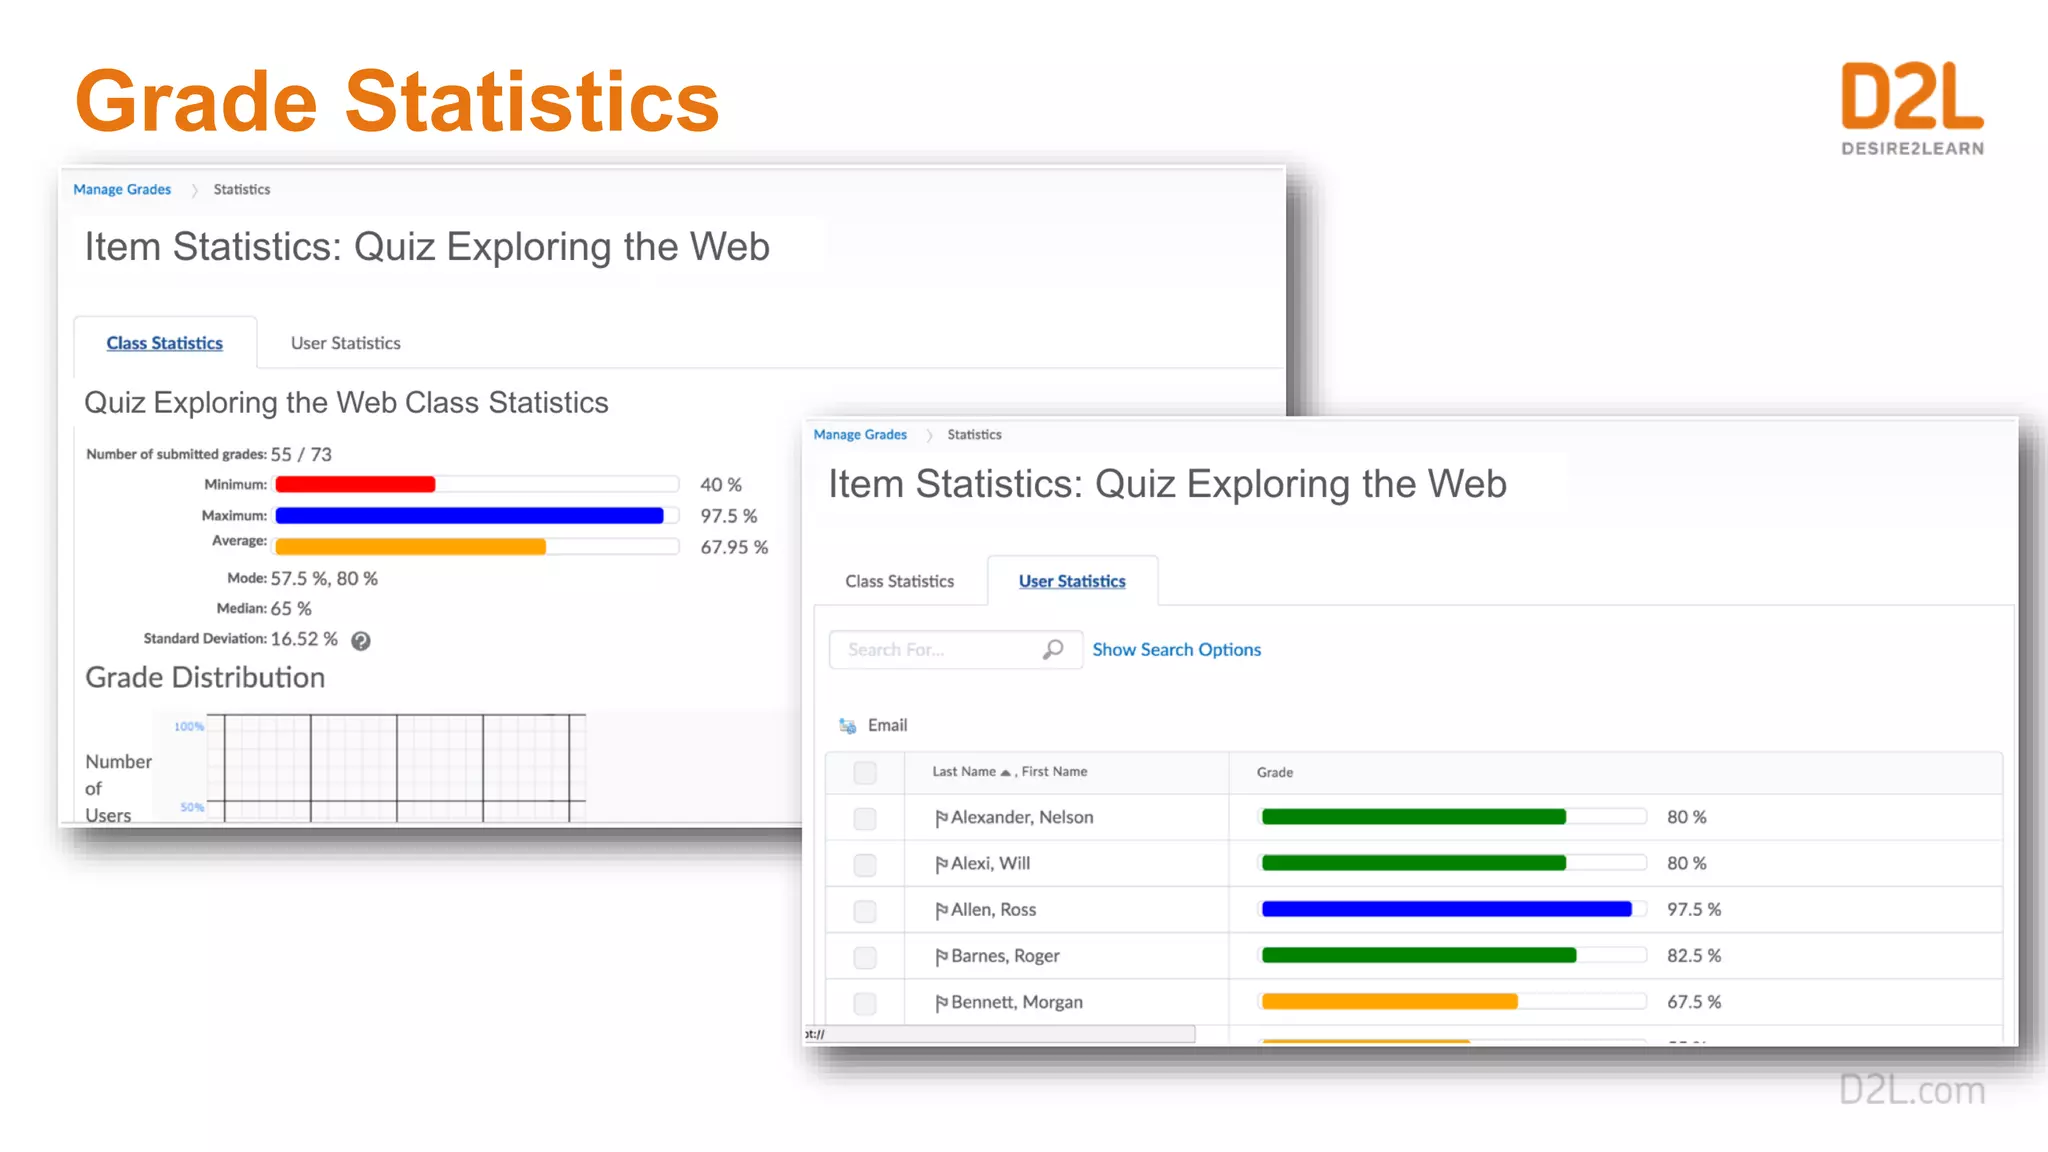
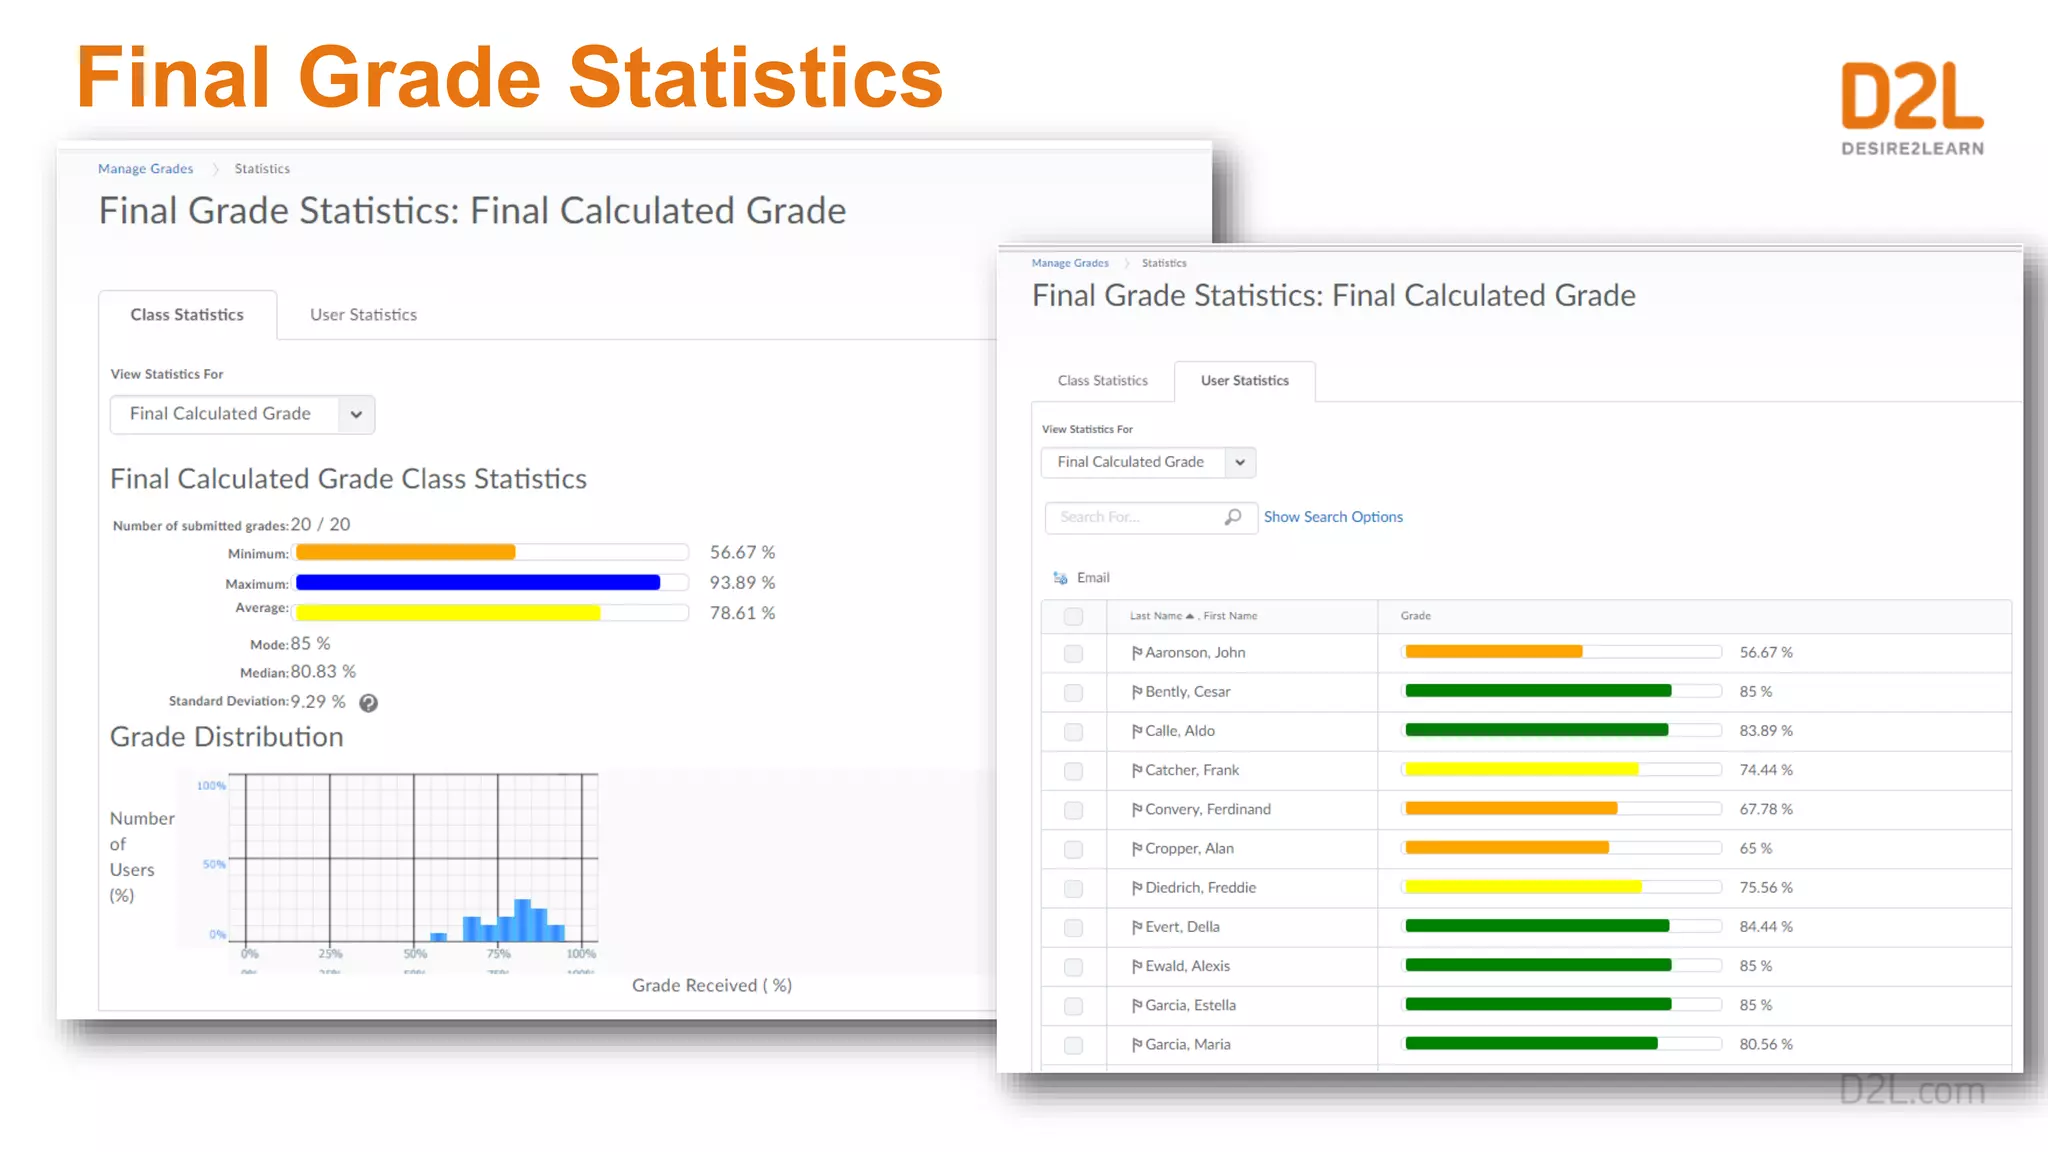
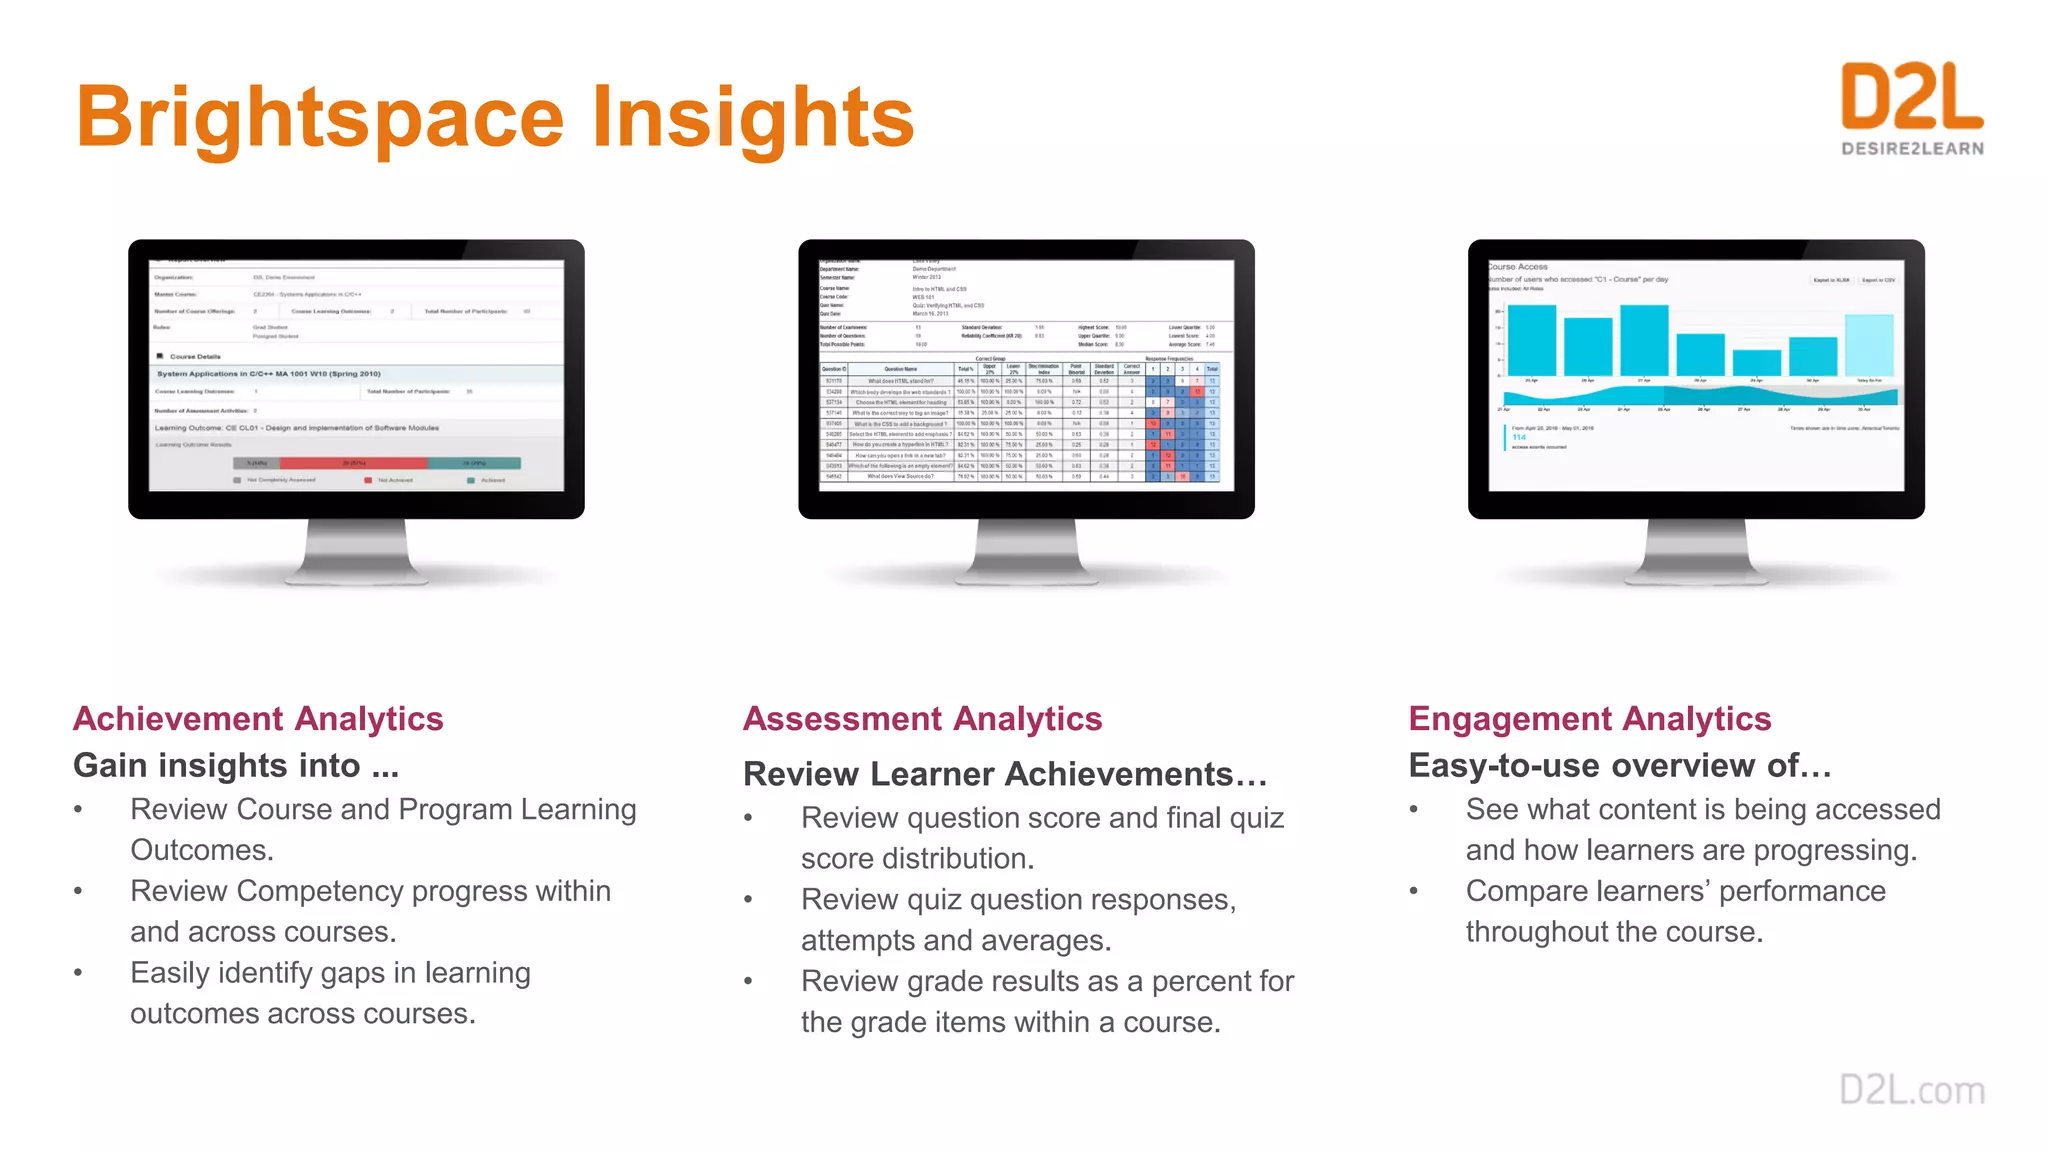
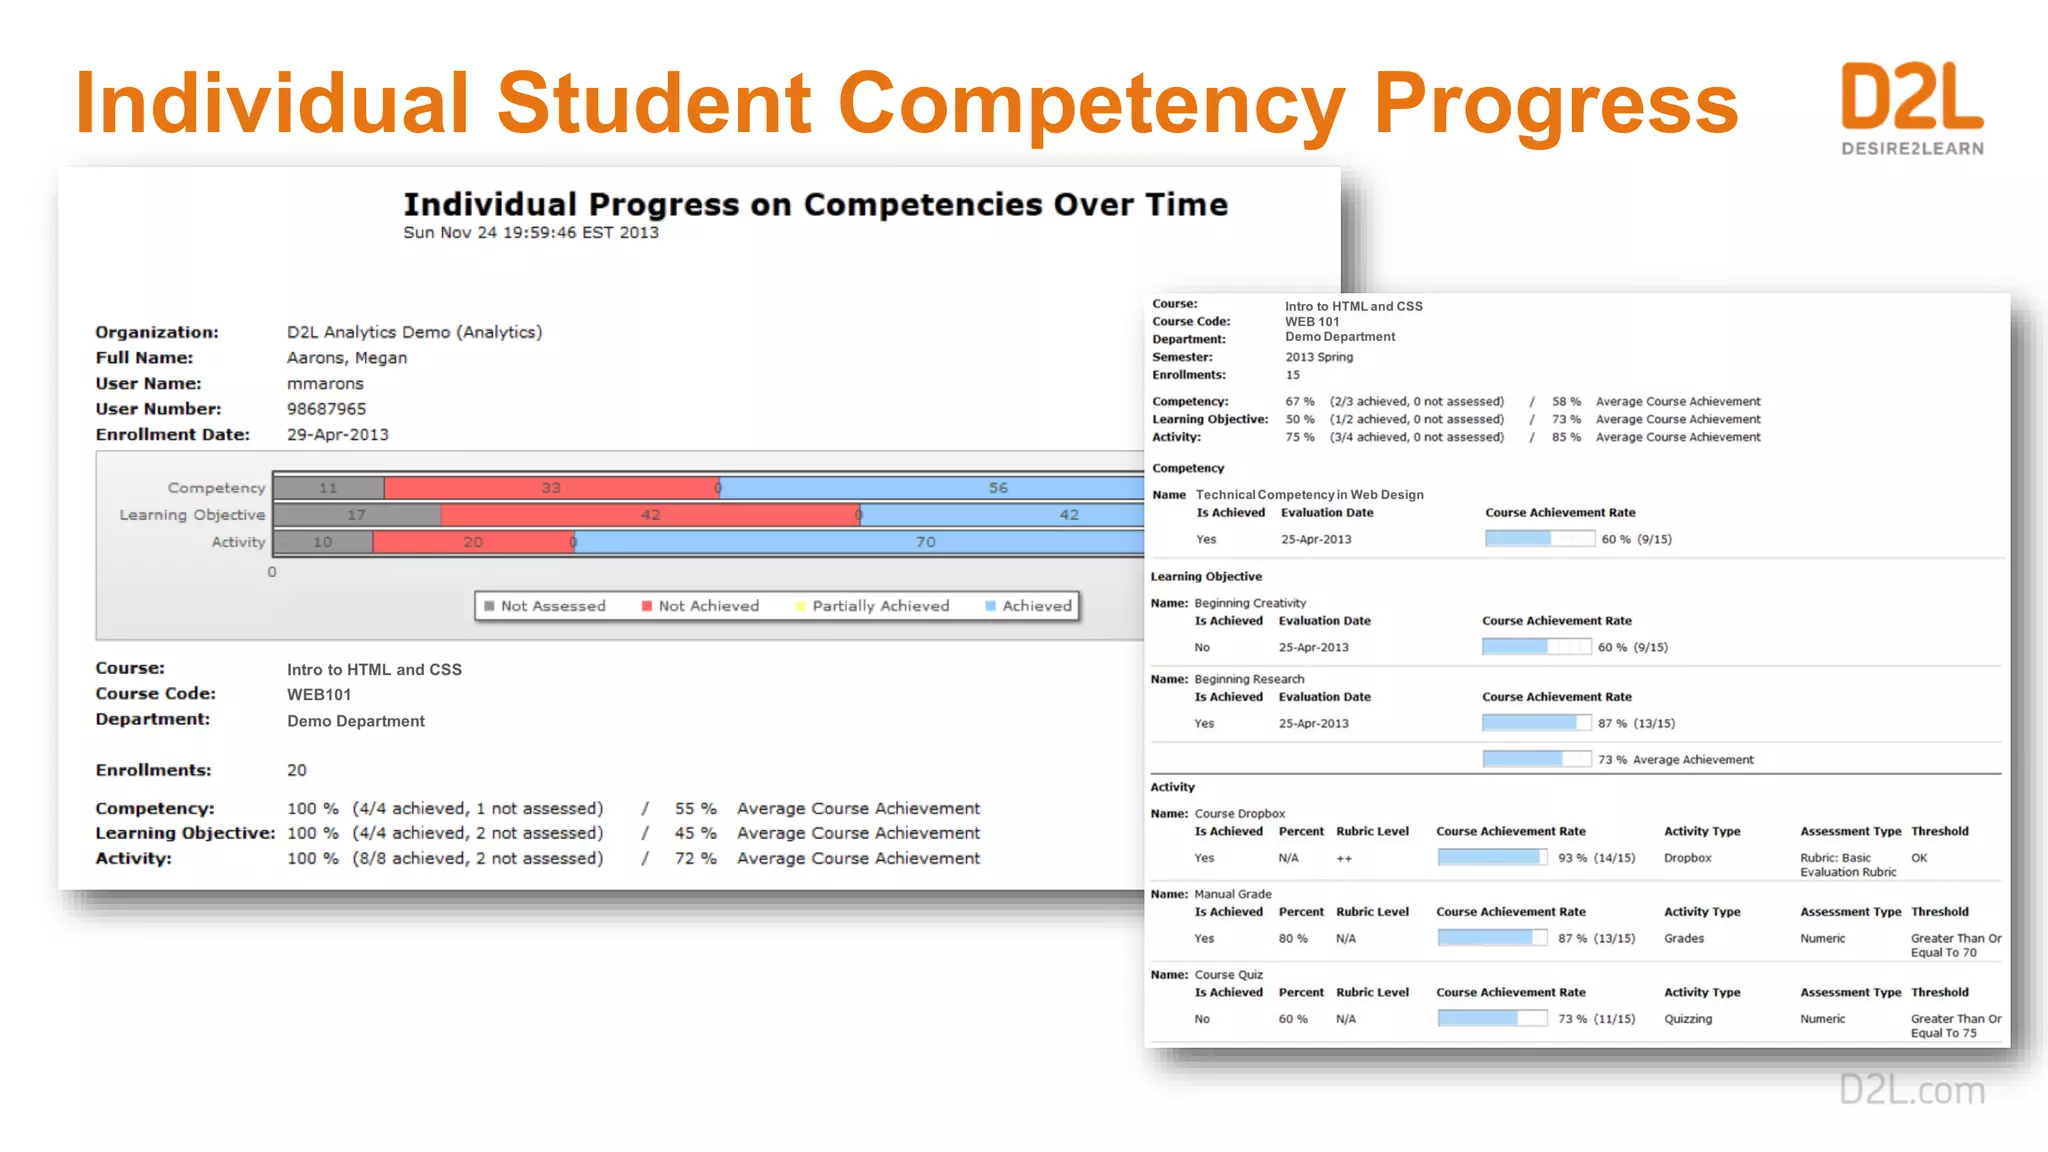
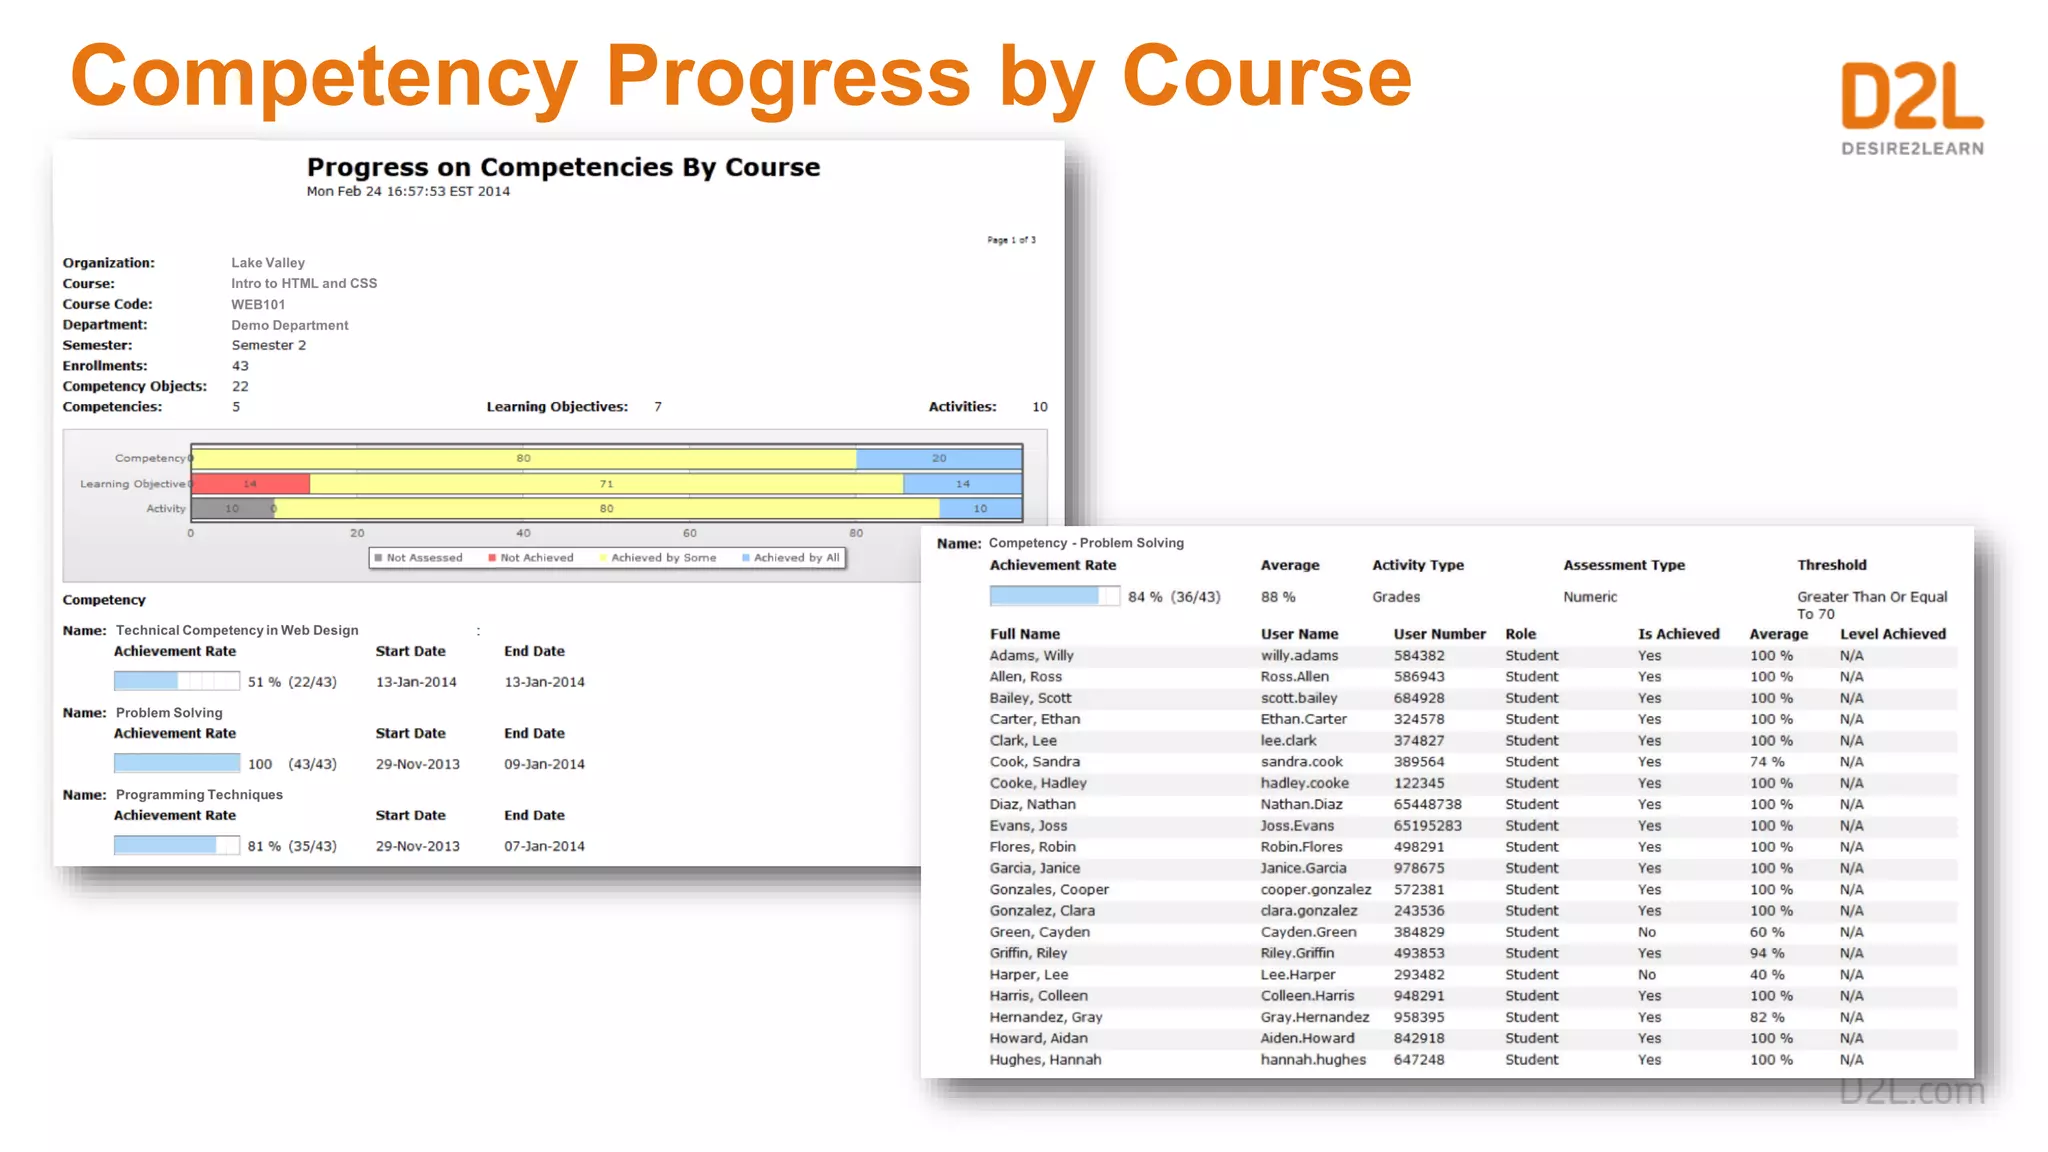
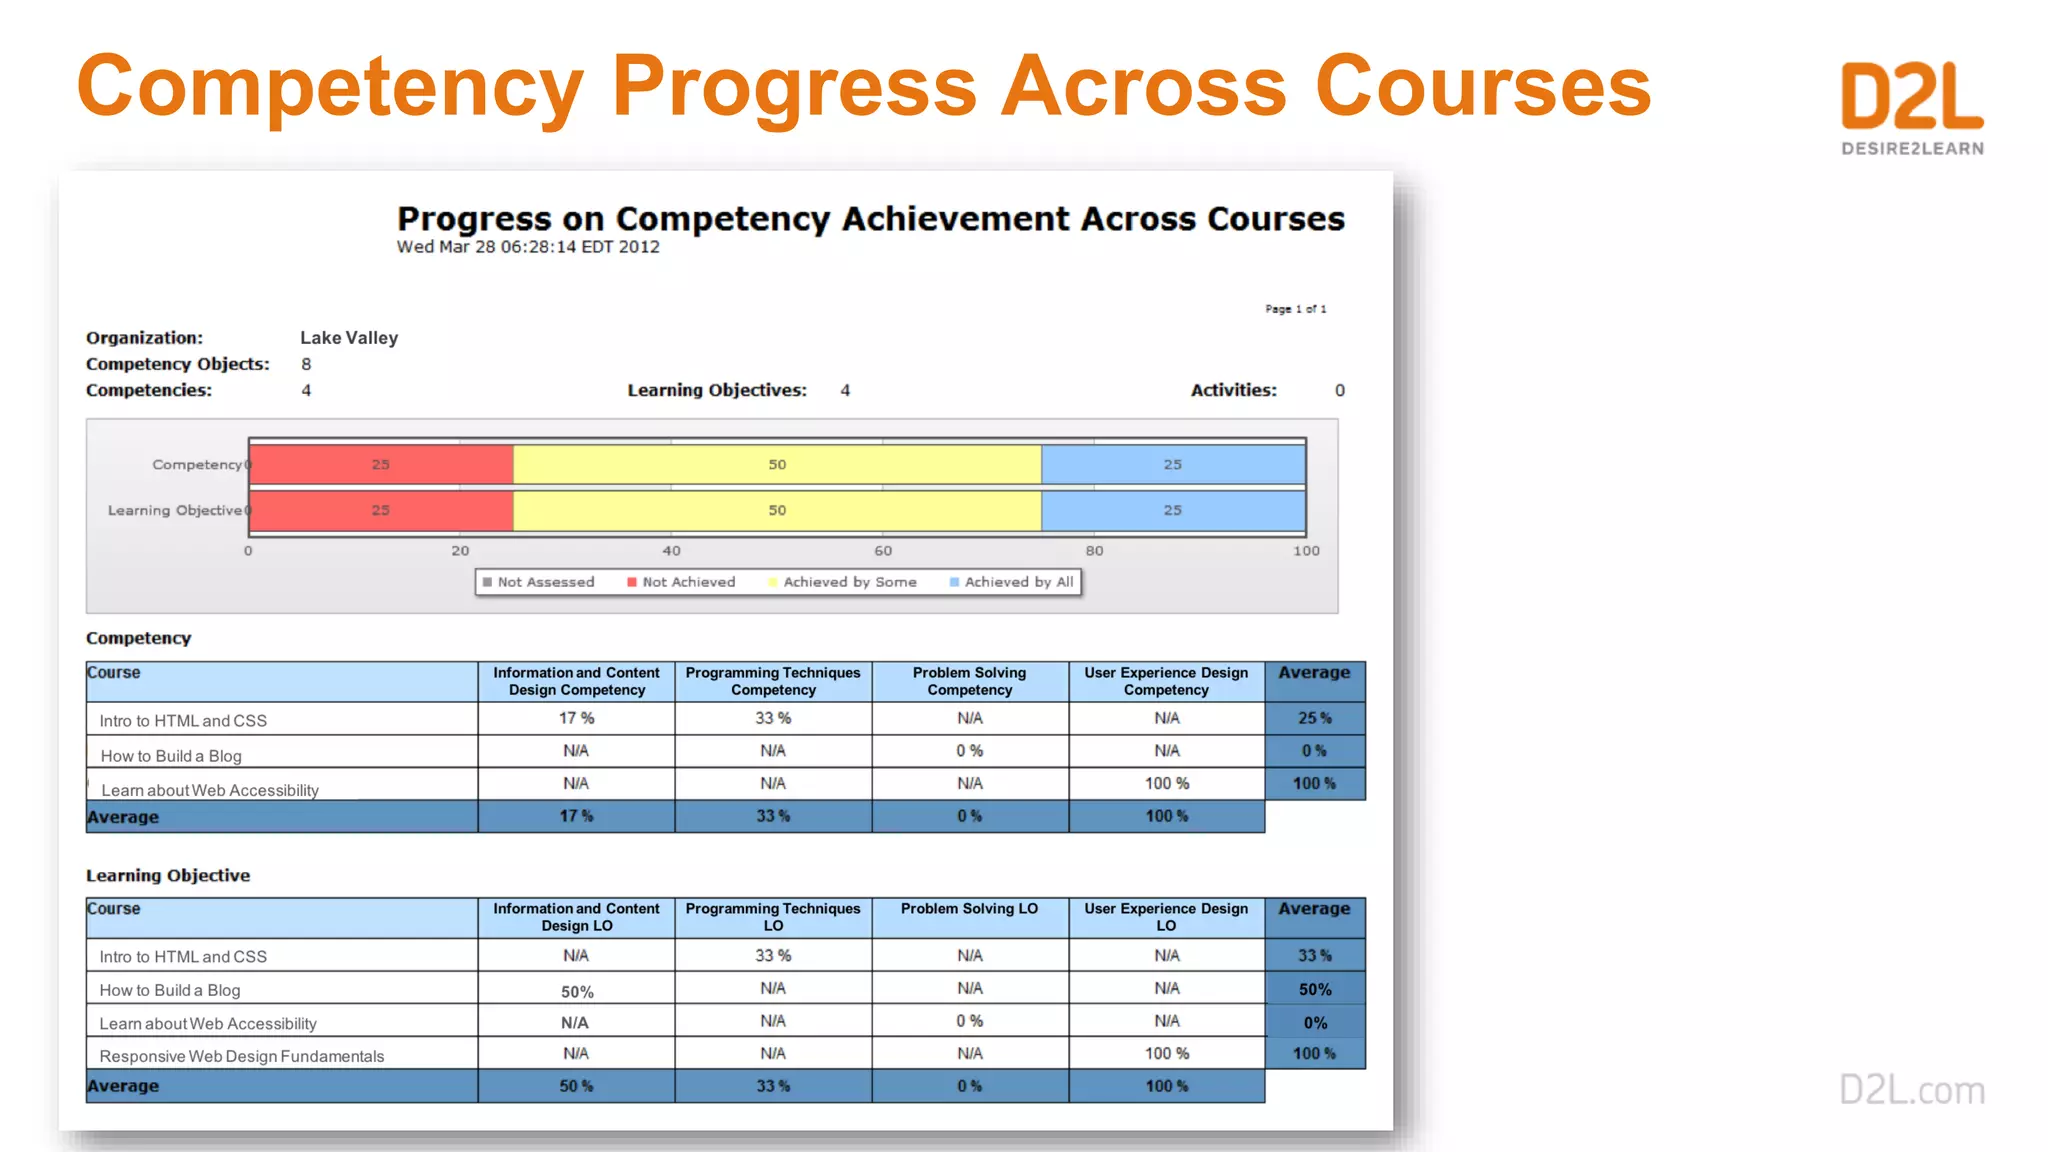
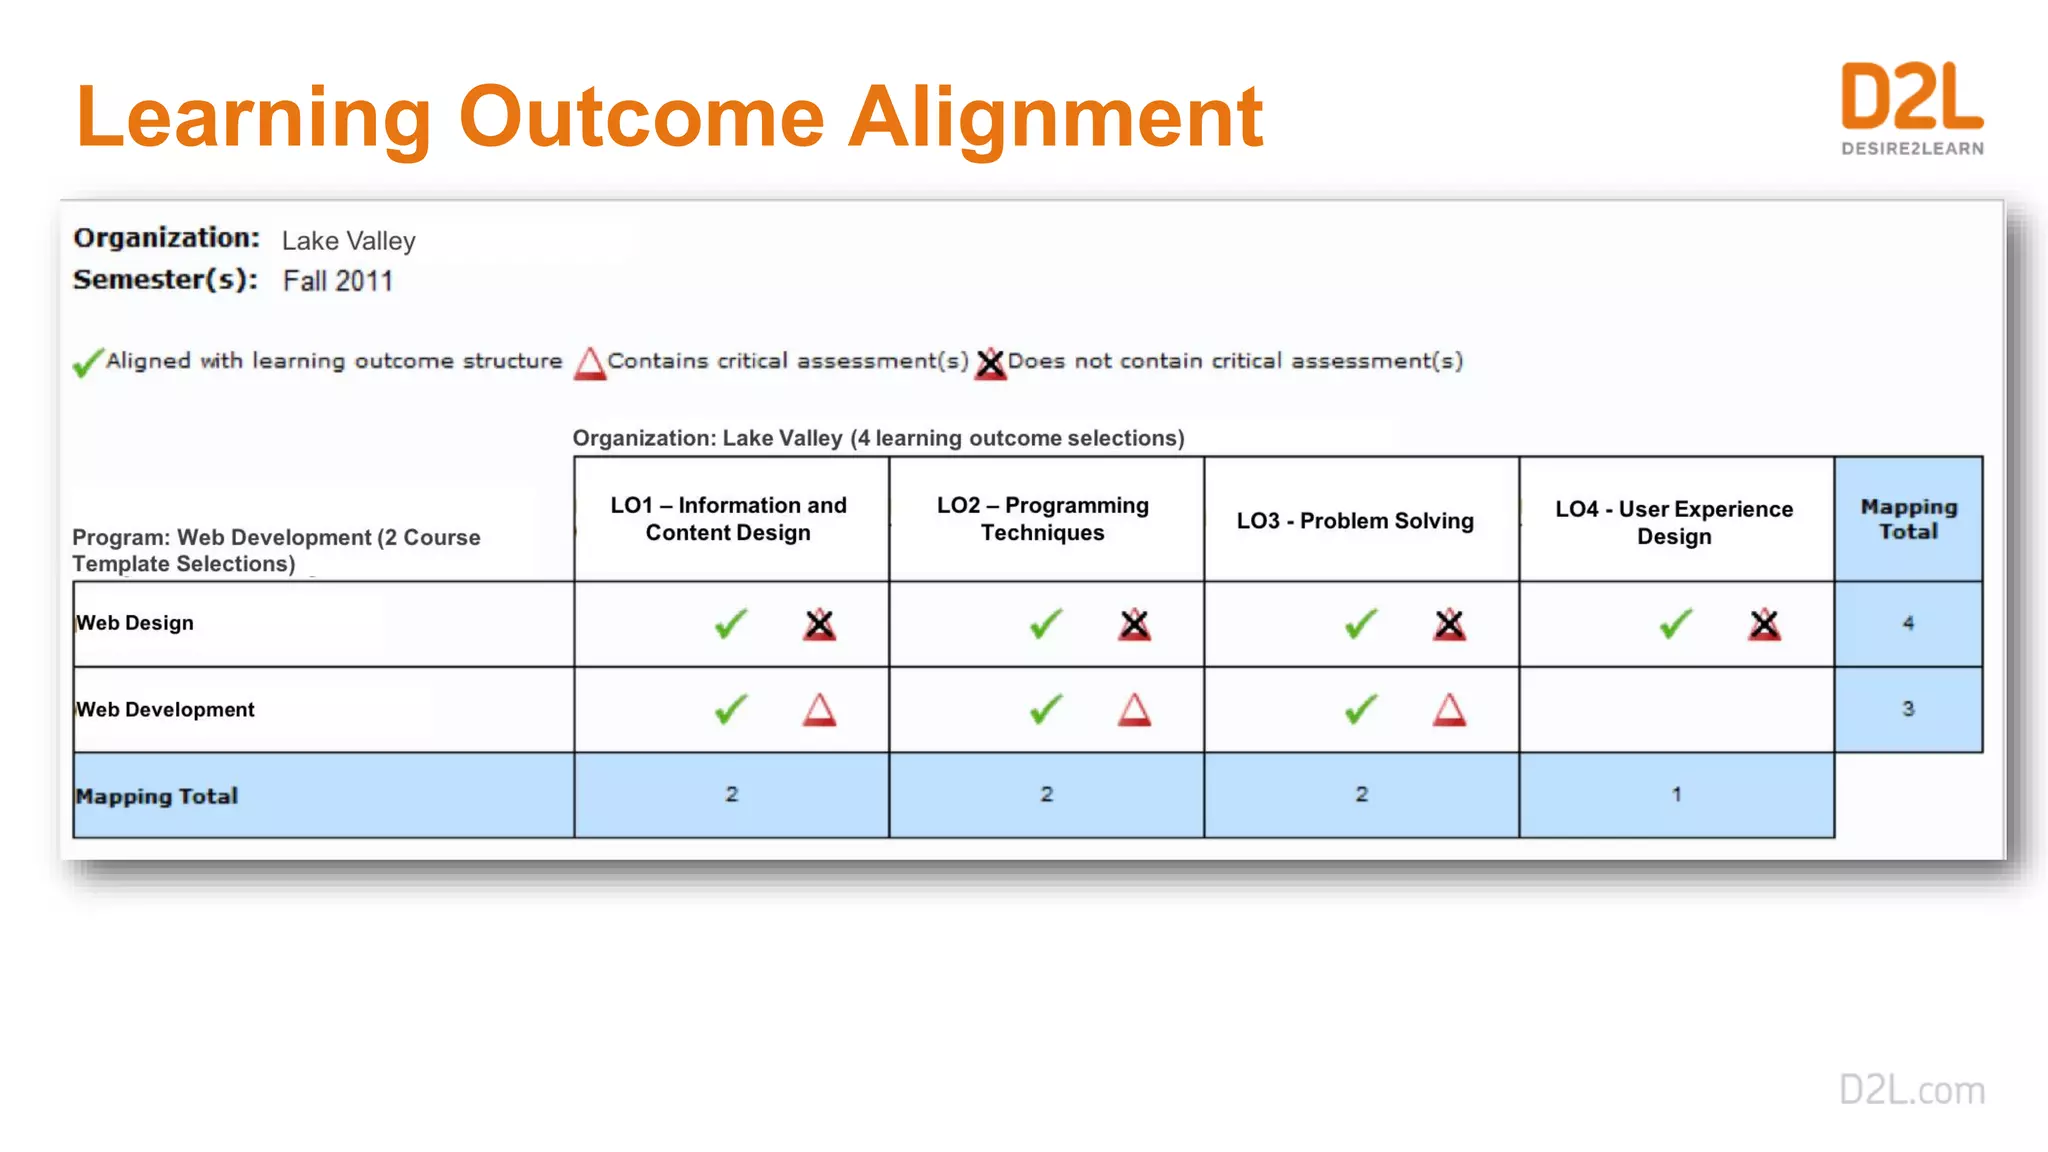
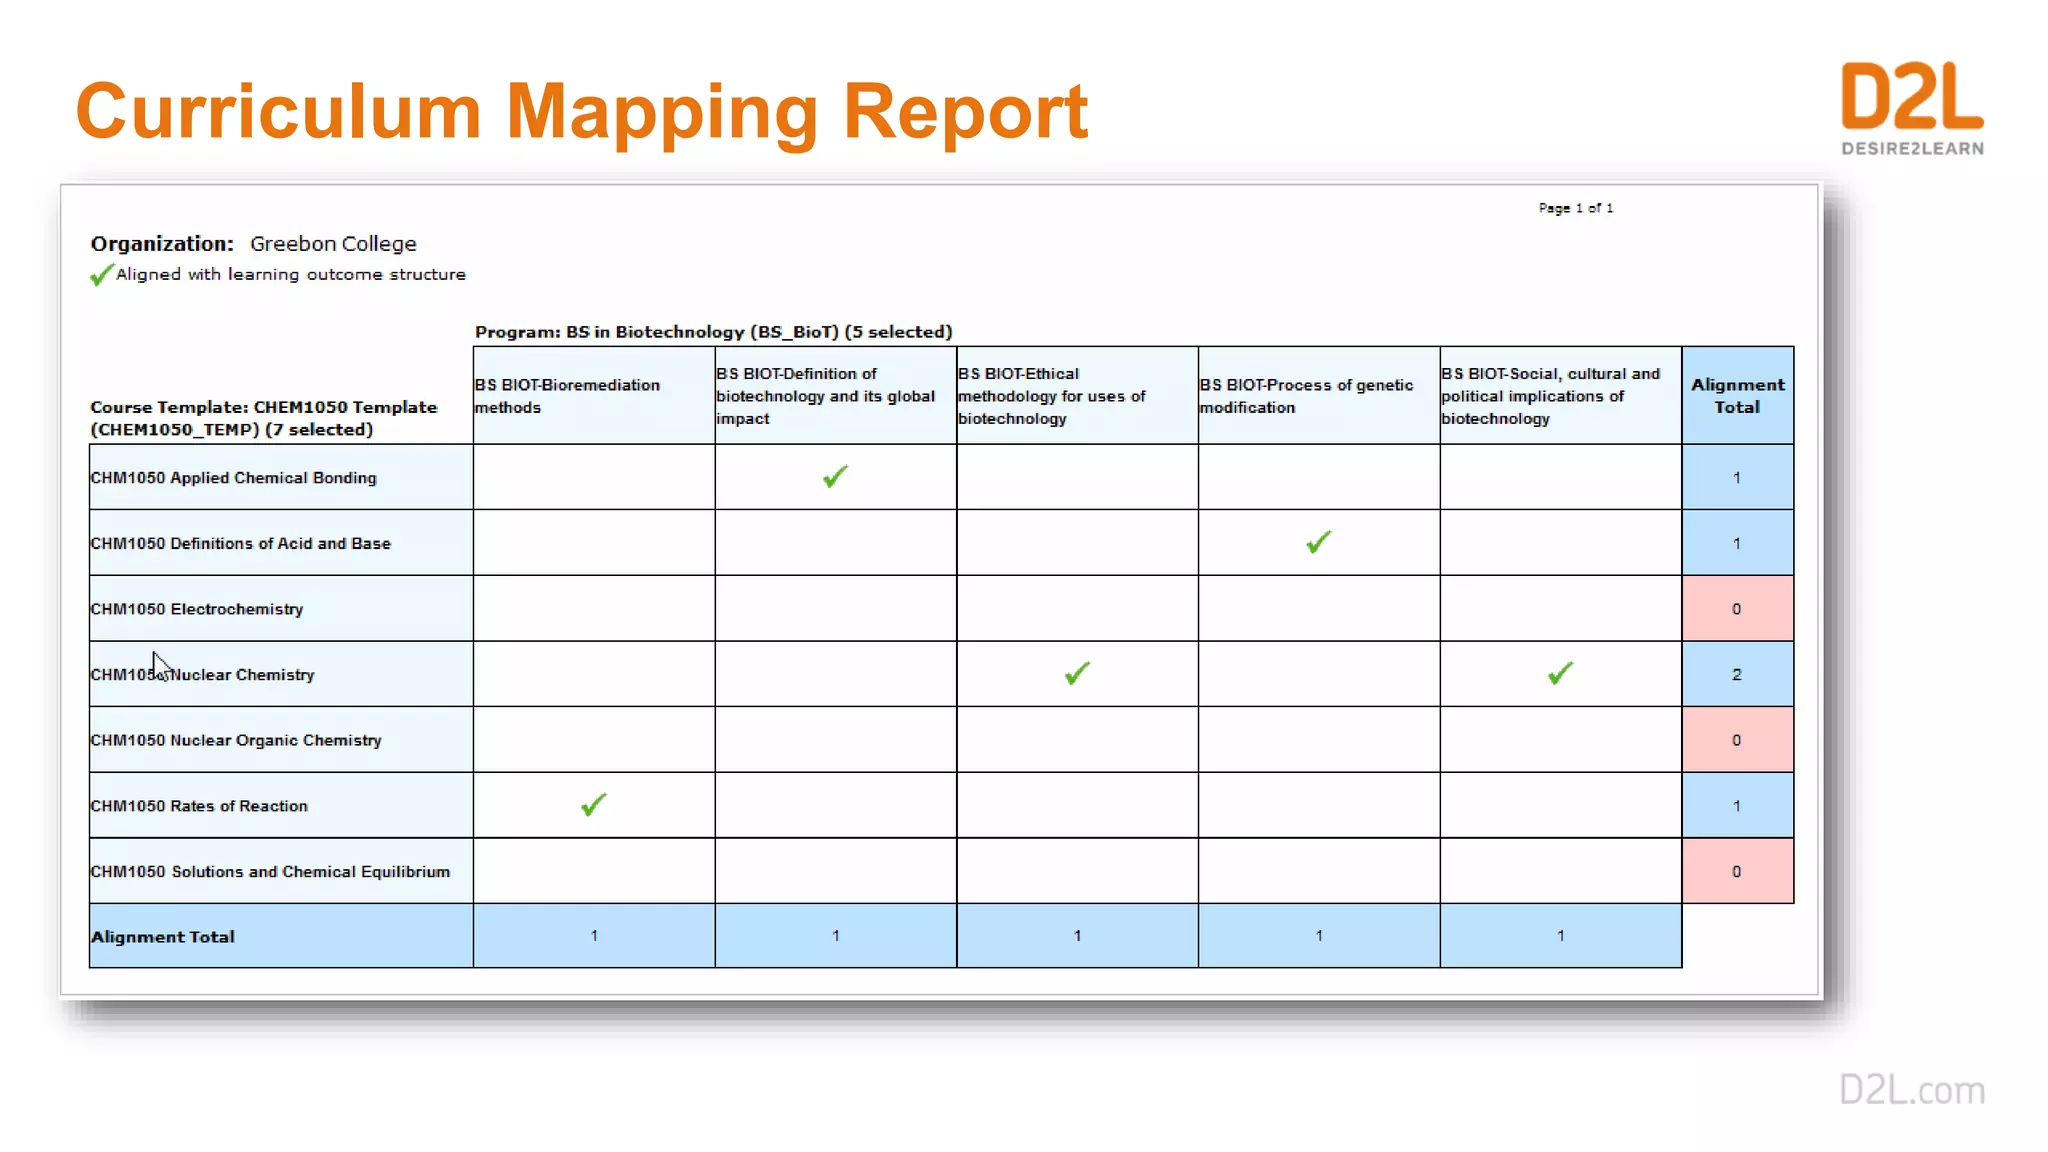
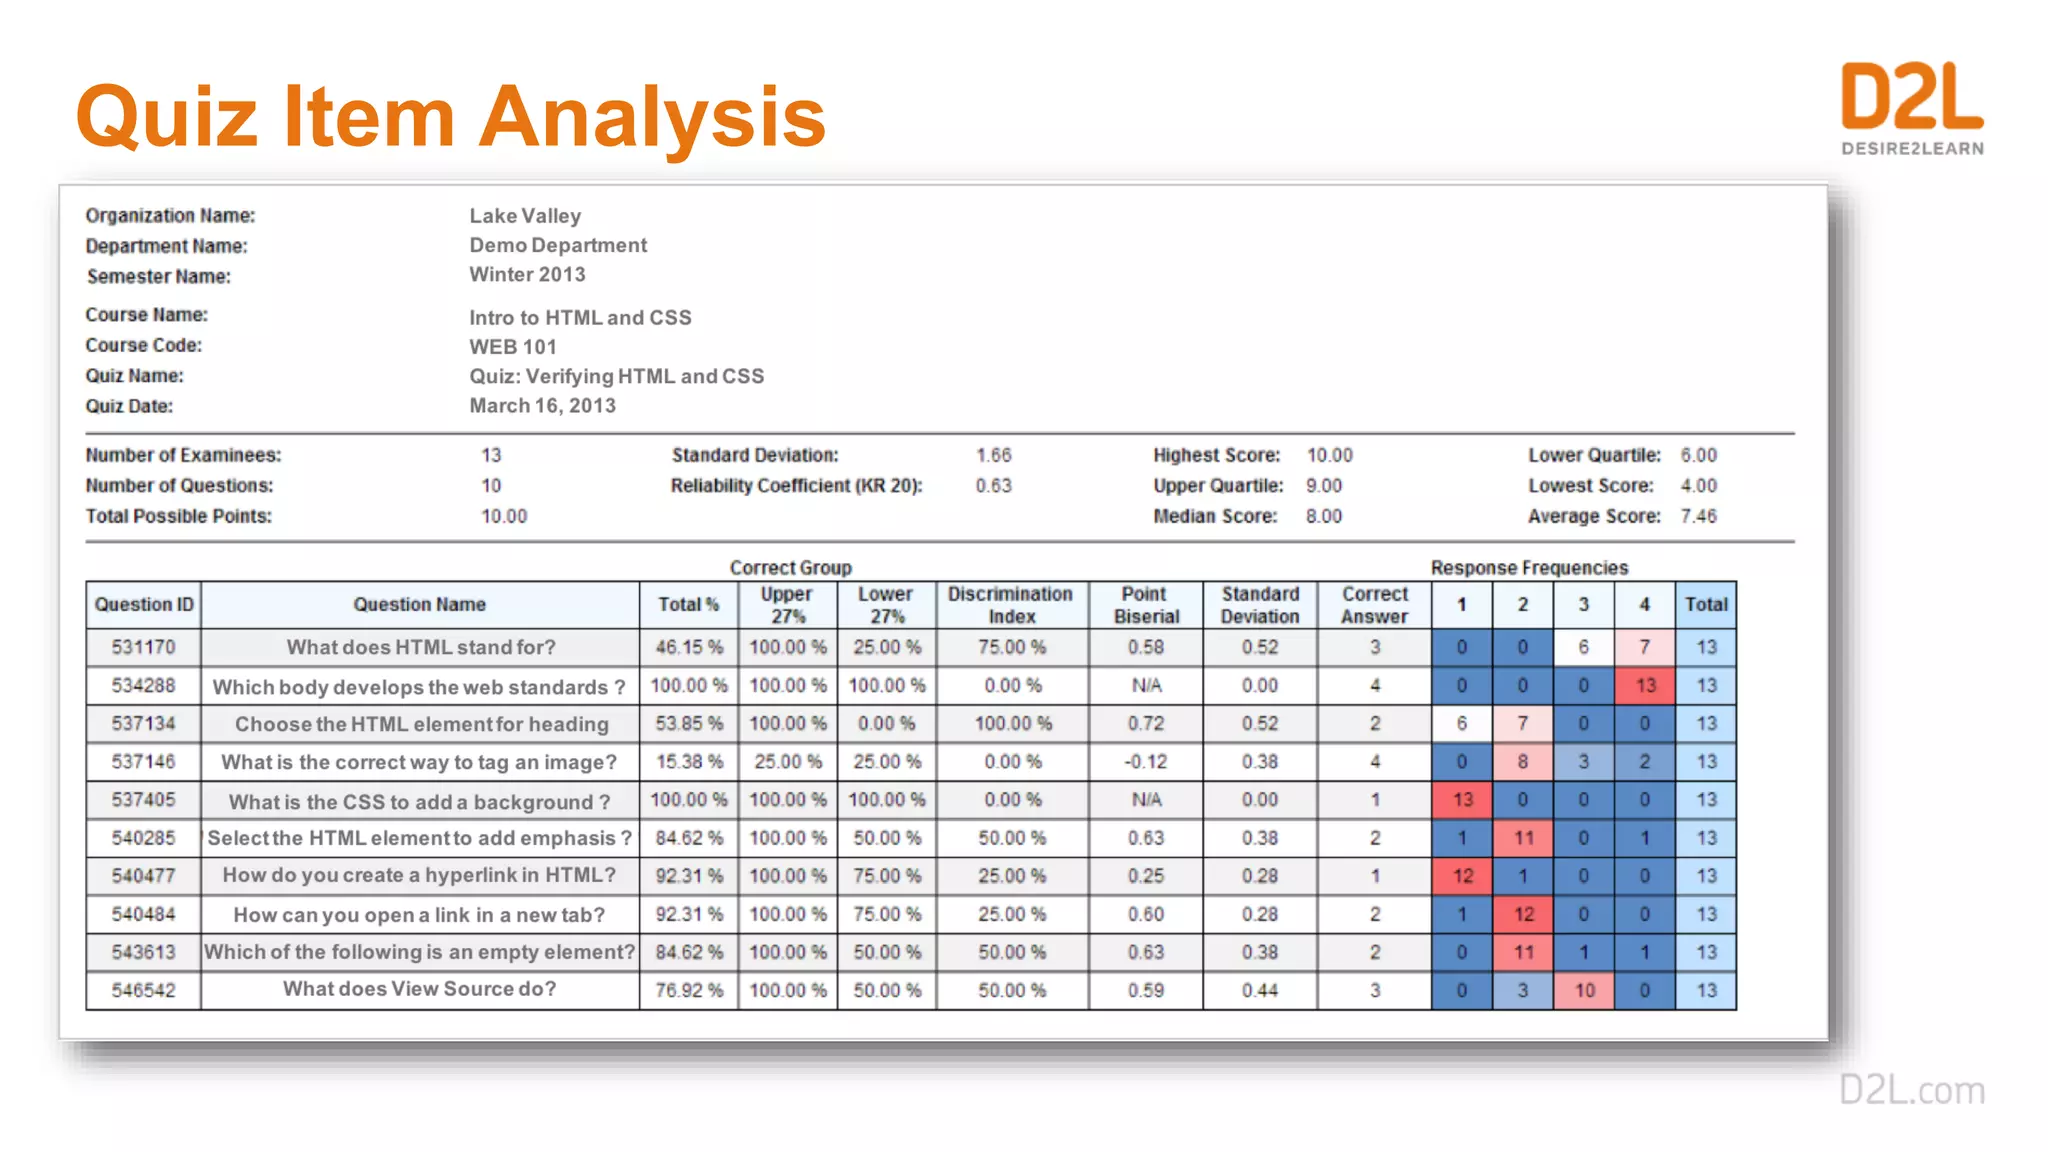
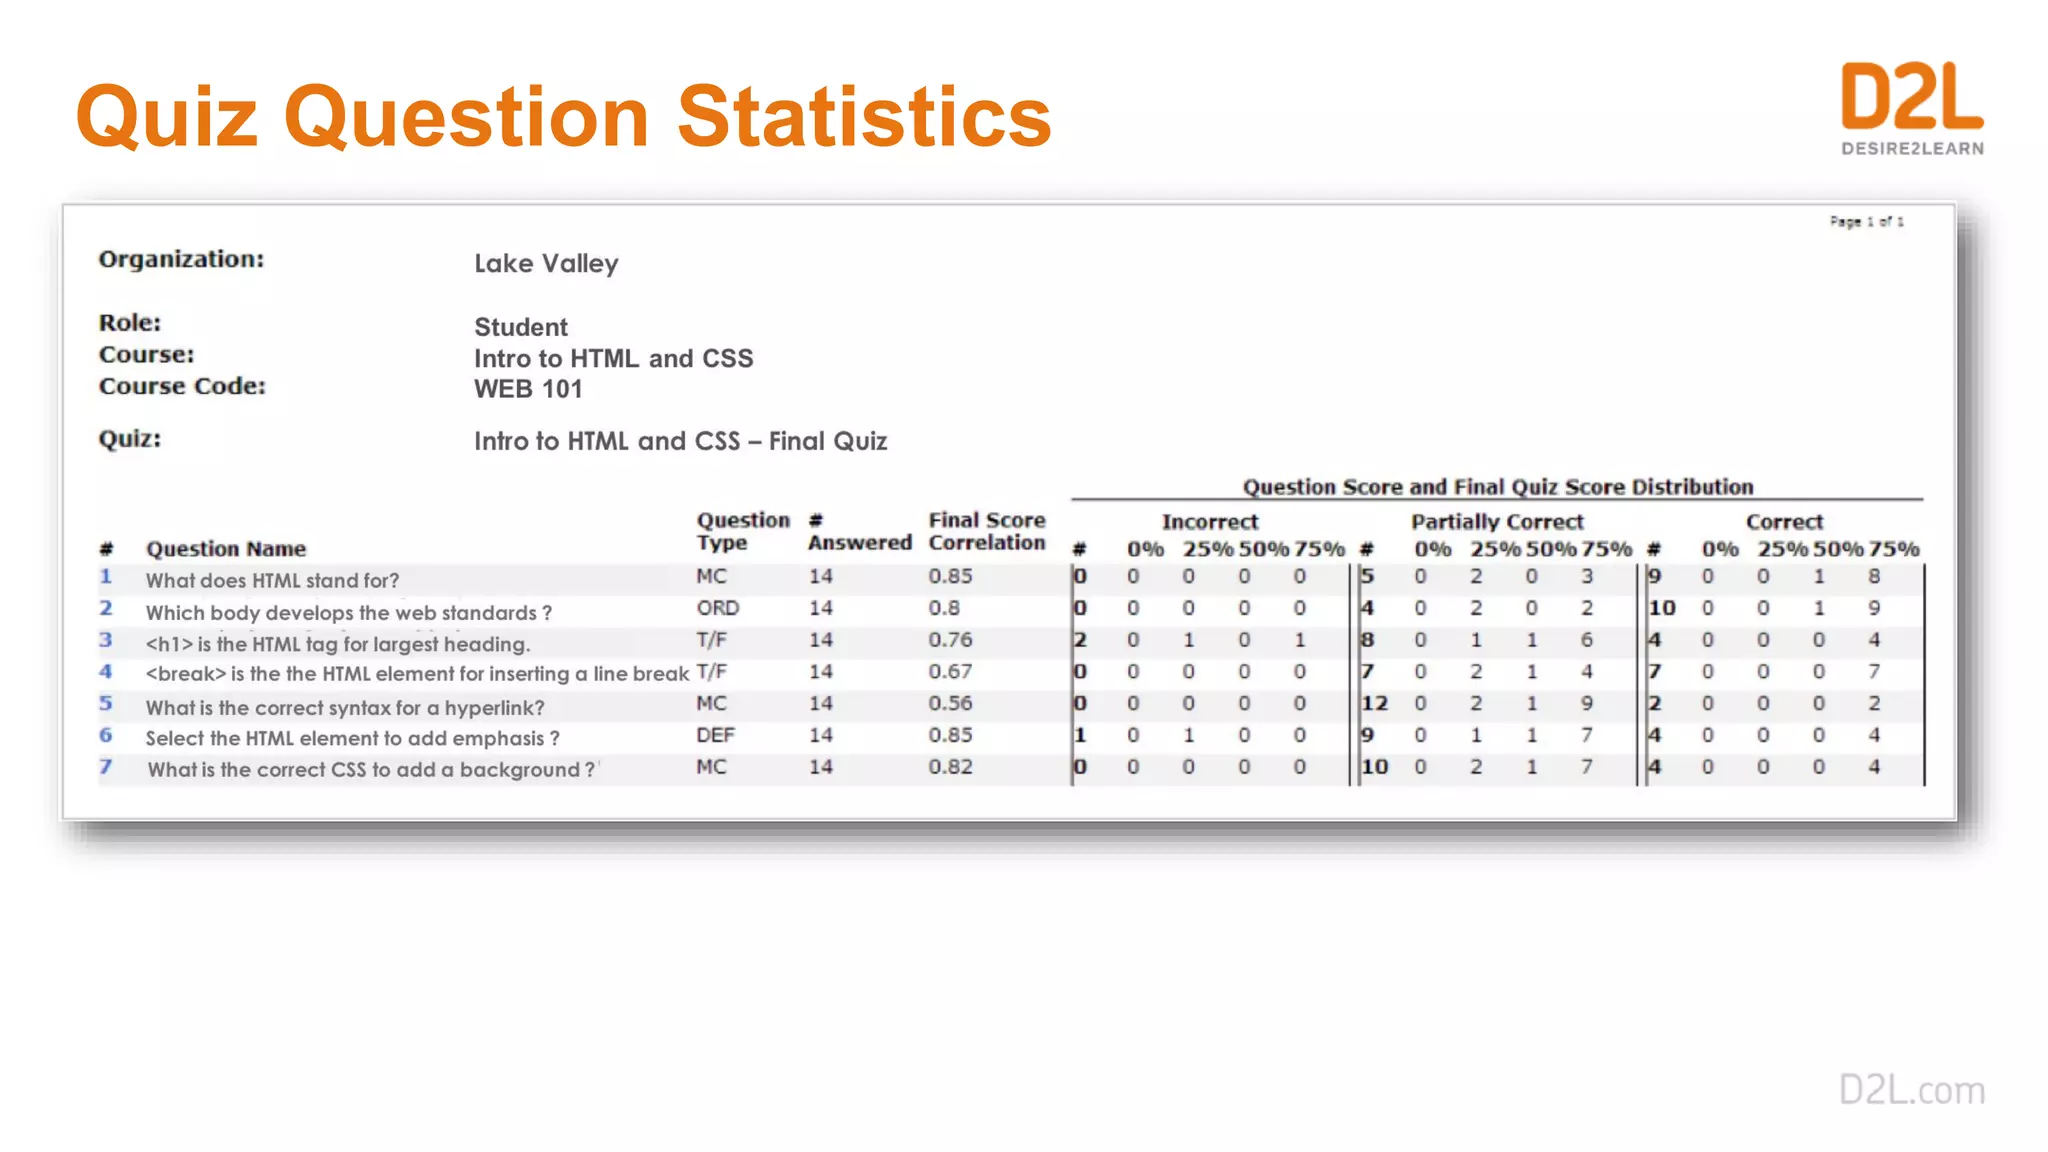
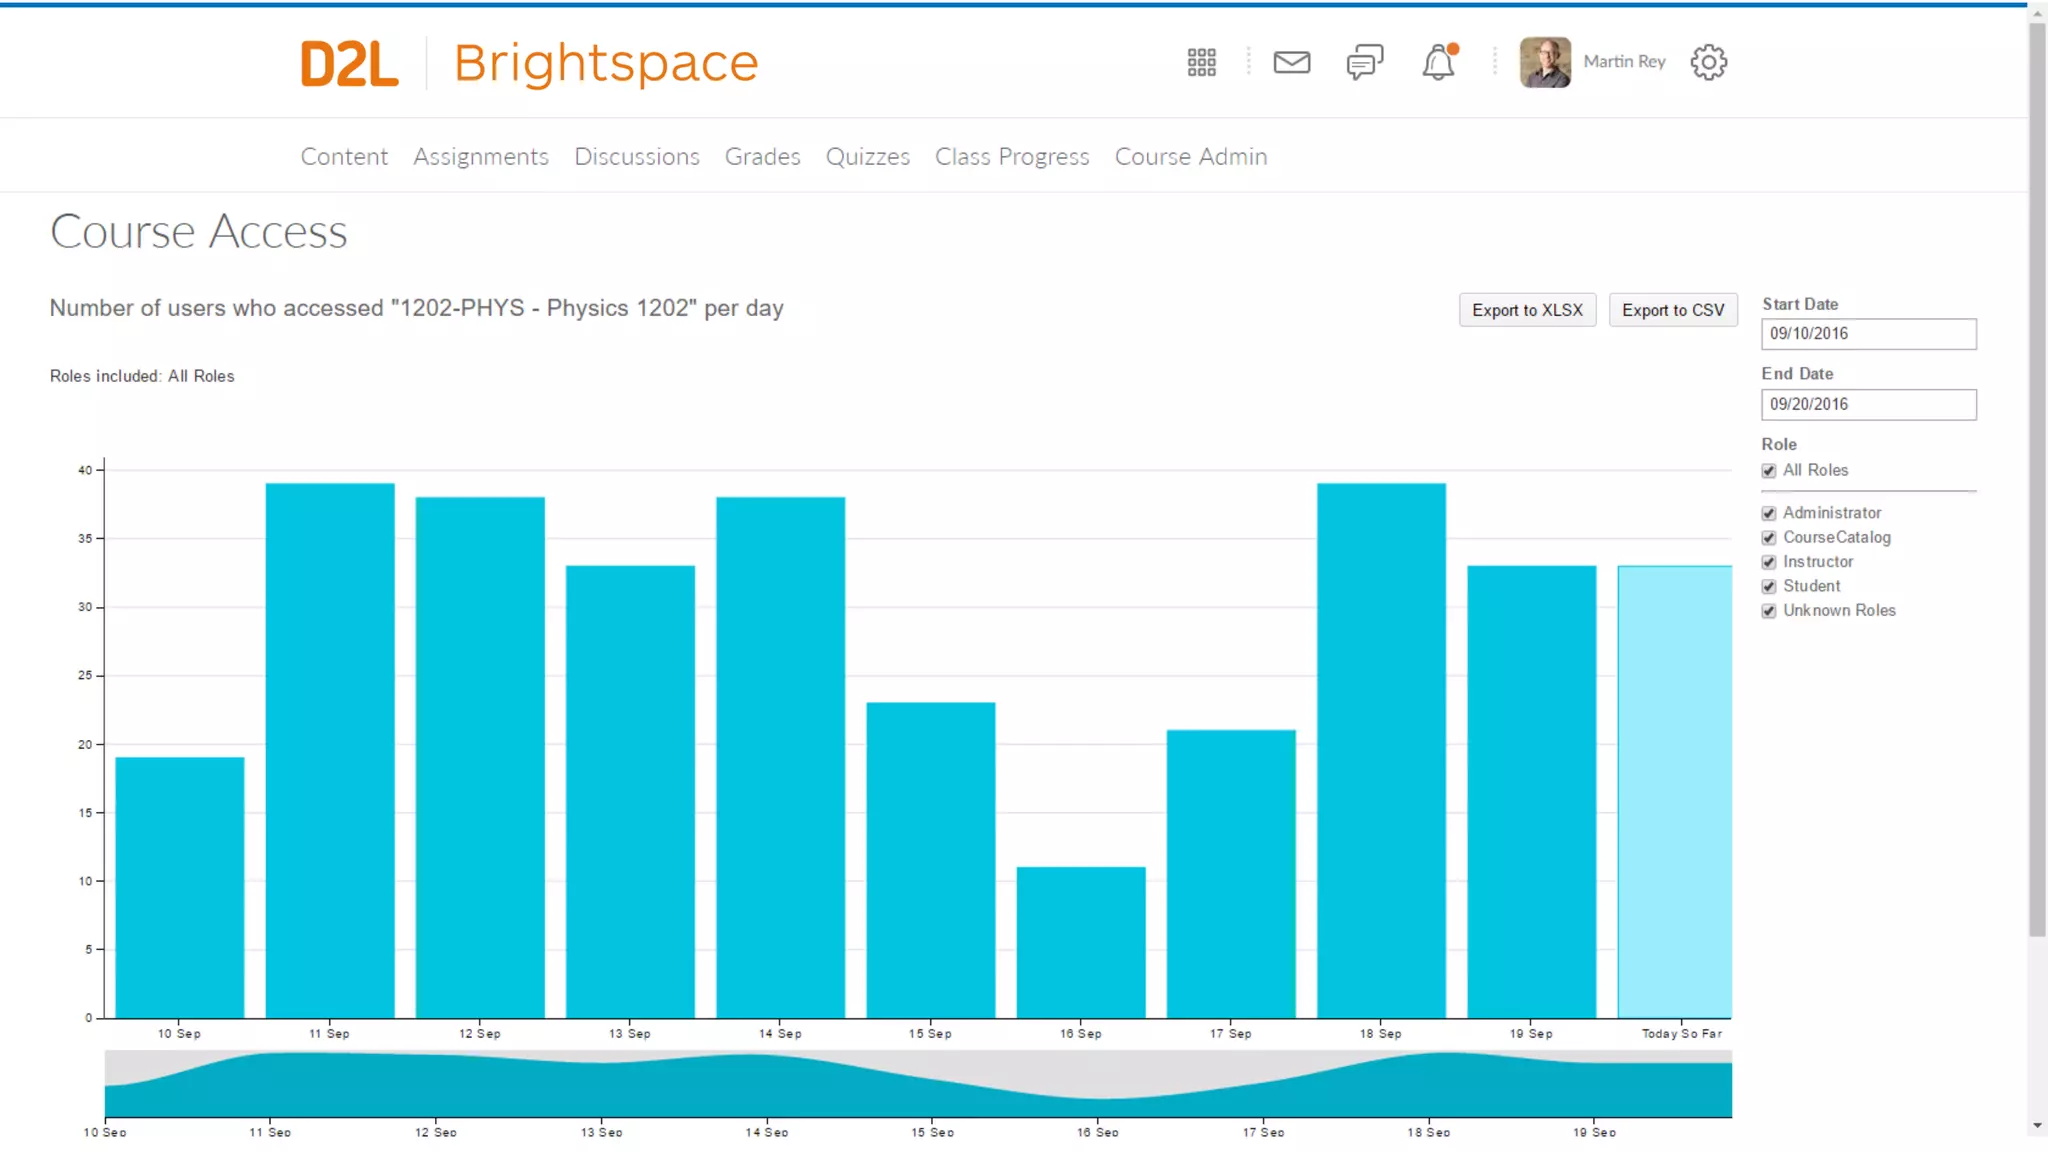
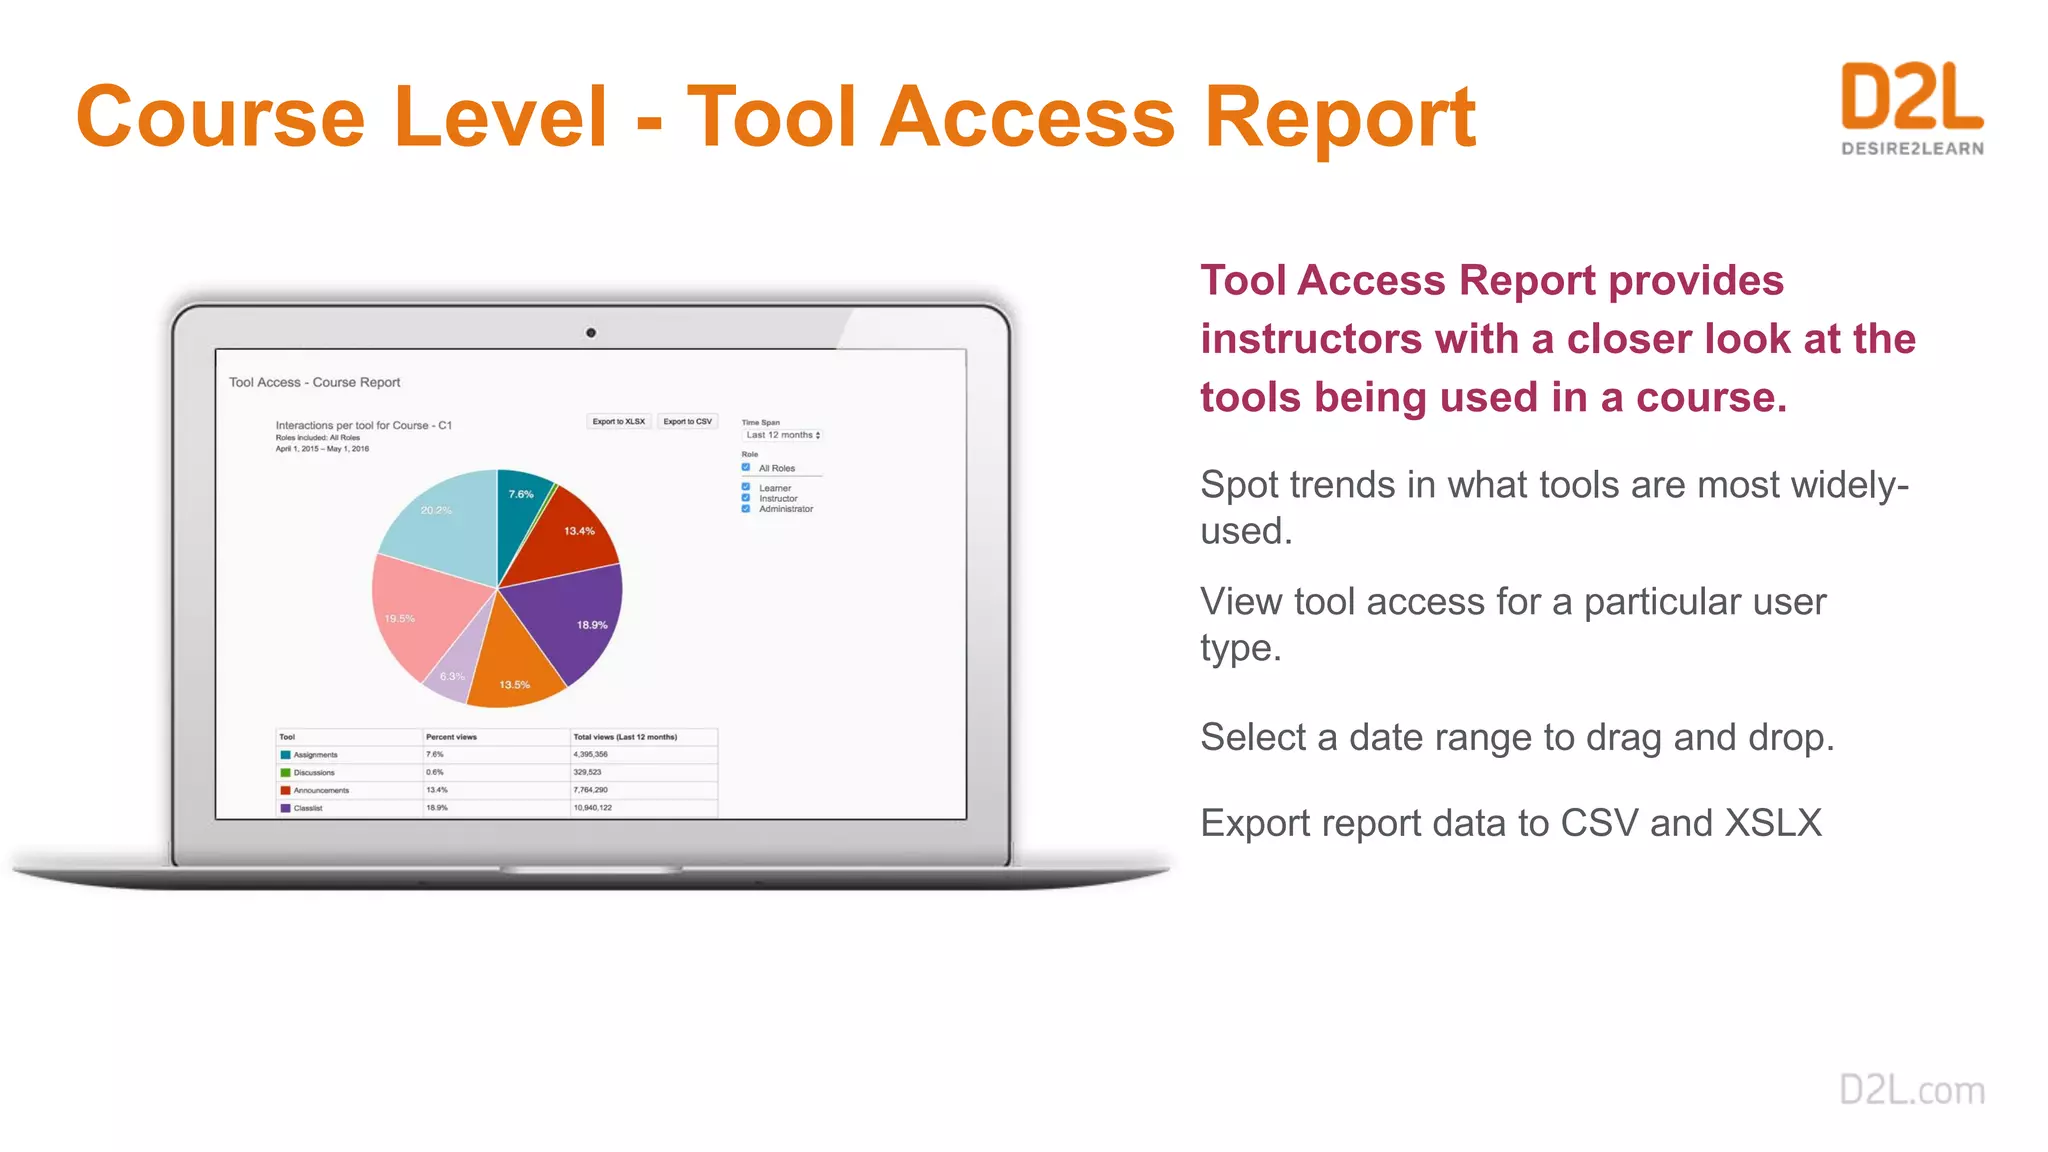
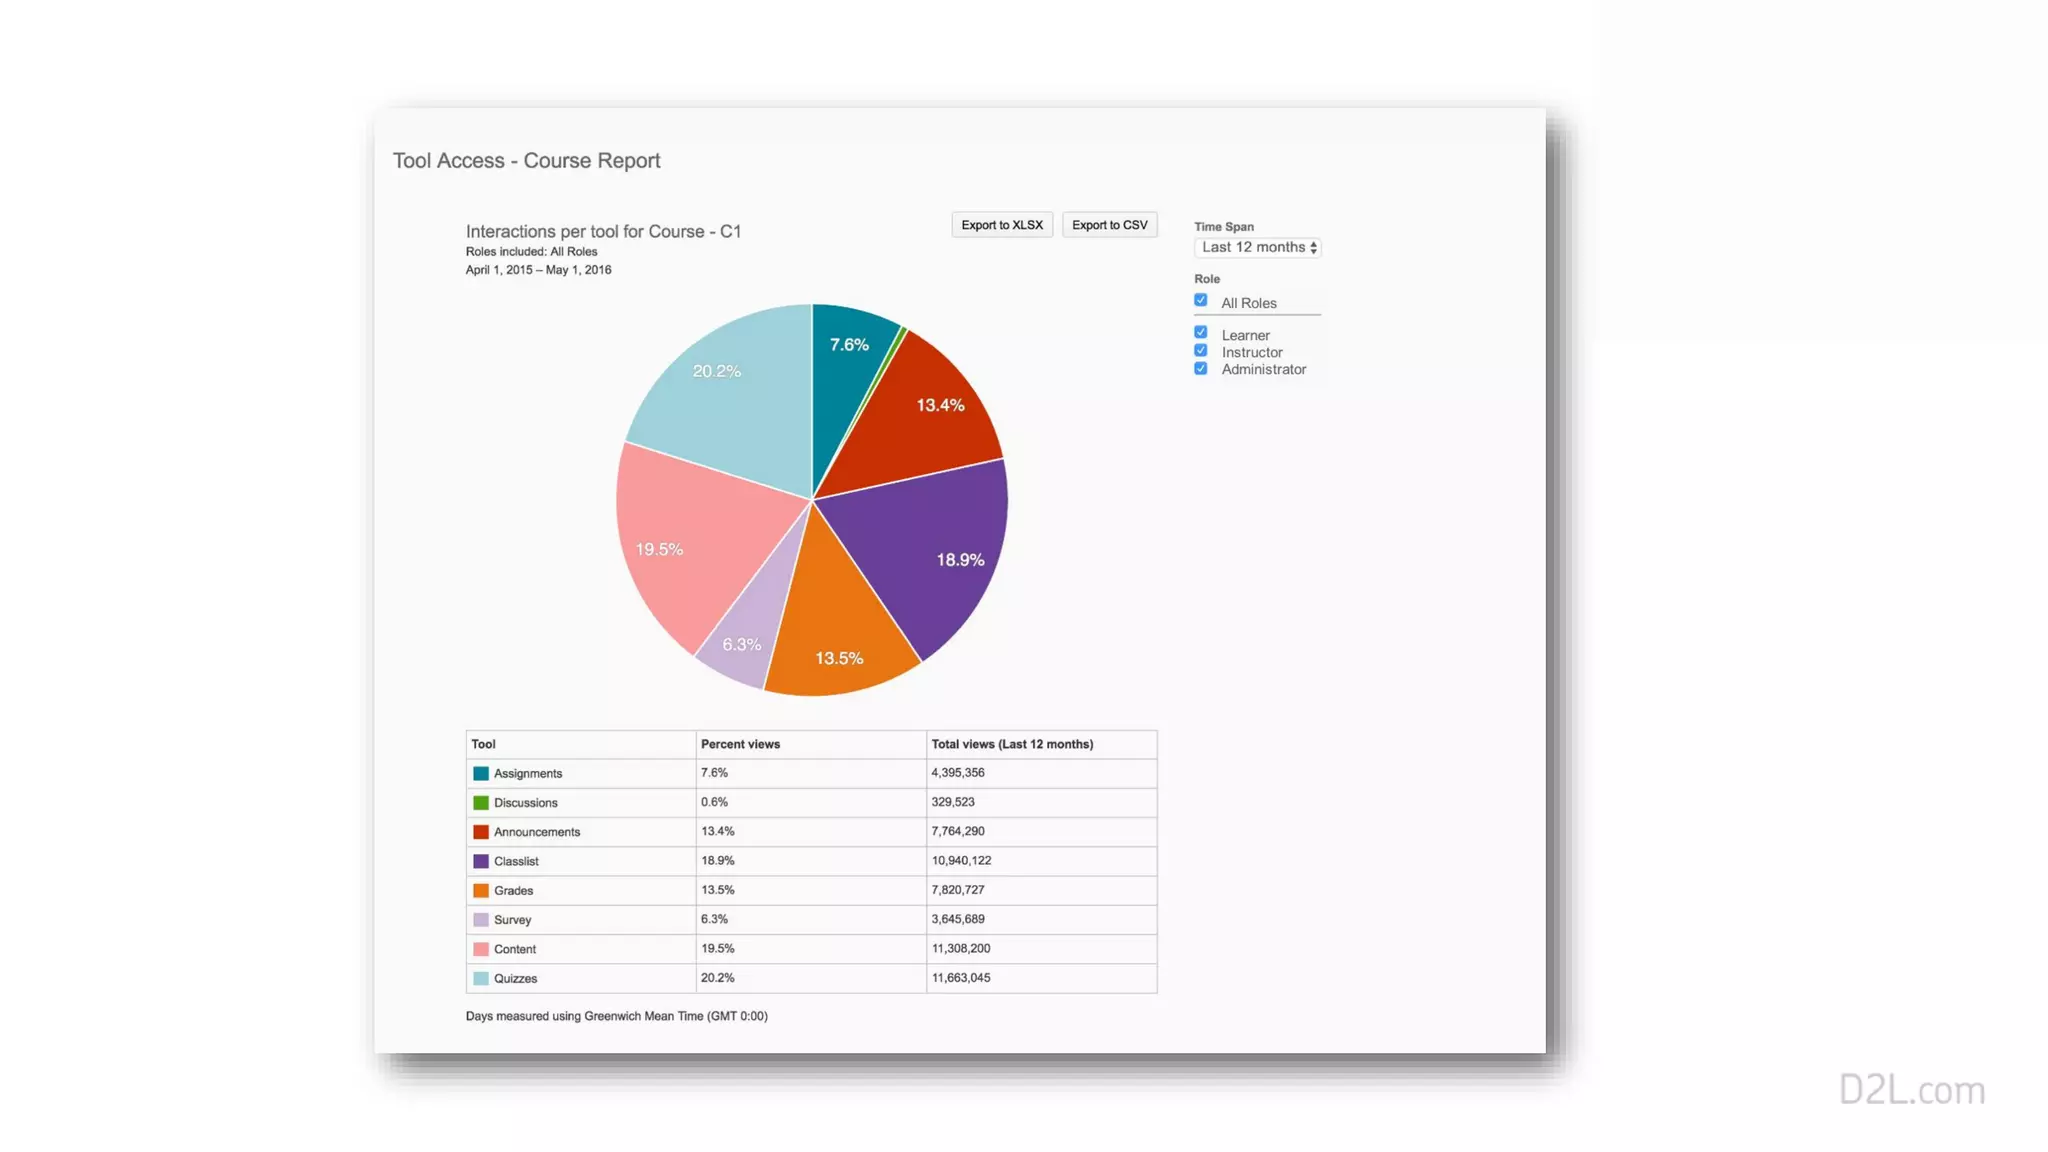
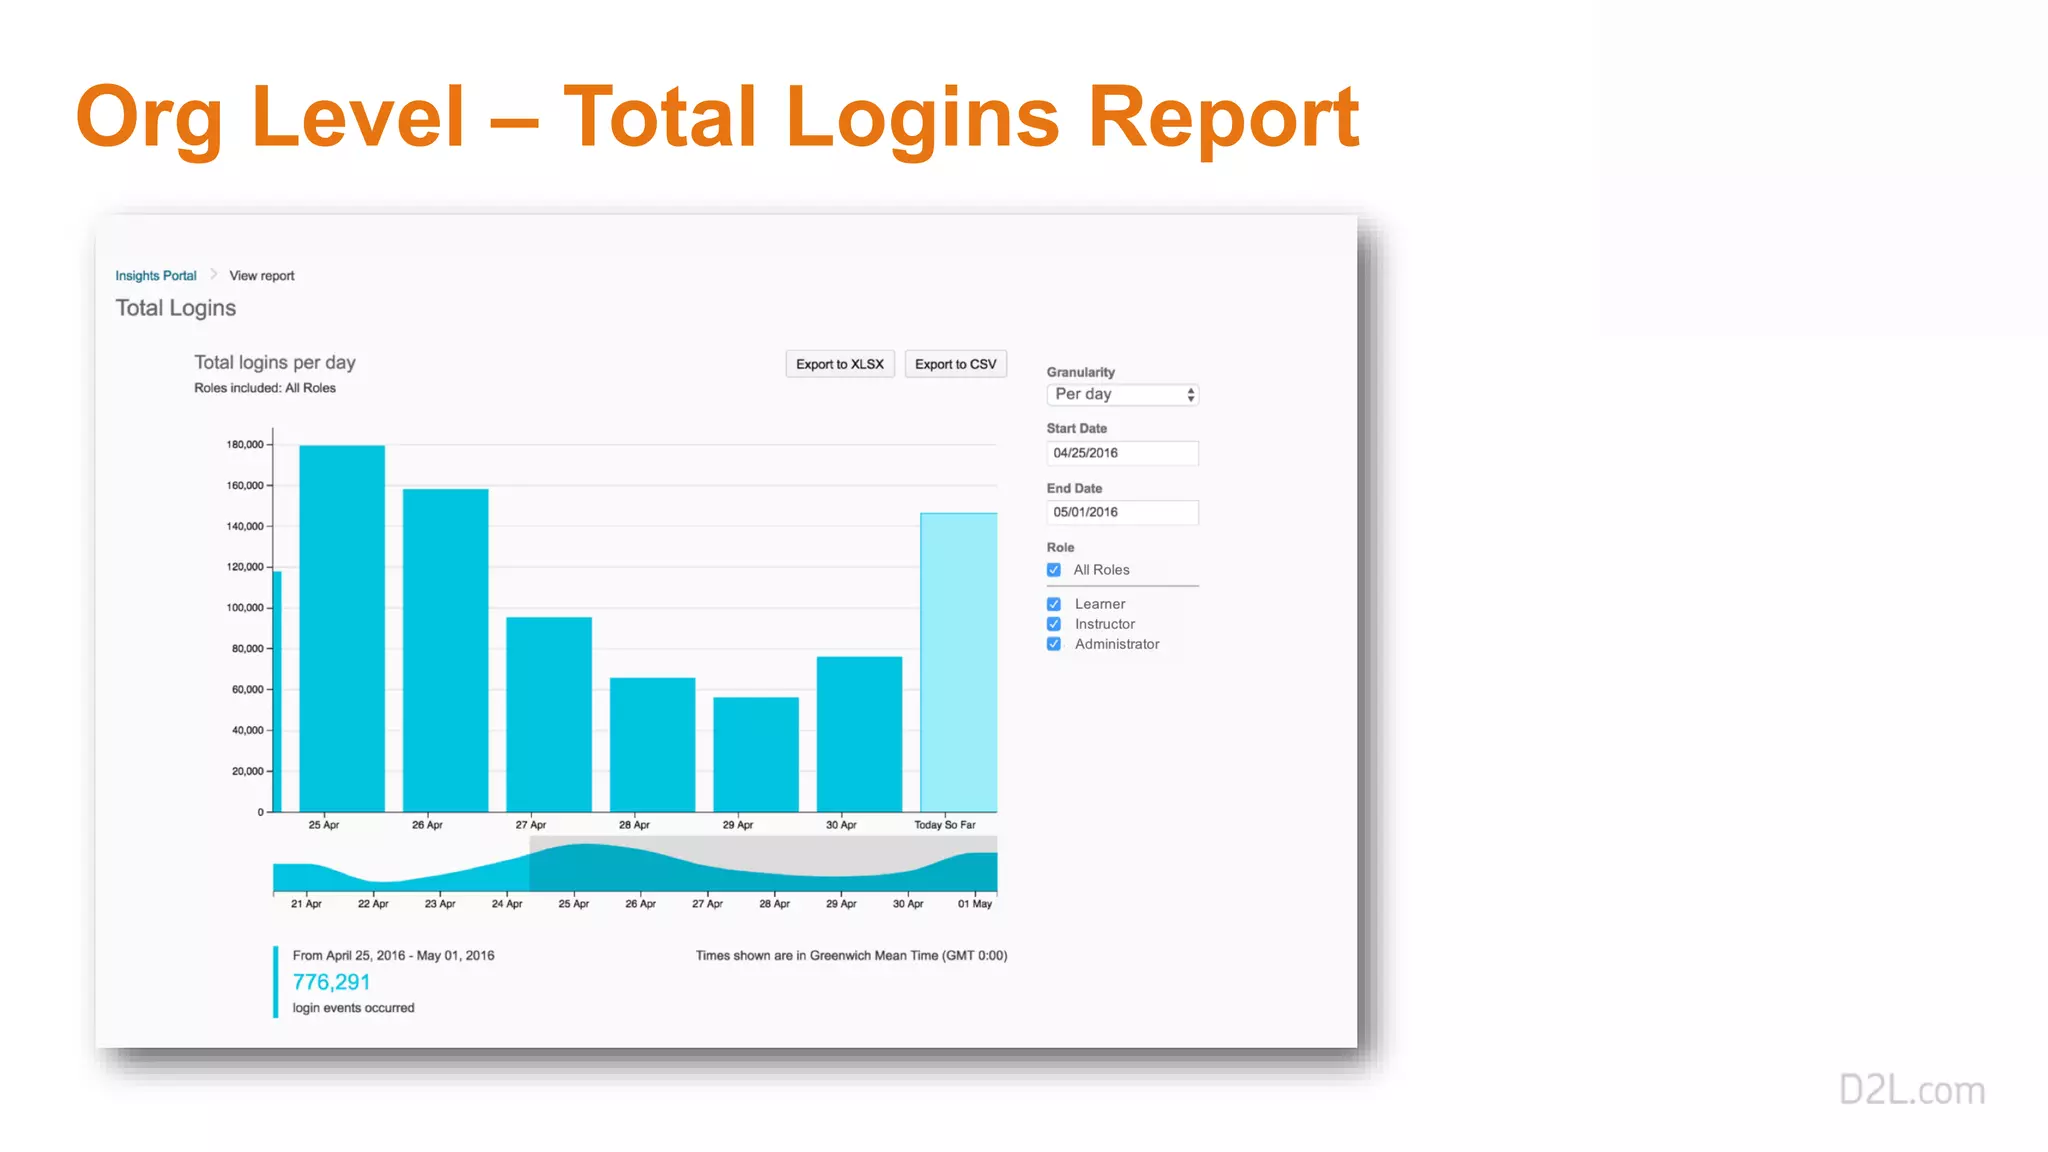

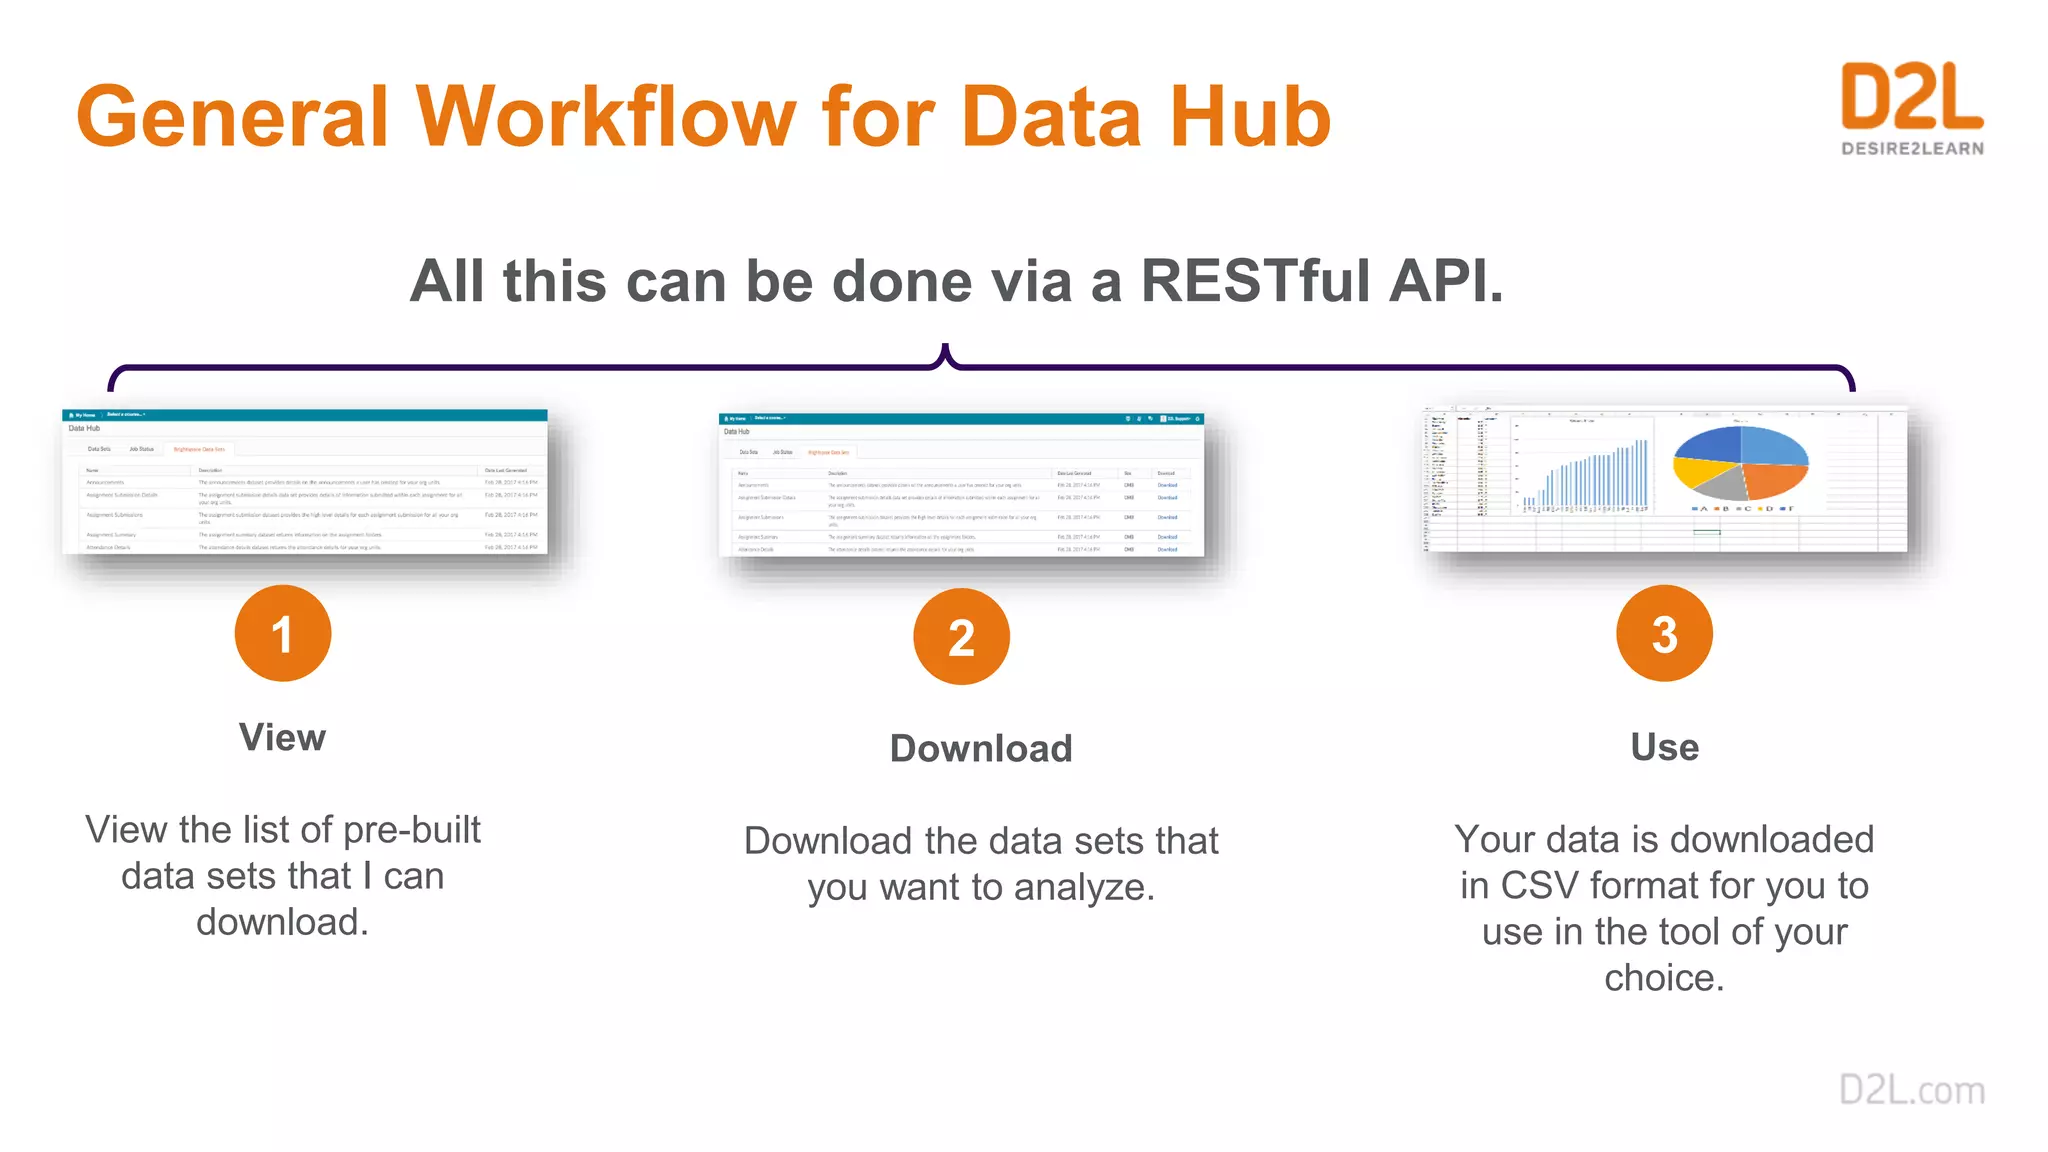
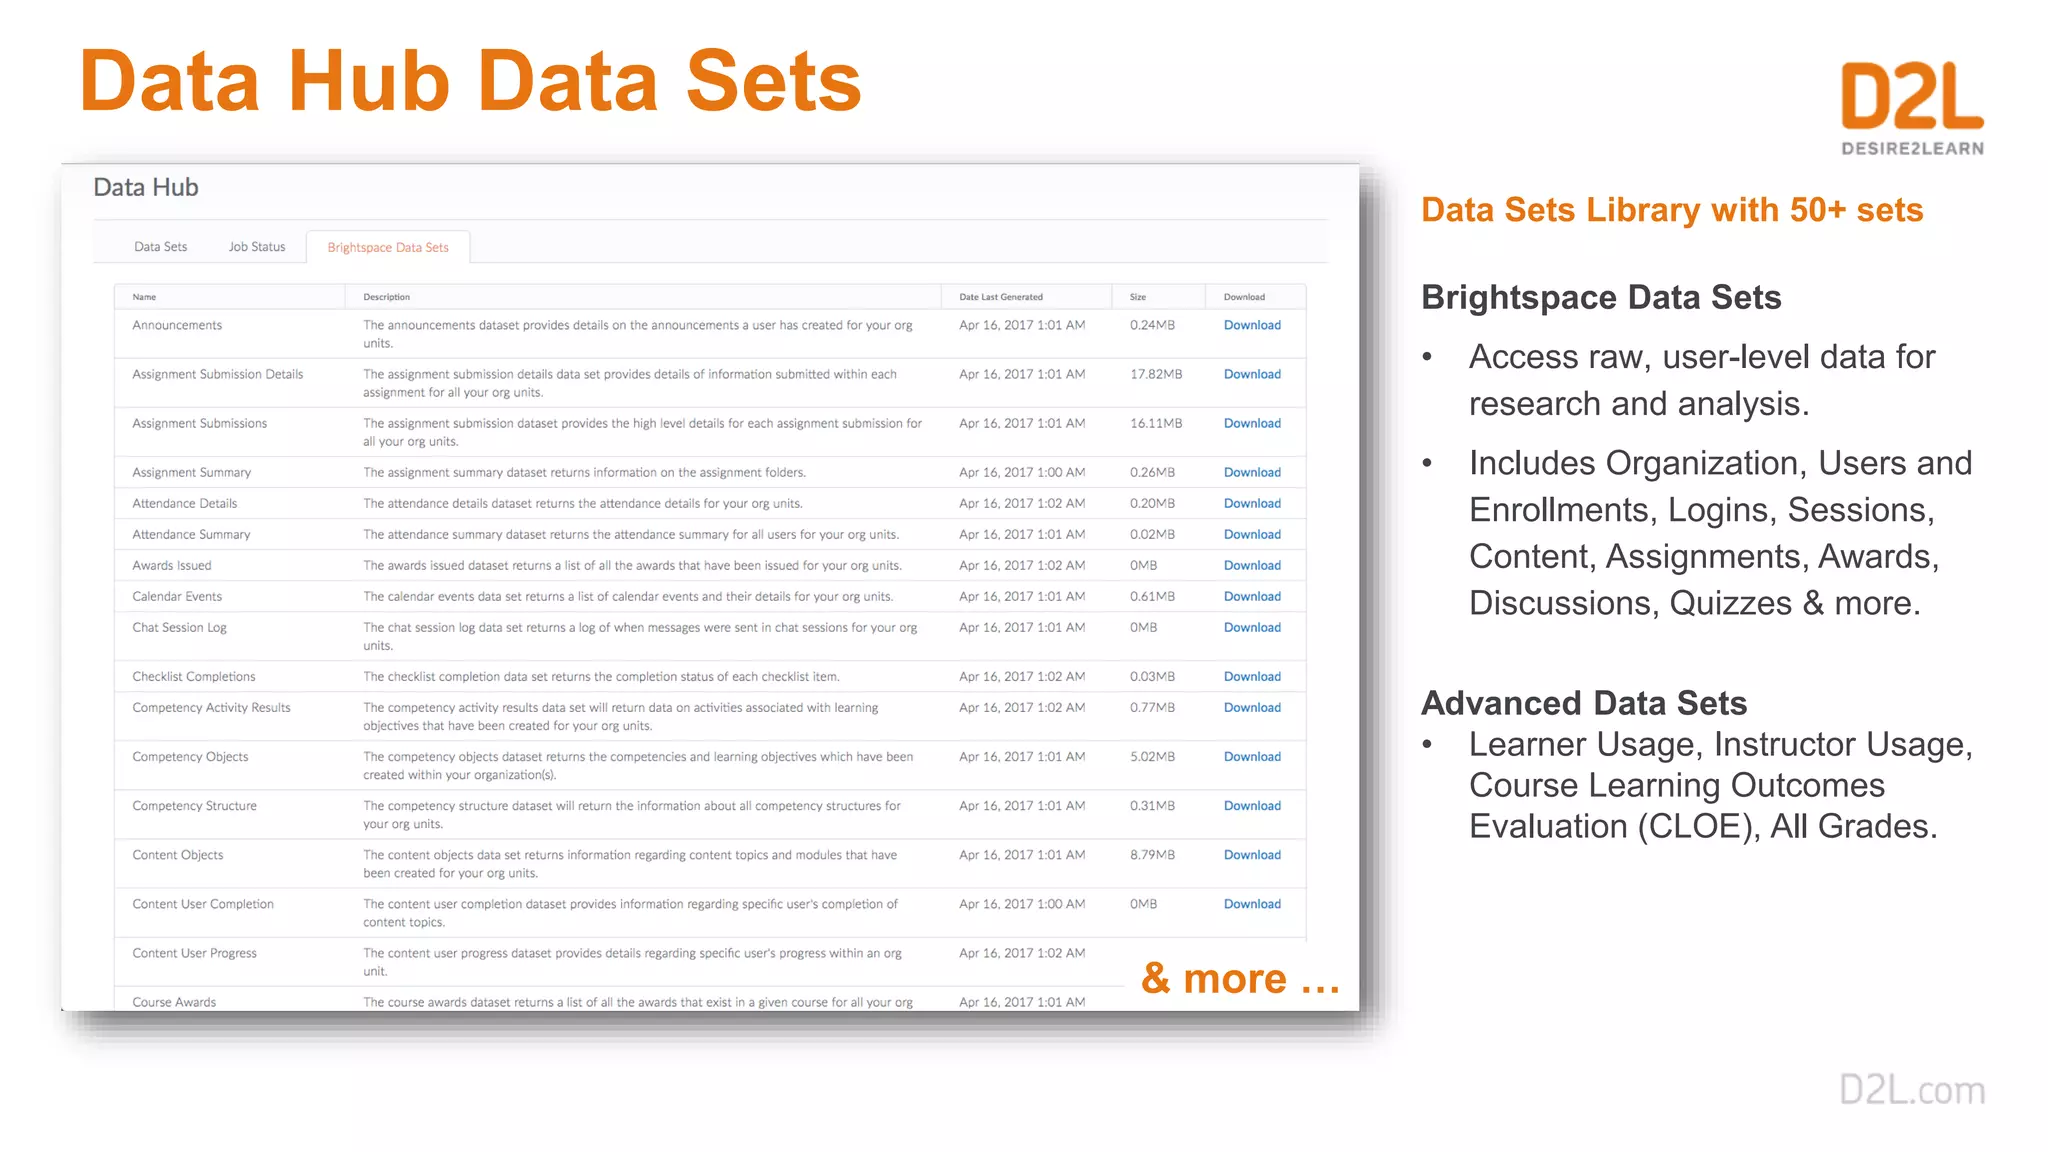
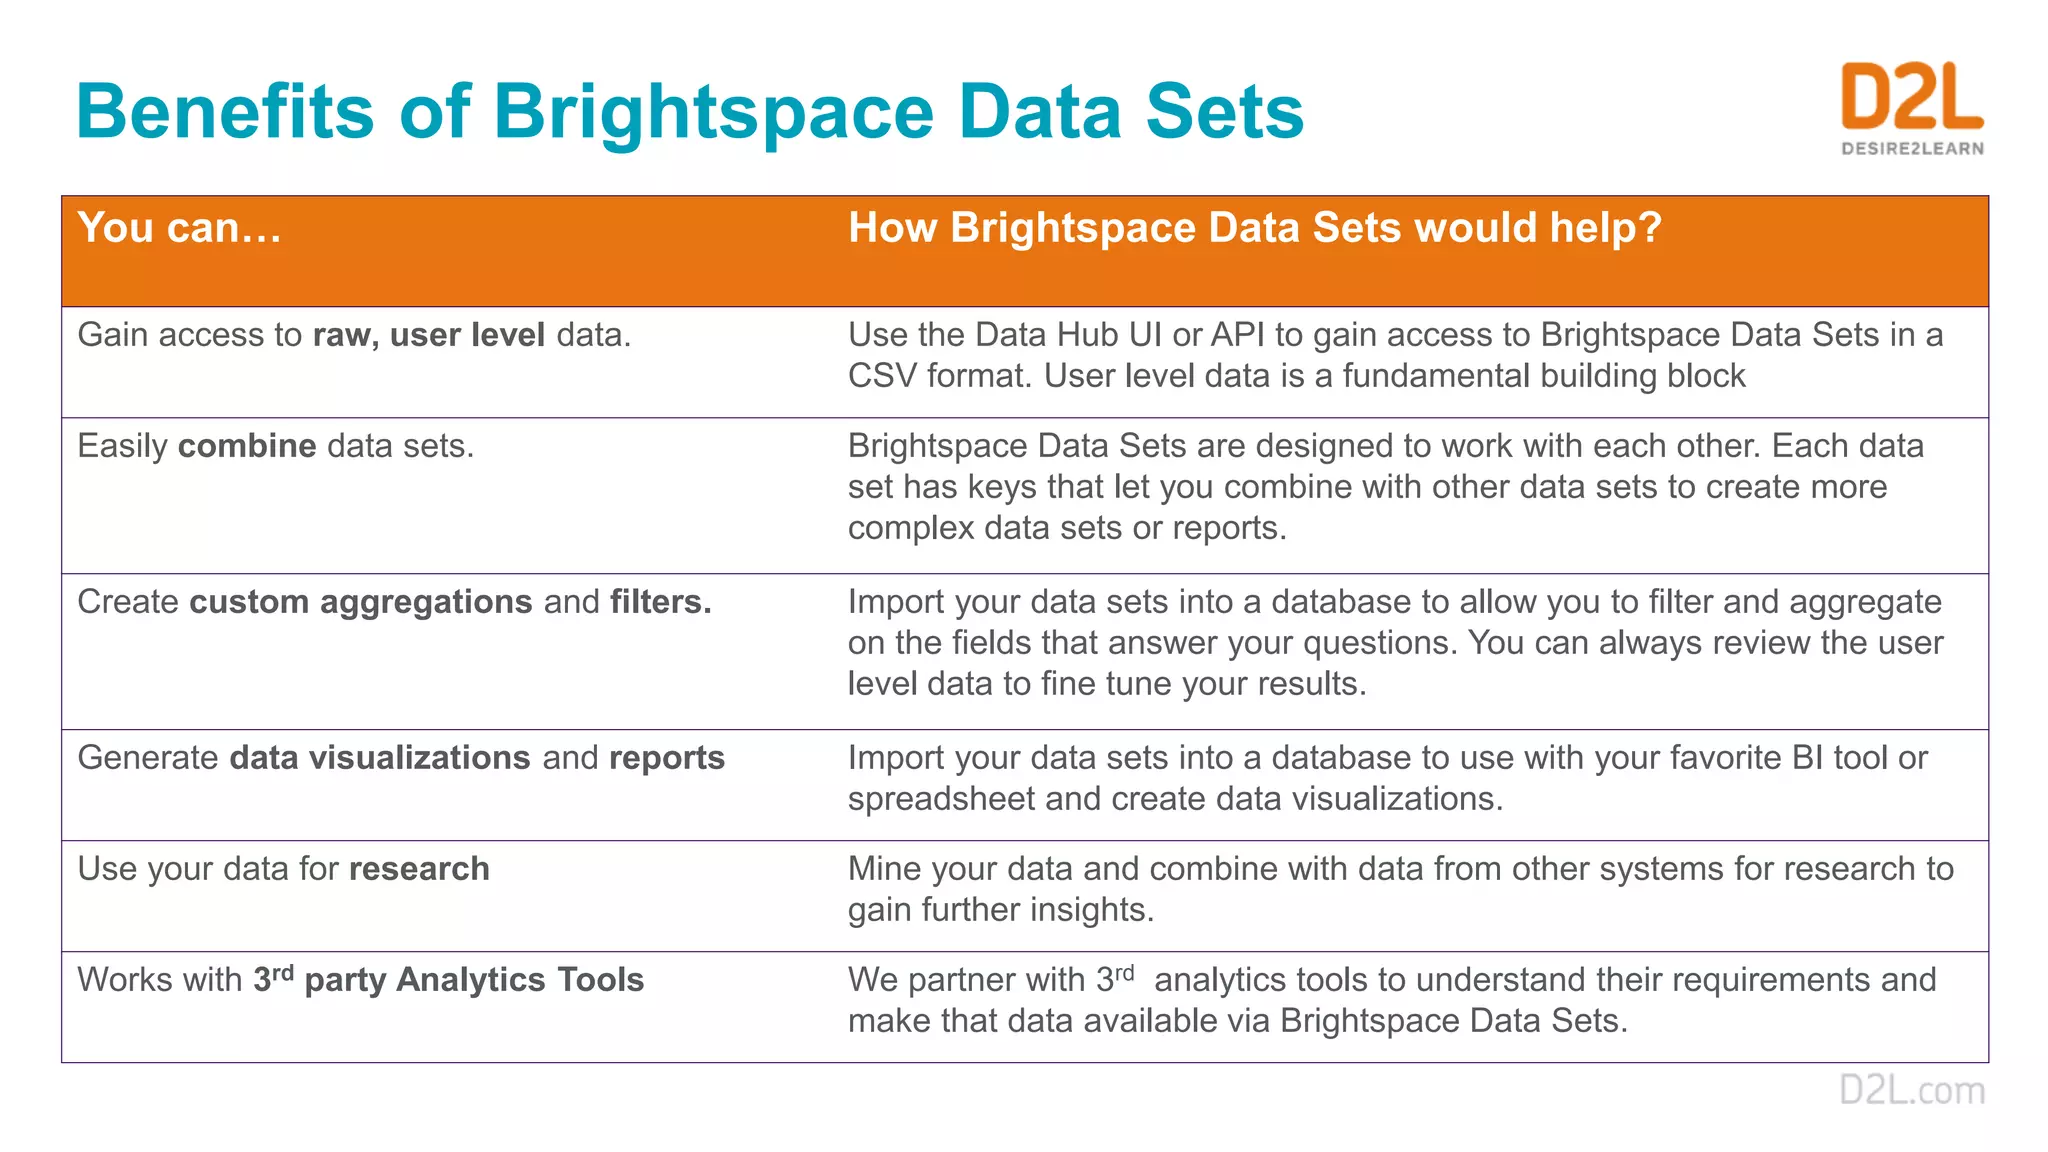
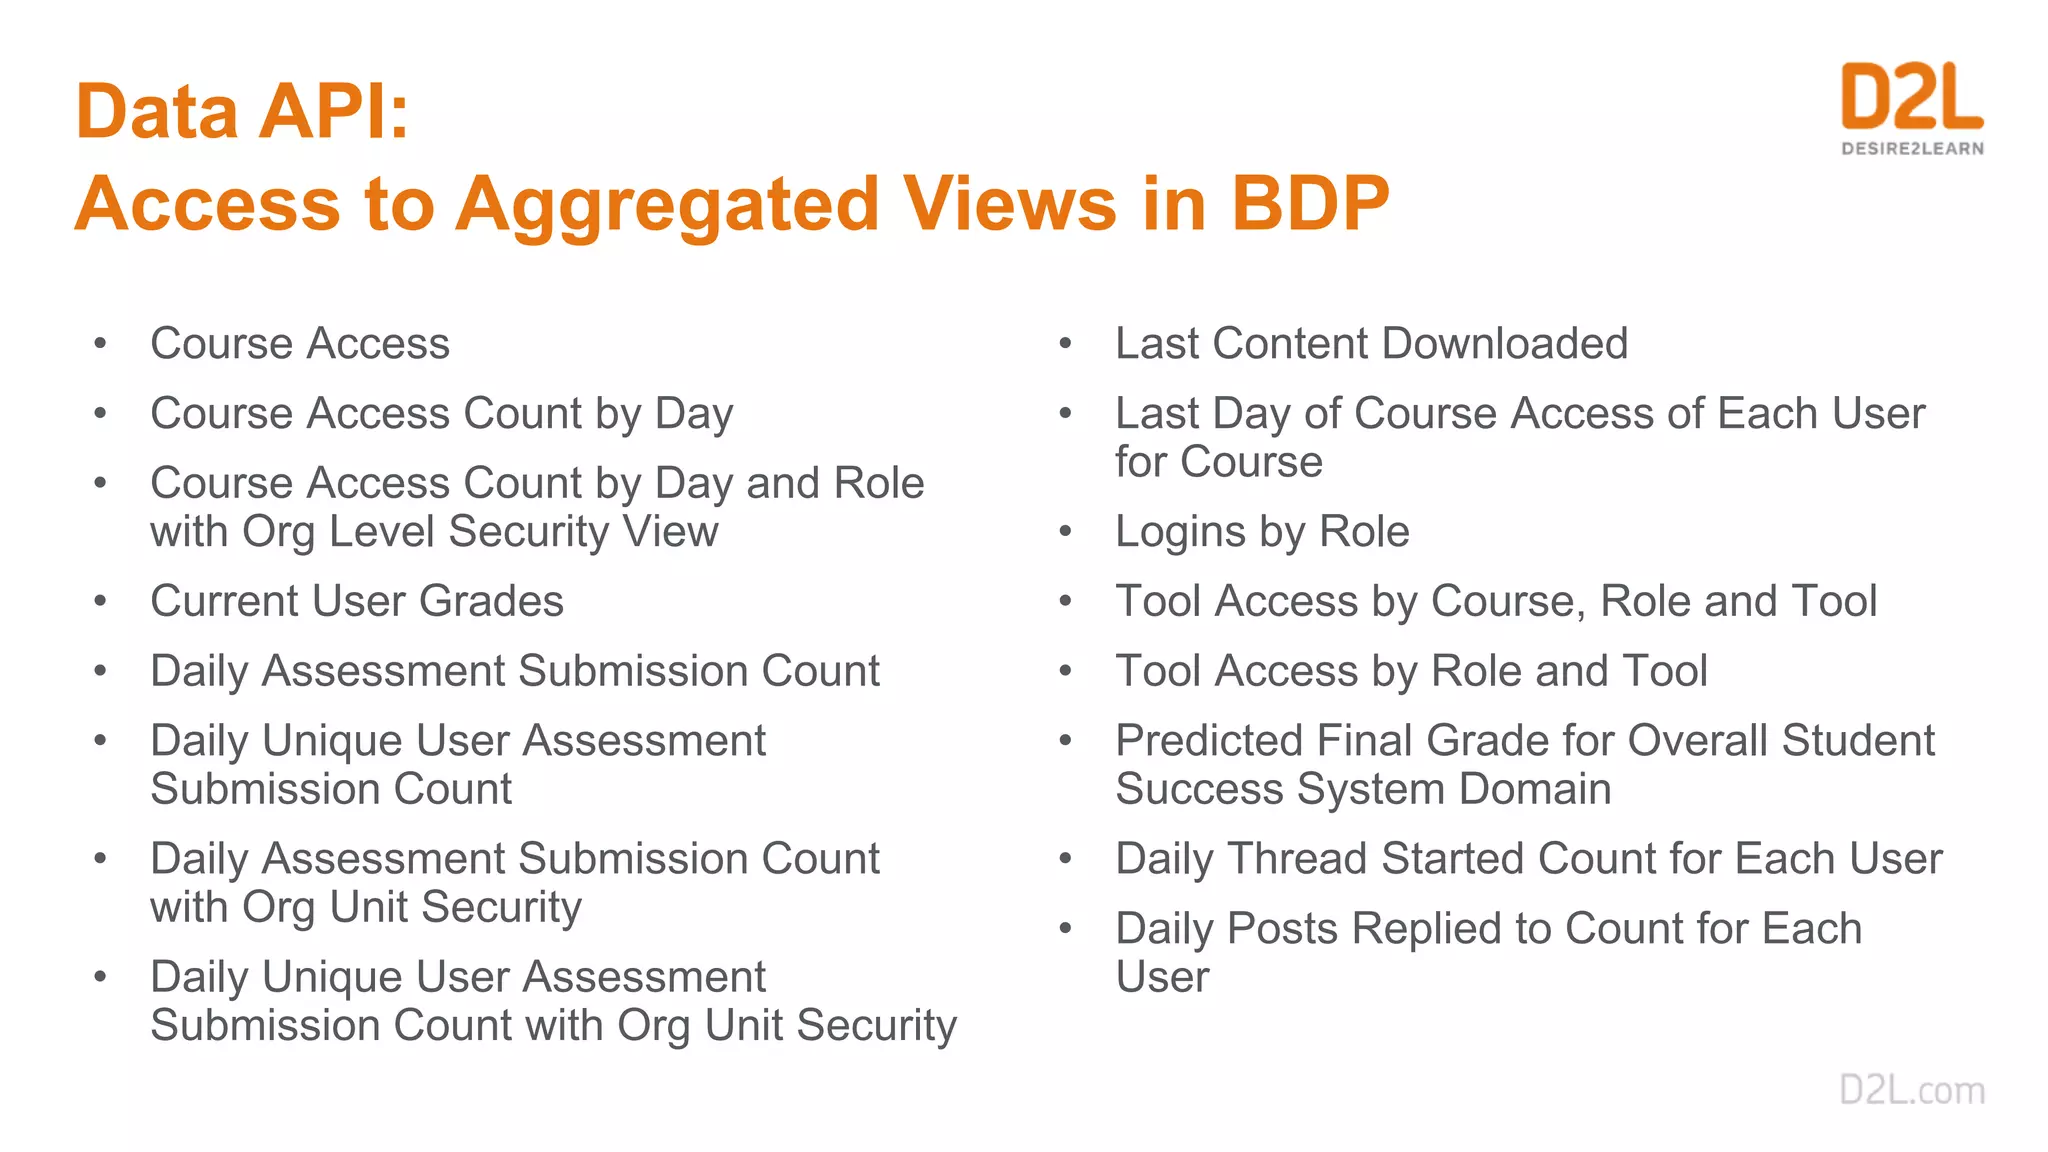
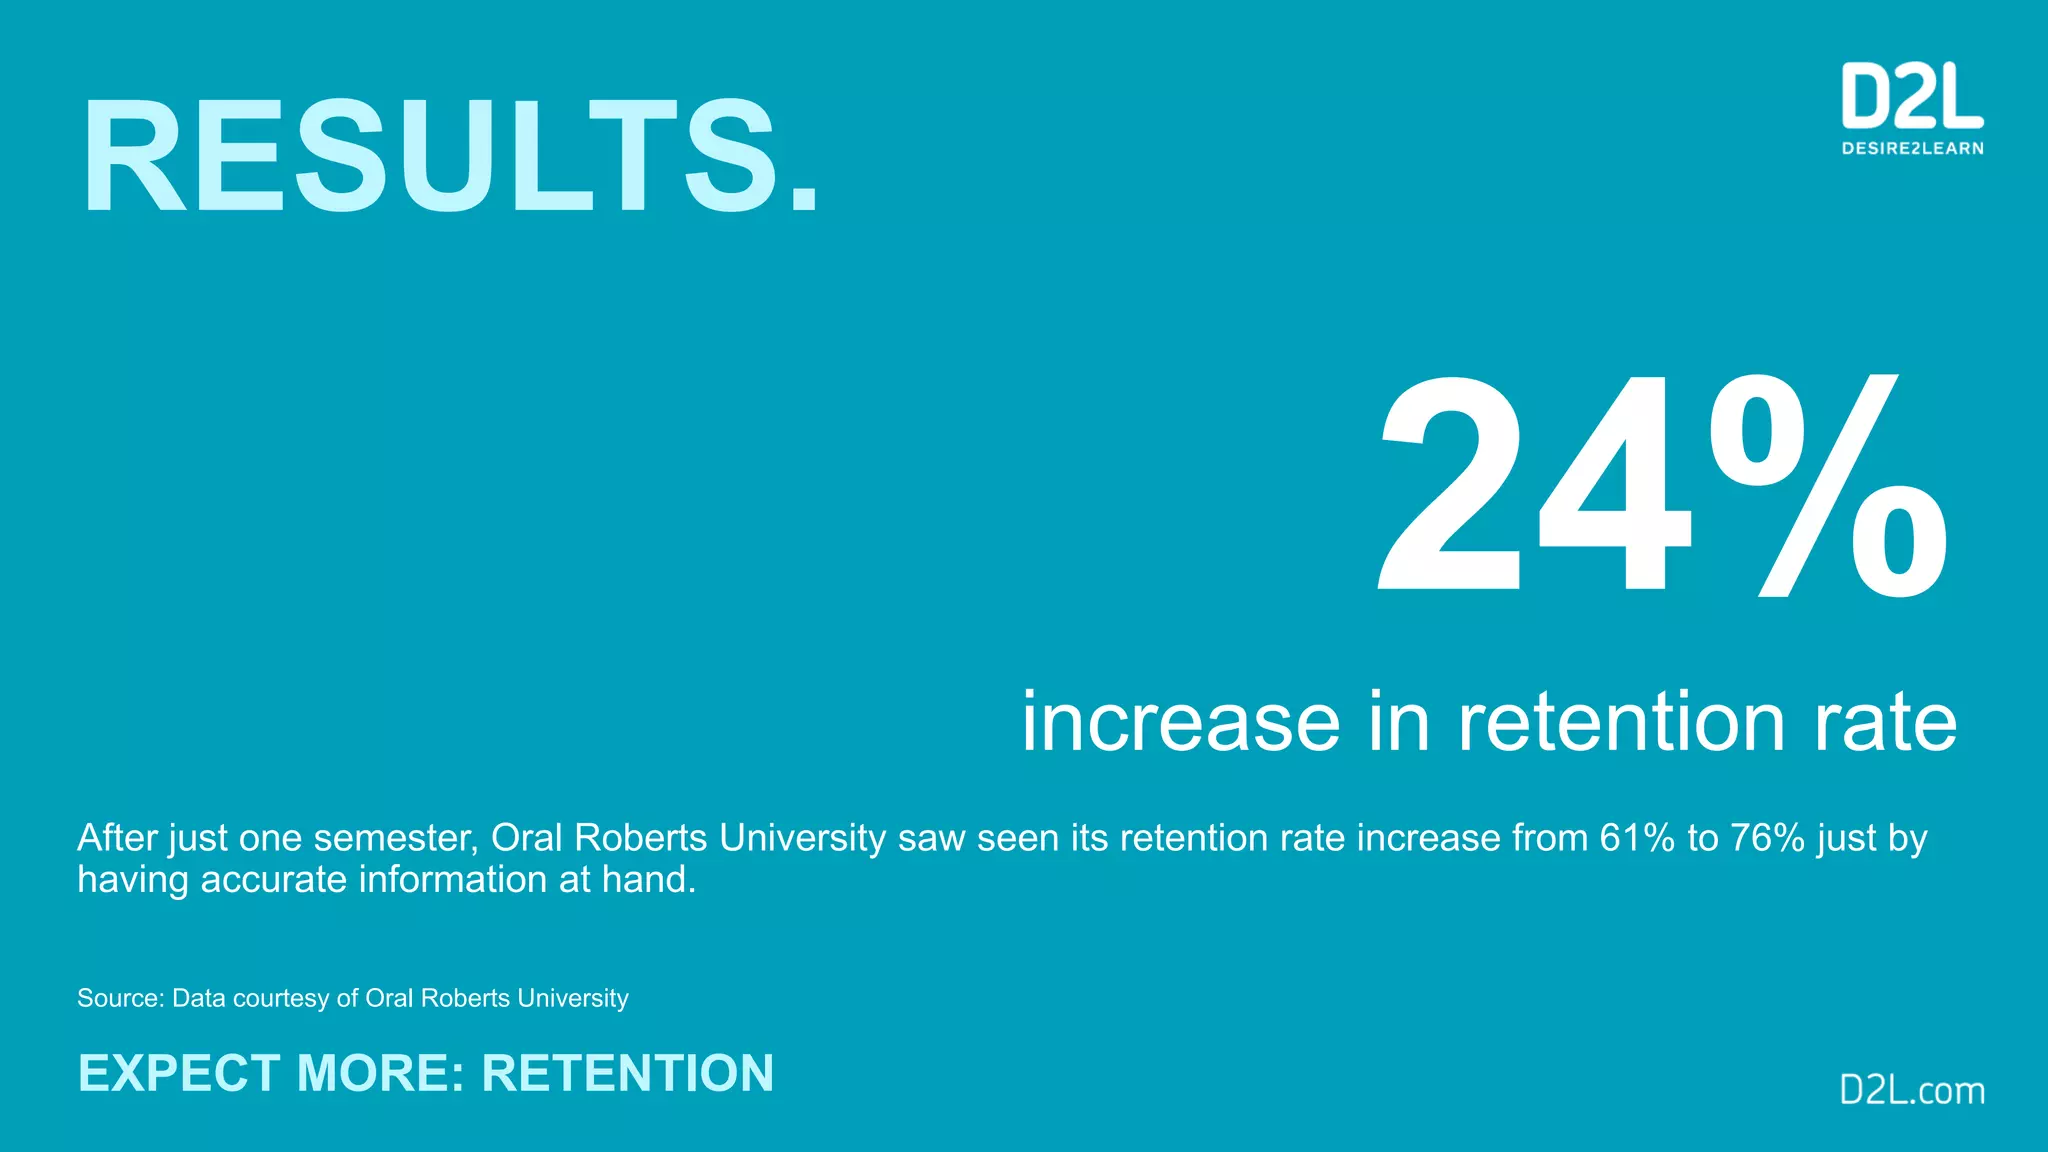

The document outlines Brightspace Analytics, which provides tools for data mining, research, and analysis within the Brightspace learning environment. It includes built-in reports, dashboards, predictive analytics for identifying at-risk learners, and various assessment and engagement analytics features. Additionally, it highlights the availability of raw user-level data through the Data Hub for research and custom reporting.