Downloaded 43 times


![© DataStax, All Rights Reserved.Confidential
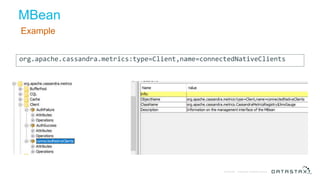
MBean
Accessing a Managed Bean (MBean)
● The MBean name is structured as follows:
− domain – usually a package name, i.e. org.apache.cassandra.metrics or com.datastax.bdp
− key property list – list of key-value pairs
− Keys generally have a type and a name
● The full name would be domain:[key1]=[value1],[key2]=[value2],...
− Domain and key property list is separated by colons
− Key-value pairs separated by commas
● MBeans may have a set of readable attributes](https://image.slidesharecdn.com/cassandraperformancemetricswebinarfinal-190725222106/85/Webinar-How-to-Understand-Apache-Cassandra-Performance-Through-Read-Write-Metrics-A-Beginner-s-Guide-26-320.jpg)

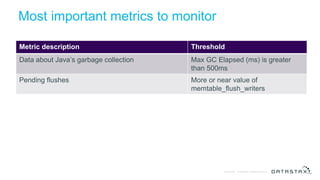


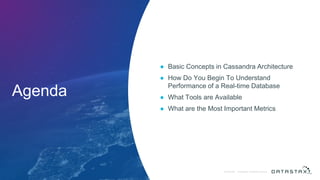
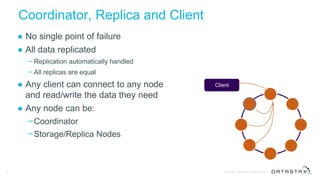
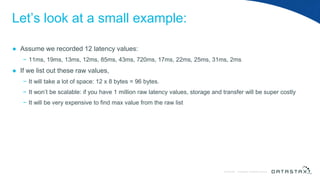
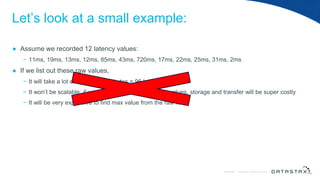
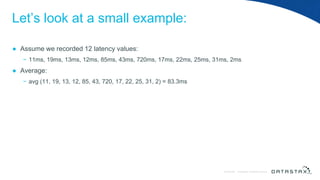
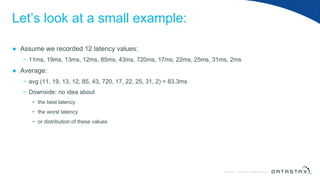
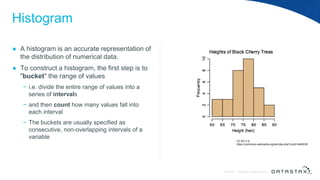
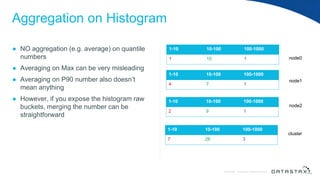
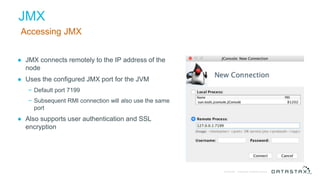
The document is a beginner's guide on understanding Apache Cassandra performance through metrics. It covers essential concepts of Cassandra architecture, the importance of metrics like throughput and latency, and tools available for performance monitoring, particularly focusing on JMX and various metrics types. Additionally, it discusses aggregation methods and provides examples of monitoring practices for effective database management.