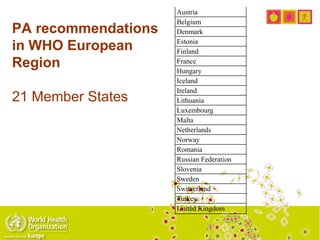
This document discusses obesity, physical activity, and cancer. It provides the following key points:
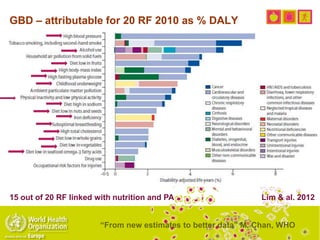
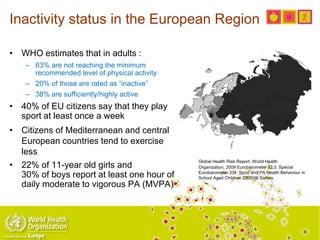
- Physical inactivity is linked to increased risk of several cancers and other health issues like cardiovascular disease. Inactivity levels in Europe are high, with over 60% of adults not meeting physical activity guidelines.
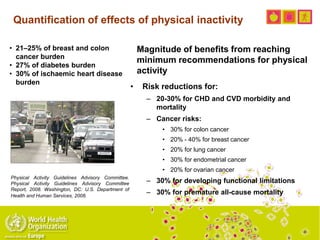
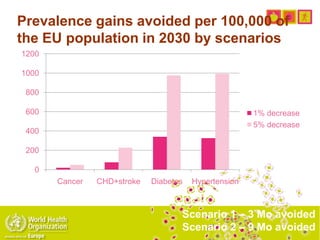
- Reducing cancer risks requires increasing physical activity levels to meet guidelines. This could reduce breast and colon cancer burden by 21-25% and cardiovascular disease burden by 27-30%.
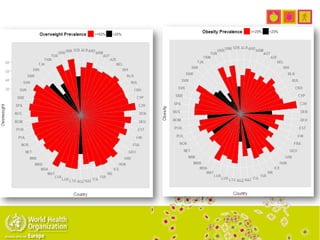
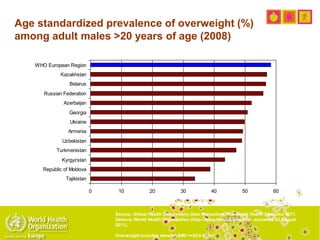
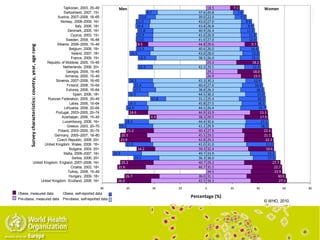
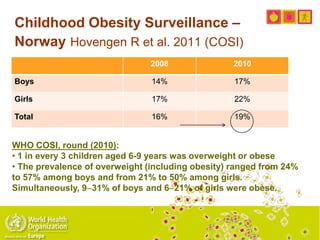
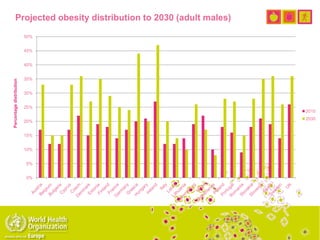
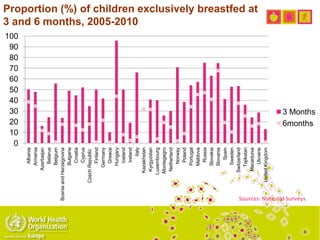
- Childhood obesity is increasing across Europe. One-third of European children are overweight or obese, putting them at risk for future health problems.
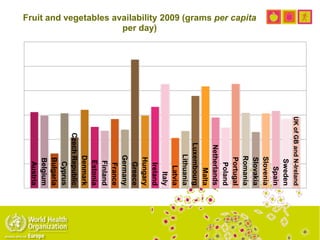
- Promoting physical activity and healthier diets is important for reducing obesity and


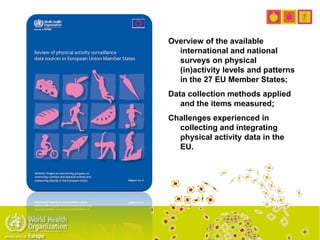
![Sport and health: what is the current
policy situation in EU Member States?
• Analysis of existing sport policy documents
from 15 EU MS concluded, among others:
– […] Local environments have a crucial role in
promoting sport and physical activity, since it is
mainly in the local setting that the opportunities to
be physically active are provided.
– Elite sports facilities should not be prioritized at the
expense of facilities for the general public and
the planning of recreational sports facilities should
be considered as an integral part of urban planning
– Taking a life course approach and offering
physical activity in different settings, including
schools and work places, is essential to the
promotion of sport and physical activity.
– Collaboration should take place not only among
ministries but also across government levels
(national, regional and local), with civil society and
the voluntary and private sectors. […]](https://image.slidesharecdn.com/bredaopac2013-130419051946-phpapp01/85/Breda-opac2013-49-320.jpg)