Downloaded 586 times
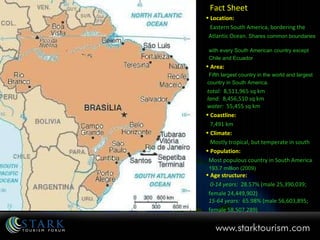
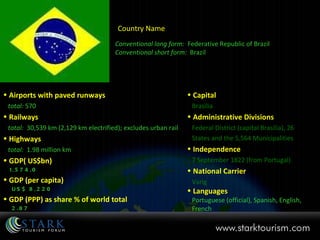
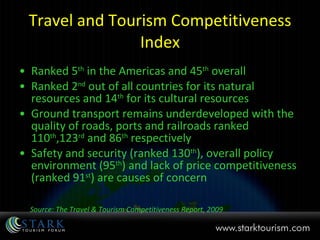
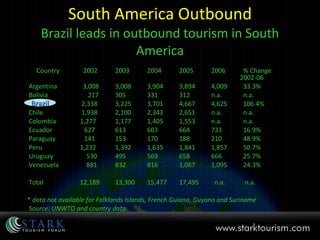


Brazil, the largest country in South America, is populous with 193.7 million people (2009) and has a diverse economy through agriculture, industry, and services. The country ranks high in travel and tourism competitiveness, particularly for its natural and cultural resources, while experiencing a significant increase in outbound travel, especially to Europe and the United States. A majority of Brazilian travelers prefer leisure trips, with strong cultural ties influencing their choice of destinations.


