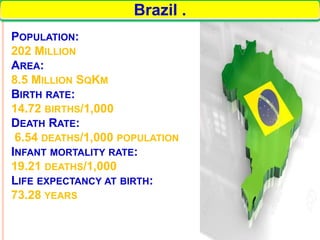
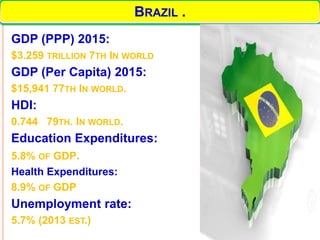
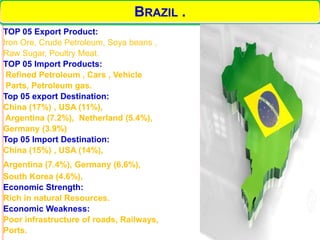
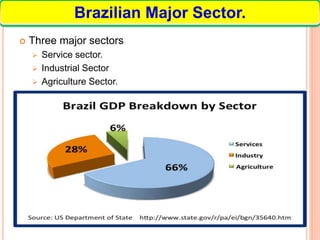
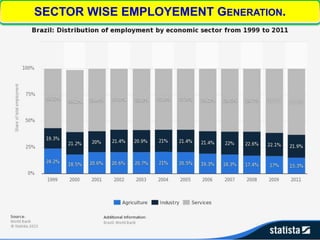
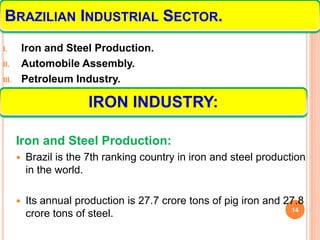
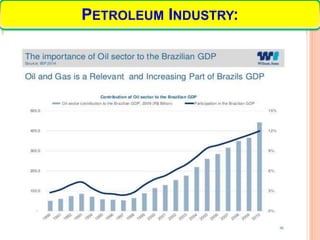
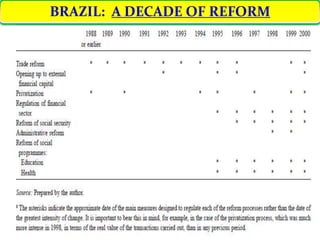
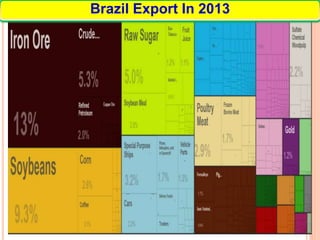
KOREAN ECONOMIC DEVELOPMENT
Brazil
Presented By
I. Bilal Gillani
II. Abdelhak Boulsane
III. Asharf Osman
IV. Saleh Al-Hada1
2
POPULATION:
202 MILLION
AREA:
8.5 MILLION SQKM
BIRTH RATE:
14.72 BIRTHS/1,000
DEATH RATE:
6.54 DEATHS/1,000 POPULATION
INFANT MORTALITY RATE:
19.21 DEATHS/1,000
LIFE EXPECTANCY AT BIRTH:
73.28 YEARS
Brazil .
GDP (PPP) 2015:
$3.259 TRILLION 7TH IN WORLD
GDP (Per Capita) 2015:
$15,941 77TH IN WORLD.
HDI:
0.744 79TH. IN WORLD.
Education Expenditures:
5.8% OF GDP.
Health Expenditures:
8.9% OF GDP
Unemployment rate:
5.7% (2013 EST.)
6/5/2016
3
BRAZIL .
Inflation rate (consumer prices):
6.2%
Exports:
$244.8 billion (2013 est.)
Imports
$241.4 billion (2013 est.)
Reserves of foreign exchange and gold:
$378.3 billion (31 December 2013 est.)
External Debt:
$475.9 billion (31 December 2013 est.)
Electricity - Production:
501.7 billion kWh
Electricity - Consumption:
455.8 billion kWh (2010 est.)
Electricity - Imports:
38.43 billion kWh (2011 est.)
Electricity - Exports:
2.544 billion kWh
6/5/2016
4
BRAZIL .
TOP 05 Export Product:
Iron Ore, Crude Petroleum, Soya beans ,
Raw Sugar, Poultry Meat.
TOP 05 Import Products:
Refined Petroleum , Cars , Vehicle
Parts, Petroleum gas.
Top 05 export Destination:
China (17%) , USA (11%),
Argentina (7.2%), Netherland (5.4%),
Germany (3.9%)
Top 05 Import Destination:
China (15%) , USA (14%),
Argentina (7.4%), Germany (6.6%),
South Korea (4.6%),
Economic Strength:
Rich in natural Resources.
Economic Weakness:
Poor infrastructure of roads, Railways,
Ports.
6/5/2016
5
BRAZIL .
6/5/2016
6
6/5/2016
7
6/5/2016
8
SWOT ANALYSIS OF BRAZIL.
1. High Tourist Potential.
2. Natural Resources
1. Racial Segregation.
2. High Crime Rate.
3. Environmental Pollution.
1. Trade link with India and
with BRICS.
2. Olympics 2016.
3. Oil Export To India.
1. High Inequalities.
9
Nine major projects of ports in the world (US$
billion)
10
Top Sixteen Major Transport Projects in the world (US$ billion)
11
High-speed train linking the cities of Rio de Janeiro, São Paulo
and Campinas
 Three major sectors
 Service sector.
 Industrial Sector
 Agriculture Sector.
12
Brazilian Major Sector.
13
SECTOR WISE EMPLOYEMENT GENERATION.
I. Iron and Steel Production.
II. Automobile Assembly.
III. Petroleum Industry.
Iron and Steel Production:
 Brazil is the 7th ranking country in iron and steel production
in the world.
 Its annual production is 27.7 crore tons of pig iron and 27.8
crore tons of steel. 14
IRON INDUSTRY:
BRAZILIAN INDUSTRIAL SECTOR.
 Since 1973, production of steel has witnessed more
than 300 per cent increase.
 The consumption of steel within the country is very low.
 Brazil is able to export bulk of its steel production.
 Brazil possesses vast amount of iron ore.
 The largest of these deposits is located near Minas-
Gerraes.
 The biggest Steel plant is located at Santa Catarina.
15
IRON INDUSTRY:
6/5/2016
16
 Automobile Assembly:
 Experienced a drop of nearly 27% from 1998 to 1999
because of the country's financial Crises.
 Production of automobiles went down to 1.6 million units in
1998 as compared to 2 million units in 1997.
 In 2001, Brazil produced 1.7
million automobiles,
an increase of 7% over 2000.
 In 2000, the country produced
70,304 heavy trucks, an increase
of 27% over 1999.
17
AUTOMOBILE INDUSTRY:
Motor vehicle production is the backbone Brazil's
industry.
Automobile industry is expanding rapidly
foreign investment
 construction of new manufacturing plants.
18
AUTOMOBILE INDUSTRY:
6/5/2016
19
AUTOMOBILE INDUSTRY:
6th
Place In
the world
after USA,
Germany,
Japan
3rd
Place
Among BRICS
Countries After
China & Russia
Ist Place
In Latin American
Countries
6/5/2016
20
AUTOMOBILE INDUSTRY:
Shows
increase In
new sales
of cars from
2006 and
reaches
above 3
million in
2013.
 Year wise Data of Automobiles Productions:
21
AUTOMOBILE INDUSTRY:
Year Data
1960 133,000
1970 416,089
1980 1,165,174
1990 914,466
2000 1,681,517
2005 2,530,840
2006 2,611,034
2007 2,970,818
2008 3,220,475
2009 3,182,617
2010 3,648,358
2011 3,406,150
0—1 mln 1—2 mln 2—3 mln 3—4 mln
 Brazil is the 10th largest energy consumer in the
world and the largest in South America.
 Brazil is the world's 12th largest oil
producer.
 Petrobras is the only company that
produces oil globally.
 This company is also an important oil And Gas
Producer in the region and the world‘s second
largest ethanol fuel producer.
22
PETROLEUM INDUSTRY:
6/5/2016
23
Ten major projects in the Oil and Gas sectors in the
world (US$ billlion)
24
PETROLEUM INDUSTRY:
25
PETROLEUM INDUSTRY:
Official appellation:
Federative Republic of Brazil
Description:
Federal presidential representative democratic republic
POLITICAL
SYSTEM
FEDERAL
GOVERNMENT
EXECUTIVE
LEGISLATIVE
(NATIONAL
CONGRESS)
JUDICIARY
STATES MUNICIPALI
TIES
FEDERAL
DISTRICT
BRAZIL POLITICS:
COMPONENTS OF
SYSTEM
1) PRESIDENT:
2) FEDERAL GOVERNMENT:
 Exercises control over central government, it is divided into
Three independent branches
 Executive power: exercised by president, advised by a cabinet.
 Legislative power: Two-chamber legislature :the federal senate &
chamber of deputies
 Judicial power: consists of: Supreme federal court, National
justice council, Regional federal courts.
3) STATES:
 Autonomous sub-national entities with own government, power
executed by Governor elected to a four-years term.(27 states)
BRAZIL POLITICS:
4)- MUNICIPALITIES:
 Territory comprising 1 urban area & several urban or rural
areas(districts)
 Relatively autonomous with own constitution(organic
law),governed by mayor elected to
 a four-years term.
5)- FEDERAL DISTRICT:
 Anomalous unit, organized as municipality, ranked among
states but
 Doesn`t possess their autonomy, it is closely related to the
central power.
 (constituted by Brasilia &satellite cities, governed by
regional administrators individually,
 by a governor as a whole ).
28
BRAZIL POLITICS:
Opportunities and Strengths:
Foreign direct investment (FDI) into Brazil boomed over the
period 2009- 2011, but has been slowing down ever since.
After reaching USD 64 billion in 2013, FDI inflows to Brazil
declined to USD 62 billion in 2014 and again to USD 56 billion in
2015, a 23% decrease on the previous year. However,
Brazil remains the largest recipient of FDI in Latin America and
the fifth largest recipient in the world.
The country is currently the fourth largest investor in emerging
markets and the largest investor in Latin America.
FOREIGN INVESTMENT IN BRAZIL
Opportunities and Strengths:
Brazil is attractive for international investors due to:
 Domestic market of nearly 200 million inhabitants.
 Easy access to raw materials.
 Diversified economy that is less vulnerable to international crises.
 Strategic geographic position that allows easy access to south
American markets.
 Large pool of workers at all levels of education.
 Export sector particularly in industry, could provide investment
opportunities.
 Brazil ranked 116th out of 189 countries in the Doing Business
2016 report issued by the World Bank, which represents a gain of
four places.
 Most of the barriers to foreign investor activity have been removed,
particularly on the stock market.
 A very large number of public companies have been privatized and
many sectors deregulated over the last fifteen years.
30
FOREIGN INVESTMENT IN BRAZIL
31
Weaknesses And Threats:
Threats:
The economic crisis facing the country,
Political controversy threatening President and
double-digit inflation.
Heavy and complicated tax systems,
Slow bureaucracy and cumbersome and rigid labor legislation.
Weakness:
Brazilian investment climate weaknesses include:
Several administrative barriers, cripple international trade , labor
laws are very onerous, involving substantial costs to foreign
companies &keeping a good part of local business in informal
sector.
Foreign investments are restricted in several sectors, such as
insurance, aviation and media.
Some foreign investors have encountered obstacles engaging with
regulatory agencies, underlining the high level of regulatory risk.
BRAZIL: A DECADE OF REFORM
1. Exchange Rate flexibility
 The 1990s are considered as the “reform decade” in Brazil.
Although some initial actions were taken in the late 1980s –such as
foreign trade liberalization and the first privatization operations.
 During the presidency of Itamar Franco the Plano
Real ("Real Plan" in English) was formed a set of measures taken
to stabilize the Brazilian economy in 1994.
 In 1994, the government lunched “The Real Plan” that contained
reissued the real and instituted a crawling peg. The new currency,
in combination with interest rates in excess of 30%, stabilized
inflation for the first time in decades.
 In 1997 foreign direct investment grew by 140% over the year
before.
Financial and Fiscal Reform
 By the beginning of 1998 foreign investors seemed to have
recovered their confidence and capital inflows resumed growth, lured
by the very high interest rates offered. Reserves peaked at US$ 75
billion by April 1998, allowing the Central Bank to relax somewhat its
monetary policy.
 Brazil signed a deal with the IMF in November 1998. The Fund
became the leader of a syndicate of multilateral and international
institutions which conceded a US$ 41 billion loan.
 In January 1999 Brazilian policymakers instituted a new exchange
rate system. The exchange rate regime was changed from crawling
peg to float.
 A month after floatation was adopted, the exchange rate had
depreciated in 93%, raising fears that high inflation could be just
around the corner.
Financial and Fiscal Reform
2. Inflation Targeting:
 To consolidate the new regime of exchange rate floatation it was
necessary to create an appropriate macroeconomic policy
environment. Policymakers adopted an inflation targeting monetary
policy regime.
 The new policy regime worked surprisingly well to reach its goals
in a short period of time. It did not take long for inflation to
converge to its target. Thus, in 1999, despite the large exchange
rate shock, inflation overshot only 0.9% above its target of 8%. In
addition, the exchange rate also remained reasonably stable (at
levels that were compatible with the external competitiveness of
the Brazilian economy) for two years with almost no intervention
by the Central Bank.
 While GDP growth in 1999 was barely 0.3%, in 2000 the economy
actually grew 4.3%.
Financial and Fiscal Reform
Annual Inflation with Target Band
MONTHLY CPI INFLATION & SELIC RATE
3)-Fiscal Responsibility :
 Brazilian tax burden is amazingly high even when compared to
developed countries contrary to the results often found for developing
countries. In the beginning of the 90’s Brazilian tax burden was 25% of
GDP and by 2004 it was more than 32.8% of GDP.
 Starting from 1997 -during the Cardoso government- till 2000, Brazilian
society witnessed at least five reform attempts by the federal government,
none of them were adopted.
 It was necessary to conduct other structural reforms.
The second phase was denominated ‘Fiscal Stability Program’ that included
among other measures:
 Re-scheduling of state and local government public debts
 Reform in public accounting by recognition of hidden liabilities
 Measures to control public debt/GDP ratio in 44%
 Maintain fiscal primary surplus to achieve sustainability in public debt
 Reduce expenditure by means of an institutional reform and increase
revenue.
Financial and Fiscal Reform
 One of the objectives assumed by the Brazilian government in
relation to the IMF was to enact the Fiscal Responsibility Act in
2000 as a clear demonstration of commitment in relation to fiscal
stability in the medium and long term.
 In this scenario, the Fiscal Responsibility Act (LRF), approved by
Brazilian Congress in 2000.
 Among the set of rules and principles set forth in the Fiscal
Responsibility Act, some of them must be emphasized:
 Personnel expense limit
 Public debt limit
 Definition of annual fiscal goals
 Compensation mechanisms for permanent expenses
Financial and Fiscal Reform
 The Lula da Silva administration was inaugurated in January 2003.
The new government, in a surprising move, maintained the same
economic policy regime created under President Cardoso.
Innovations would be introduced in social policy and, to some
extent, in industrial policies. Macroeconomic management policies,
however, were maintained largely intact.
 On December 2003, Tax Reform was approved by Congress.
4)- Results of financial and fiscal reform:
 The consolidated budget shifted from a primary deficit of almost 0.2
percent of GDP per year in 1995-98 to a surplus of almost 4
percent of GDP on average during 1999-2005.
 In 2007, the surplus reached 3.98 percent, exceeding the target of
3.75 percent (See Figure 1), and the surplus for 2008 is expected
to improve further, reaching 4.27 percent, despite worsening of
economic conditions.
Financial and Fiscal Reform.
 Brazil, along with Korea, is one of the countries that has had
experience with both import substitution and export promotion
policies.
 Brazil's long-favorable foreign-trade balance deteriorated
substantially between 1958 and 1974 as a result of industrial
expansion, which necessitated increased imports of industrial
capital goods and petroleum.
 During 1975/76 and again from 1978 to 1982, the foreign-trade
balance was in deficit.
 Beginning in 1983, Brazil recorded trade surpluses: $5.1 billion in
1983, $11.8 billion in 1984, and $11.3 billion in 1985. This
achievement was the result of policies that restricted imports and
offered substantial incentives to exporters. 46
FINANCIAL AND FISCAL REFORM
 The export promotion policies, adopted before 1990, have been
successful and went to the favor of brazil in many respects. For
example.
 In the last ten years of the import substitution phase, the average
annual growth rates of GDP, industrial output, and manufacturing
employment were roughly 5, 6, and 2 percent respectively.
 After export promotion policies were introduced these rates increased
dramatically. In the period 1966- 75 they with averaged 9, 11, and 10
percent.
Export Promotion Policy.
 Between 1998-93, a wide-ranging process of liberalization took
place,in which the principal non-tariff barriers were eliminated and the
level and degree of protection for local industry was gradually
reduced.
 The new Industrial and Foreign Trade Policy was introduced,
abolishing most of the non-tariff barriers inherited from the period of
import substitution, and defining a timeframe for the reduction of
import tariffs.
 Products without a domestic equivalent, with a distinct competitive
advantage and a high degree of national protection, as well as to low
value-added commodities were exempted from tariffs.
 Rates of 10% and 15% were applied to sectors making heavy use of
raw materials subject to a zero tariff.
 Most manufactured products were subject to a tariff of 20%, with a
30% tariff applied to fine chemicals, wheat, pasta, record players.
 The automobile and computer sectors were subject to nominal tariffs
of 35% and 40% respectively.
Promotion Export Policy.
Brazil Export In 2000.
Brazil Export In 2013
 Brazilian export outstripped imports between 2000 and 2015, and reflect positive
trade balance from the internal and external adjustment carried out in response to
changes and reforms in trade policy.
 With exceptional weakness of the economy in 2014 relates to external factors, such
as the deterioration in the terms of trade, the slowdown in activity in the economies
of major trading partners (China and Argentina) and disturbances associated with
monetary policy normalization in the United States, and also domestic aspects.
The Beginning of Trade Surplus.
 There was a major change beginning in 2004. GDP per person grew at a
rate of 2.5% annually from 2003-2014,compered to 0.8% annual growth
(1995-2002).
 Since the Workers’ Party came to power with President Lula taking office
in 2003, poverty has been reduced by over 55 percent, from 35.8 percent
of the population to 15.9 percent in 2012.
 There were also large improvements with regard to income inequality, the
top 10 percent of households received more than half of all income gains
between (1993-2002), but this fell to about 33% for 2003-2012. The
biggest gainers were the 40 percent below the median: they nearly
doubled their share of income gains from 11.3 to 21.1 percent.
 Huge foreign investment is being done in transport and port infrastructure
because of Olympic 2016.
 Earning from Olympics 2016 as well as infrastructure development will
boost the economic progress in the coming years..
Conclusion
54

Brazil economic development

  • 1.
    KOREAN ECONOMIC DEVELOPMENT Brazil PresentedBy I. Bilal Gillani II. Abdelhak Boulsane III. Asharf Osman IV. Saleh Al-Hada1
  • 2.
    2 POPULATION: 202 MILLION AREA: 8.5 MILLIONSQKM BIRTH RATE: 14.72 BIRTHS/1,000 DEATH RATE: 6.54 DEATHS/1,000 POPULATION INFANT MORTALITY RATE: 19.21 DEATHS/1,000 LIFE EXPECTANCY AT BIRTH: 73.28 YEARS Brazil .
  • 3.
    GDP (PPP) 2015: $3.259TRILLION 7TH IN WORLD GDP (Per Capita) 2015: $15,941 77TH IN WORLD. HDI: 0.744 79TH. IN WORLD. Education Expenditures: 5.8% OF GDP. Health Expenditures: 8.9% OF GDP Unemployment rate: 5.7% (2013 EST.) 6/5/2016 3 BRAZIL .
  • 4.
    Inflation rate (consumerprices): 6.2% Exports: $244.8 billion (2013 est.) Imports $241.4 billion (2013 est.) Reserves of foreign exchange and gold: $378.3 billion (31 December 2013 est.) External Debt: $475.9 billion (31 December 2013 est.) Electricity - Production: 501.7 billion kWh Electricity - Consumption: 455.8 billion kWh (2010 est.) Electricity - Imports: 38.43 billion kWh (2011 est.) Electricity - Exports: 2.544 billion kWh 6/5/2016 4 BRAZIL .
  • 5.
    TOP 05 ExportProduct: Iron Ore, Crude Petroleum, Soya beans , Raw Sugar, Poultry Meat. TOP 05 Import Products: Refined Petroleum , Cars , Vehicle Parts, Petroleum gas. Top 05 export Destination: China (17%) , USA (11%), Argentina (7.2%), Netherland (5.4%), Germany (3.9%) Top 05 Import Destination: China (15%) , USA (14%), Argentina (7.4%), Germany (6.6%), South Korea (4.6%), Economic Strength: Rich in natural Resources. Economic Weakness: Poor infrastructure of roads, Railways, Ports. 6/5/2016 5 BRAZIL .
  • 6.
  • 7.
  • 8.
    6/5/2016 8 SWOT ANALYSIS OFBRAZIL. 1. High Tourist Potential. 2. Natural Resources 1. Racial Segregation. 2. High Crime Rate. 3. Environmental Pollution. 1. Trade link with India and with BRICS. 2. Olympics 2016. 3. Oil Export To India. 1. High Inequalities.
  • 9.
    9 Nine major projectsof ports in the world (US$ billion)
  • 10.
    10 Top Sixteen MajorTransport Projects in the world (US$ billion)
  • 11.
    11 High-speed train linkingthe cities of Rio de Janeiro, São Paulo and Campinas
  • 12.
     Three majorsectors  Service sector.  Industrial Sector  Agriculture Sector. 12 Brazilian Major Sector.
  • 13.
  • 14.
    I. Iron andSteel Production. II. Automobile Assembly. III. Petroleum Industry. Iron and Steel Production:  Brazil is the 7th ranking country in iron and steel production in the world.  Its annual production is 27.7 crore tons of pig iron and 27.8 crore tons of steel. 14 IRON INDUSTRY: BRAZILIAN INDUSTRIAL SECTOR.
  • 15.
     Since 1973,production of steel has witnessed more than 300 per cent increase.  The consumption of steel within the country is very low.  Brazil is able to export bulk of its steel production.  Brazil possesses vast amount of iron ore.  The largest of these deposits is located near Minas- Gerraes.  The biggest Steel plant is located at Santa Catarina. 15 IRON INDUSTRY:
  • 16.
  • 17.
     Automobile Assembly: Experienced a drop of nearly 27% from 1998 to 1999 because of the country's financial Crises.  Production of automobiles went down to 1.6 million units in 1998 as compared to 2 million units in 1997.  In 2001, Brazil produced 1.7 million automobiles, an increase of 7% over 2000.  In 2000, the country produced 70,304 heavy trucks, an increase of 27% over 1999. 17 AUTOMOBILE INDUSTRY: Motor vehicle production is the backbone Brazil's industry. Automobile industry is expanding rapidly foreign investment  construction of new manufacturing plants.
  • 18.
  • 19.
    6/5/2016 19 AUTOMOBILE INDUSTRY: 6th Place In theworld after USA, Germany, Japan 3rd Place Among BRICS Countries After China & Russia Ist Place In Latin American Countries
  • 20.
    6/5/2016 20 AUTOMOBILE INDUSTRY: Shows increase In newsales of cars from 2006 and reaches above 3 million in 2013.
  • 21.
     Year wiseData of Automobiles Productions: 21 AUTOMOBILE INDUSTRY: Year Data 1960 133,000 1970 416,089 1980 1,165,174 1990 914,466 2000 1,681,517 2005 2,530,840 2006 2,611,034 2007 2,970,818 2008 3,220,475 2009 3,182,617 2010 3,648,358 2011 3,406,150 0—1 mln 1—2 mln 2—3 mln 3—4 mln
  • 22.
     Brazil isthe 10th largest energy consumer in the world and the largest in South America.  Brazil is the world's 12th largest oil producer.  Petrobras is the only company that produces oil globally.  This company is also an important oil And Gas Producer in the region and the world‘s second largest ethanol fuel producer. 22 PETROLEUM INDUSTRY:
  • 23.
    6/5/2016 23 Ten major projectsin the Oil and Gas sectors in the world (US$ billlion)
  • 24.
  • 25.
  • 26.
    Official appellation: Federative Republicof Brazil Description: Federal presidential representative democratic republic POLITICAL SYSTEM FEDERAL GOVERNMENT EXECUTIVE LEGISLATIVE (NATIONAL CONGRESS) JUDICIARY STATES MUNICIPALI TIES FEDERAL DISTRICT BRAZIL POLITICS: COMPONENTS OF SYSTEM
  • 27.
    1) PRESIDENT: 2) FEDERALGOVERNMENT:  Exercises control over central government, it is divided into Three independent branches  Executive power: exercised by president, advised by a cabinet.  Legislative power: Two-chamber legislature :the federal senate & chamber of deputies  Judicial power: consists of: Supreme federal court, National justice council, Regional federal courts. 3) STATES:  Autonomous sub-national entities with own government, power executed by Governor elected to a four-years term.(27 states) BRAZIL POLITICS:
  • 28.
    4)- MUNICIPALITIES:  Territorycomprising 1 urban area & several urban or rural areas(districts)  Relatively autonomous with own constitution(organic law),governed by mayor elected to  a four-years term. 5)- FEDERAL DISTRICT:  Anomalous unit, organized as municipality, ranked among states but  Doesn`t possess their autonomy, it is closely related to the central power.  (constituted by Brasilia &satellite cities, governed by regional administrators individually,  by a governor as a whole ). 28 BRAZIL POLITICS:
  • 29.
    Opportunities and Strengths: Foreigndirect investment (FDI) into Brazil boomed over the period 2009- 2011, but has been slowing down ever since. After reaching USD 64 billion in 2013, FDI inflows to Brazil declined to USD 62 billion in 2014 and again to USD 56 billion in 2015, a 23% decrease on the previous year. However, Brazil remains the largest recipient of FDI in Latin America and the fifth largest recipient in the world. The country is currently the fourth largest investor in emerging markets and the largest investor in Latin America. FOREIGN INVESTMENT IN BRAZIL
  • 30.
    Opportunities and Strengths: Brazilis attractive for international investors due to:  Domestic market of nearly 200 million inhabitants.  Easy access to raw materials.  Diversified economy that is less vulnerable to international crises.  Strategic geographic position that allows easy access to south American markets.  Large pool of workers at all levels of education.  Export sector particularly in industry, could provide investment opportunities.  Brazil ranked 116th out of 189 countries in the Doing Business 2016 report issued by the World Bank, which represents a gain of four places.  Most of the barriers to foreign investor activity have been removed, particularly on the stock market.  A very large number of public companies have been privatized and many sectors deregulated over the last fifteen years. 30 FOREIGN INVESTMENT IN BRAZIL
  • 31.
  • 32.
    Weaknesses And Threats: Threats: Theeconomic crisis facing the country, Political controversy threatening President and double-digit inflation. Heavy and complicated tax systems, Slow bureaucracy and cumbersome and rigid labor legislation. Weakness: Brazilian investment climate weaknesses include: Several administrative barriers, cripple international trade , labor laws are very onerous, involving substantial costs to foreign companies &keeping a good part of local business in informal sector. Foreign investments are restricted in several sectors, such as insurance, aviation and media. Some foreign investors have encountered obstacles engaging with regulatory agencies, underlining the high level of regulatory risk.
  • 33.
  • 34.
    1. Exchange Rateflexibility  The 1990s are considered as the “reform decade” in Brazil. Although some initial actions were taken in the late 1980s –such as foreign trade liberalization and the first privatization operations.  During the presidency of Itamar Franco the Plano Real ("Real Plan" in English) was formed a set of measures taken to stabilize the Brazilian economy in 1994.  In 1994, the government lunched “The Real Plan” that contained reissued the real and instituted a crawling peg. The new currency, in combination with interest rates in excess of 30%, stabilized inflation for the first time in decades.  In 1997 foreign direct investment grew by 140% over the year before. Financial and Fiscal Reform
  • 35.
     By thebeginning of 1998 foreign investors seemed to have recovered their confidence and capital inflows resumed growth, lured by the very high interest rates offered. Reserves peaked at US$ 75 billion by April 1998, allowing the Central Bank to relax somewhat its monetary policy.  Brazil signed a deal with the IMF in November 1998. The Fund became the leader of a syndicate of multilateral and international institutions which conceded a US$ 41 billion loan.  In January 1999 Brazilian policymakers instituted a new exchange rate system. The exchange rate regime was changed from crawling peg to float.  A month after floatation was adopted, the exchange rate had depreciated in 93%, raising fears that high inflation could be just around the corner. Financial and Fiscal Reform
  • 36.
    2. Inflation Targeting: To consolidate the new regime of exchange rate floatation it was necessary to create an appropriate macroeconomic policy environment. Policymakers adopted an inflation targeting monetary policy regime.  The new policy regime worked surprisingly well to reach its goals in a short period of time. It did not take long for inflation to converge to its target. Thus, in 1999, despite the large exchange rate shock, inflation overshot only 0.9% above its target of 8%. In addition, the exchange rate also remained reasonably stable (at levels that were compatible with the external competitiveness of the Brazilian economy) for two years with almost no intervention by the Central Bank.  While GDP growth in 1999 was barely 0.3%, in 2000 the economy actually grew 4.3%. Financial and Fiscal Reform
  • 37.
  • 38.
  • 39.
    3)-Fiscal Responsibility : Brazilian tax burden is amazingly high even when compared to developed countries contrary to the results often found for developing countries. In the beginning of the 90’s Brazilian tax burden was 25% of GDP and by 2004 it was more than 32.8% of GDP.  Starting from 1997 -during the Cardoso government- till 2000, Brazilian society witnessed at least five reform attempts by the federal government, none of them were adopted.  It was necessary to conduct other structural reforms. The second phase was denominated ‘Fiscal Stability Program’ that included among other measures:  Re-scheduling of state and local government public debts  Reform in public accounting by recognition of hidden liabilities  Measures to control public debt/GDP ratio in 44%  Maintain fiscal primary surplus to achieve sustainability in public debt  Reduce expenditure by means of an institutional reform and increase revenue. Financial and Fiscal Reform
  • 40.
     One ofthe objectives assumed by the Brazilian government in relation to the IMF was to enact the Fiscal Responsibility Act in 2000 as a clear demonstration of commitment in relation to fiscal stability in the medium and long term.  In this scenario, the Fiscal Responsibility Act (LRF), approved by Brazilian Congress in 2000.  Among the set of rules and principles set forth in the Fiscal Responsibility Act, some of them must be emphasized:  Personnel expense limit  Public debt limit  Definition of annual fiscal goals  Compensation mechanisms for permanent expenses Financial and Fiscal Reform
  • 41.
     The Lulada Silva administration was inaugurated in January 2003. The new government, in a surprising move, maintained the same economic policy regime created under President Cardoso. Innovations would be introduced in social policy and, to some extent, in industrial policies. Macroeconomic management policies, however, were maintained largely intact.  On December 2003, Tax Reform was approved by Congress. 4)- Results of financial and fiscal reform:  The consolidated budget shifted from a primary deficit of almost 0.2 percent of GDP per year in 1995-98 to a surplus of almost 4 percent of GDP on average during 1999-2005.  In 2007, the surplus reached 3.98 percent, exceeding the target of 3.75 percent (See Figure 1), and the surplus for 2008 is expected to improve further, reaching 4.27 percent, despite worsening of economic conditions. Financial and Fiscal Reform.
  • 46.
     Brazil, alongwith Korea, is one of the countries that has had experience with both import substitution and export promotion policies.  Brazil's long-favorable foreign-trade balance deteriorated substantially between 1958 and 1974 as a result of industrial expansion, which necessitated increased imports of industrial capital goods and petroleum.  During 1975/76 and again from 1978 to 1982, the foreign-trade balance was in deficit.  Beginning in 1983, Brazil recorded trade surpluses: $5.1 billion in 1983, $11.8 billion in 1984, and $11.3 billion in 1985. This achievement was the result of policies that restricted imports and offered substantial incentives to exporters. 46 FINANCIAL AND FISCAL REFORM
  • 47.
     The exportpromotion policies, adopted before 1990, have been successful and went to the favor of brazil in many respects. For example.  In the last ten years of the import substitution phase, the average annual growth rates of GDP, industrial output, and manufacturing employment were roughly 5, 6, and 2 percent respectively.  After export promotion policies were introduced these rates increased dramatically. In the period 1966- 75 they with averaged 9, 11, and 10 percent. Export Promotion Policy.
  • 48.
     Between 1998-93,a wide-ranging process of liberalization took place,in which the principal non-tariff barriers were eliminated and the level and degree of protection for local industry was gradually reduced.  The new Industrial and Foreign Trade Policy was introduced, abolishing most of the non-tariff barriers inherited from the period of import substitution, and defining a timeframe for the reduction of import tariffs.  Products without a domestic equivalent, with a distinct competitive advantage and a high degree of national protection, as well as to low value-added commodities were exempted from tariffs.  Rates of 10% and 15% were applied to sectors making heavy use of raw materials subject to a zero tariff.  Most manufactured products were subject to a tariff of 20%, with a 30% tariff applied to fine chemicals, wheat, pasta, record players.  The automobile and computer sectors were subject to nominal tariffs of 35% and 40% respectively. Promotion Export Policy.
  • 49.
  • 50.
  • 51.
     Brazilian exportoutstripped imports between 2000 and 2015, and reflect positive trade balance from the internal and external adjustment carried out in response to changes and reforms in trade policy.  With exceptional weakness of the economy in 2014 relates to external factors, such as the deterioration in the terms of trade, the slowdown in activity in the economies of major trading partners (China and Argentina) and disturbances associated with monetary policy normalization in the United States, and also domestic aspects. The Beginning of Trade Surplus.
  • 53.
     There wasa major change beginning in 2004. GDP per person grew at a rate of 2.5% annually from 2003-2014,compered to 0.8% annual growth (1995-2002).  Since the Workers’ Party came to power with President Lula taking office in 2003, poverty has been reduced by over 55 percent, from 35.8 percent of the population to 15.9 percent in 2012.  There were also large improvements with regard to income inequality, the top 10 percent of households received more than half of all income gains between (1993-2002), but this fell to about 33% for 2003-2012. The biggest gainers were the 40 percent below the median: they nearly doubled their share of income gains from 11.3 to 21.1 percent.  Huge foreign investment is being done in transport and port infrastructure because of Olympic 2016.  Earning from Olympics 2016 as well as infrastructure development will boost the economic progress in the coming years.. Conclusion
  • 54.