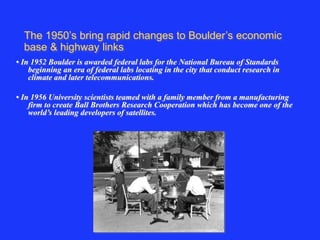
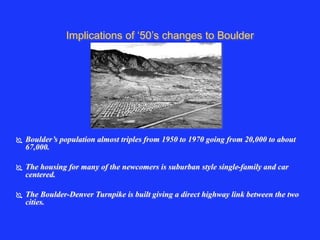
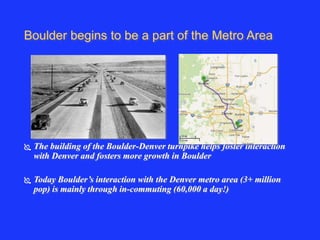
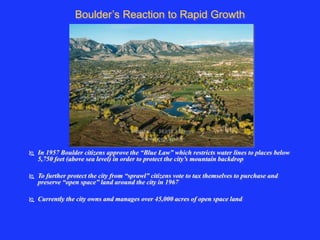
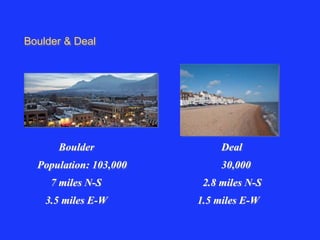
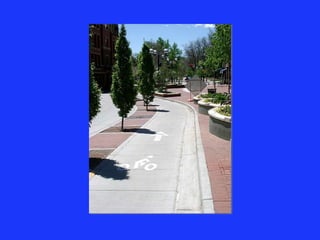
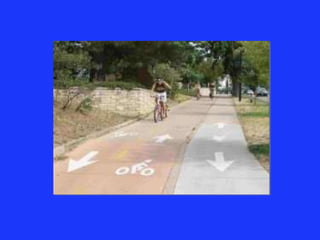
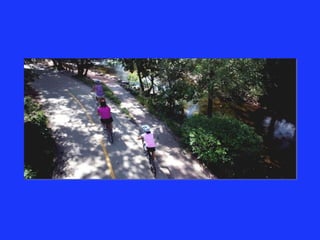
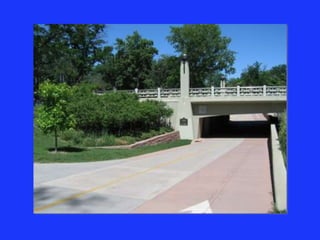
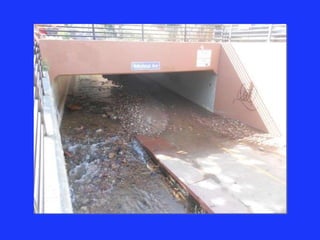
Boulder: An Intro & History 
What is unique about Boulder that has allowed it to build 
and maintain an alternative transportation network.
Comparing Great Britain & Colorado 
Land Area 
Great Britain Colorado 
229,848 km² 269,837 km² 
Population 
60 million 5.2 million (same as Scotland) 
Land’s End to John O’Groats Julesburg (NE) to Cortez (SW) 
874 miles 559 miles (9 hours driving time)
Boulder’s Founding 
ļƒ First non-native settlement in 
1858 as a gateway to gold/silver 
mining in mountains 
ļƒ Until 1876 most of Boulder’s 
economy is based on movement 
of supplies and people to and 
from mining camps in the 
mountains to the west
Early decisions begin to move Boulder away 
from its resource based economy 
ļƒ Citizens lobby the territorial 
legislature to select Boulder as the 
site for the State university - it opens 
in 1876 
ļƒ In 1898 the Chautauqua movement 
comes to Boulder bringing teachers 
from Texas to Boulder for 
educational and recreational 
purposes 
ļƒ The city of Boulder bought open 
space land for Chautauqua - setting 
a precedence that lasts to this day
Tourism Continued 
ļƒBy 1905 citizens realize the city 
needs to find a more diverse 
economic base and thus actively 
seek tourists.
The 1950’s bring rapid changes to Boulder’s economic 
base & highway links 
• In 1952 Boulder is awarded federal labs for the National Bureau of Standards 
beginning an era of federal labs locating in the city that conduct research in 
climate and later telecommunications. 
• In 1956 University scientists teamed with a family member from a manufacturing 
firm to create Ball Brothers Research Cooperation which has become one of the 
world’s leading developers of satellites.
Implications of ā€˜50’s changes to Boulder 
ļƒ Boulder’s population almost triples from 1950 to 1970 going from 20,000 to about 
67,000. 
ļƒ The housing for many of the newcomers is suburban style single-family and car 
centered. 
ļƒ The Boulder-Denver Turnpike is built giving a direct highway link between the two 
cities.
Boulder begins to be a part of the Metro Area 
ļƒ The building of the Boulder-Denver turnpike helps foster interaction 
with Denver and fosters more growth in Boulder 
ļƒ Today Boulder’s interaction with the Denver metro area (3+ million 
pop) is mainly through in-commuting (60,000 a day!)
Boulder’s Reaction to Rapid Growth 
ļƒ In 1957 Boulder citizens approve the ā€œBlue Lawā€ which restricts water lines to places below 
5,750 feet (above sea level) in order to protect the city’s mountain backdrop 
ļƒ To further protect the city from ā€œsprawlā€ citizens vote to tax themselves to purchase and 
preserve ā€œopen spaceā€ land around the city in 1967 
ļƒ Currently the city owns and manages over 45,000 acres of open space land
And Boulder’s economy continues to become more and 
more based in the sciences 
ļƒ More federal labs such as NCAR (above) and NOAA come to Boulder 
ļƒ By the 1980s public-private partnerships mean Boulder has become a 
center for research and inovation
Boulder’s Economic Base Today 
ļƒ Aerospace 
ļƒ Biosciences 
ļƒ Information Technology – Data storage 
ļƒ Information Technology – Software development 
ļƒ Accommodation and food services 
ļƒ Natural and Organic Products 
ļƒOutdoor Recreation 
ļƒ Renewable Energy
Boulder’s Economic Base Continued 
ļƒA high concentration of advanced 
technology industries has helped fuel 
venture capital investment in Boulder firms. 
ļƒOver the past five years more than $687 
million was invested in firms in the city of 
Boulder, representing more than one - 
quarter of the total VC investment in 
Colorado companies.
Tourism & the Economy 
ļƒ Estimated visitor nights in 2013 totaled 2,820,827 in 
Boulder and total visitor expenditures reached $375.8 
million. The total economic impact of tourism in 
Boulder (direct economic impact plus secondary 
impact) was $419,111,633
Boulder’s citizens have a high level of education 
ļƒMuch higher than the US as a whole and thus in general have traveled 
a great deal and have strong opinions about the physical appearance of 
their city.
What does all this mean for Boulder and alternative 
transportation? 
ļƒ Boulder’s highly educated and affluent citizens have voted multiple times 
since the 1960s to tax themselves to acquire open space and more recently, 
to create bike paths, etc. 
ļƒ The city’s planning and transportation departments continues to work on 
making non-motorized trips within the city easier 
ļƒ In addition to multi-use paths and bike lanes, there is an extensive bus 
system within the city
Unintended consequences of Boulder’s slow growth policies 
ļƒ Median Household Price $500,000+ up from $222,560 
(in today’s prices) from 1990 
ļƒ Losing middle income households ($65,000 – 
$150,000) a year in income) 
ļƒ 59% of Boulder’s workforce commutes in every day 
(60,000) mostly in singly-occupancy vehicles
Intended Consequences of Transportation Policies 
ļƒ Boulder residents bike 20 times more and walk three times more than the 
national average – Marni Ratzel (city transportation planner) 
ļƒ Boulder County Colorado US 
ļƒ Average travel time to work 20.1 min 22.8 24.5 25.5 
ļƒ Drive alone to work 54% 64% 75.5% 76.4% 
ļƒ Use alternative transportation 34.2% 24.7% 18.2% 19.3% 
ļƒ Work at home 11.8% 11.3% 6.3% 4.3%
Boulder & Deal 
Boulder Deal 
Population: 103,000 30,000 
7 miles N-S 2.8 miles N-S 
3.5 miles E-W 1.5 miles E-W
Boulder transportation

Boulder transportation

  • 1.
    Boulder: An Intro& History What is unique about Boulder that has allowed it to build and maintain an alternative transportation network.
  • 3.
    Comparing Great Britain& Colorado Land Area Great Britain Colorado 229,848 km² 269,837 km² Population 60 million 5.2 million (same as Scotland) Land’s End to John O’Groats Julesburg (NE) to Cortez (SW) 874 miles 559 miles (9 hours driving time)
  • 4.
    Boulder’s Founding ļƒFirst non-native settlement in 1858 as a gateway to gold/silver mining in mountains ļƒ Until 1876 most of Boulder’s economy is based on movement of supplies and people to and from mining camps in the mountains to the west
  • 5.
    Early decisions beginto move Boulder away from its resource based economy ļƒ Citizens lobby the territorial legislature to select Boulder as the site for the State university - it opens in 1876 ļƒ In 1898 the Chautauqua movement comes to Boulder bringing teachers from Texas to Boulder for educational and recreational purposes ļƒ The city of Boulder bought open space land for Chautauqua - setting a precedence that lasts to this day
  • 6.
    Tourism Continued ļƒBy1905 citizens realize the city needs to find a more diverse economic base and thus actively seek tourists.
  • 7.
    The 1950’s bringrapid changes to Boulder’s economic base & highway links • In 1952 Boulder is awarded federal labs for the National Bureau of Standards beginning an era of federal labs locating in the city that conduct research in climate and later telecommunications. • In 1956 University scientists teamed with a family member from a manufacturing firm to create Ball Brothers Research Cooperation which has become one of the world’s leading developers of satellites.
  • 8.
    Implications of ā€˜50’schanges to Boulder ļƒ Boulder’s population almost triples from 1950 to 1970 going from 20,000 to about 67,000. ļƒ The housing for many of the newcomers is suburban style single-family and car centered. ļƒ The Boulder-Denver Turnpike is built giving a direct highway link between the two cities.
  • 9.
    Boulder begins tobe a part of the Metro Area ļƒ The building of the Boulder-Denver turnpike helps foster interaction with Denver and fosters more growth in Boulder ļƒ Today Boulder’s interaction with the Denver metro area (3+ million pop) is mainly through in-commuting (60,000 a day!)
  • 10.
    Boulder’s Reaction toRapid Growth ļƒ In 1957 Boulder citizens approve the ā€œBlue Lawā€ which restricts water lines to places below 5,750 feet (above sea level) in order to protect the city’s mountain backdrop ļƒ To further protect the city from ā€œsprawlā€ citizens vote to tax themselves to purchase and preserve ā€œopen spaceā€ land around the city in 1967 ļƒ Currently the city owns and manages over 45,000 acres of open space land
  • 12.
    And Boulder’s economycontinues to become more and more based in the sciences ļƒ More federal labs such as NCAR (above) and NOAA come to Boulder ļƒ By the 1980s public-private partnerships mean Boulder has become a center for research and inovation
  • 13.
    Boulder’s Economic BaseToday ļƒ Aerospace ļƒ Biosciences ļƒ Information Technology – Data storage ļƒ Information Technology – Software development ļƒ Accommodation and food services ļƒ Natural and Organic Products ļƒOutdoor Recreation ļƒ Renewable Energy
  • 14.
    Boulder’s Economic BaseContinued ļƒA high concentration of advanced technology industries has helped fuel venture capital investment in Boulder firms. ļƒOver the past five years more than $687 million was invested in firms in the city of Boulder, representing more than one - quarter of the total VC investment in Colorado companies.
  • 15.
    Tourism & theEconomy ļƒ Estimated visitor nights in 2013 totaled 2,820,827 in Boulder and total visitor expenditures reached $375.8 million. The total economic impact of tourism in Boulder (direct economic impact plus secondary impact) was $419,111,633
  • 16.
    Boulder’s citizens havea high level of education ļƒMuch higher than the US as a whole and thus in general have traveled a great deal and have strong opinions about the physical appearance of their city.
  • 17.
    What does allthis mean for Boulder and alternative transportation? ļƒ Boulder’s highly educated and affluent citizens have voted multiple times since the 1960s to tax themselves to acquire open space and more recently, to create bike paths, etc. ļƒ The city’s planning and transportation departments continues to work on making non-motorized trips within the city easier ļƒ In addition to multi-use paths and bike lanes, there is an extensive bus system within the city
  • 18.
    Unintended consequences ofBoulder’s slow growth policies ļƒ Median Household Price $500,000+ up from $222,560 (in today’s prices) from 1990 ļƒ Losing middle income households ($65,000 – $150,000) a year in income) ļƒ 59% of Boulder’s workforce commutes in every day (60,000) mostly in singly-occupancy vehicles
  • 19.
    Intended Consequences ofTransportation Policies ļƒ Boulder residents bike 20 times more and walk three times more than the national average – Marni Ratzel (city transportation planner) ļƒ Boulder County Colorado US ļƒ Average travel time to work 20.1 min 22.8 24.5 25.5 ļƒ Drive alone to work 54% 64% 75.5% 76.4% ļƒ Use alternative transportation 34.2% 24.7% 18.2% 19.3% ļƒ Work at home 11.8% 11.3% 6.3% 4.3%
  • 20.
    Boulder & Deal Boulder Deal Population: 103,000 30,000 7 miles N-S 2.8 miles N-S 3.5 miles E-W 1.5 miles E-W