Download to read offline


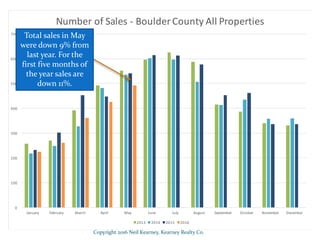
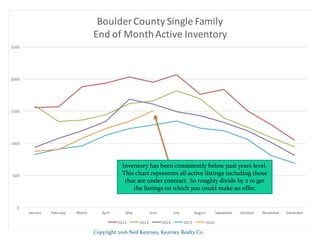
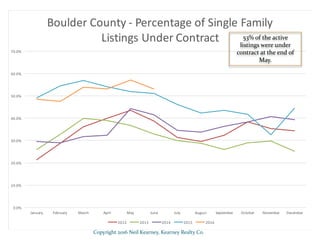
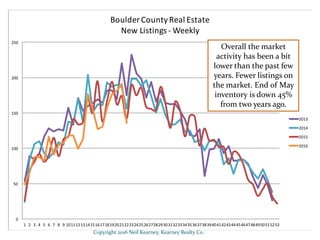
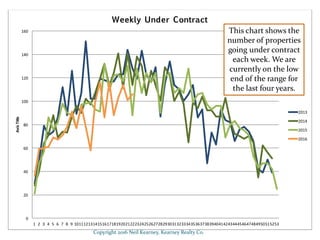
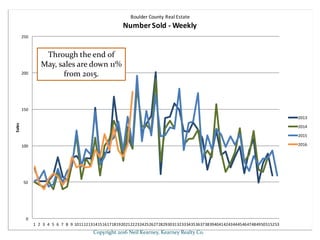


In Boulder County, total real estate sales fell by 9% in May and 11% in the first five months of the year compared to the previous year. Inventory levels are significantly low, with a 45% decrease in available listings since two years ago, leading to strong competition among buyers, particularly in lower price ranges. Despite low sales, home prices are rising rapidly, and sellers face risks if they overprice their properties.


