Download to read offline


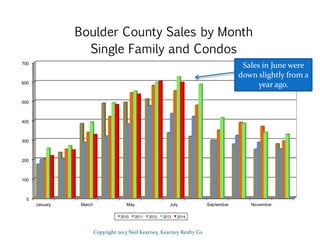
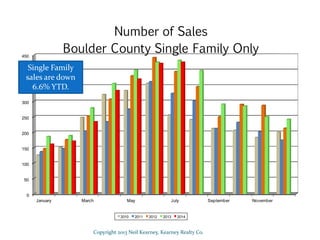
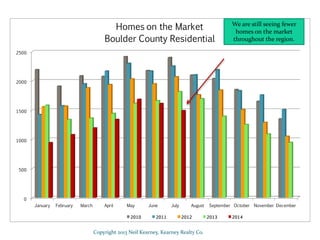
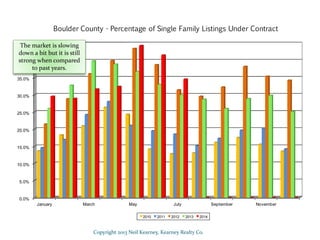
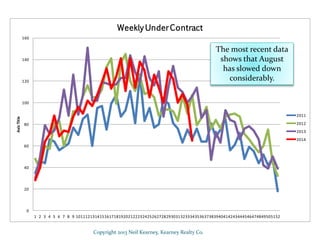
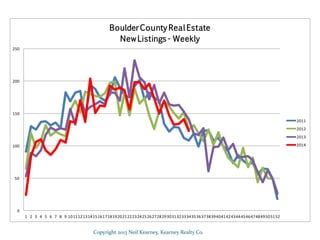
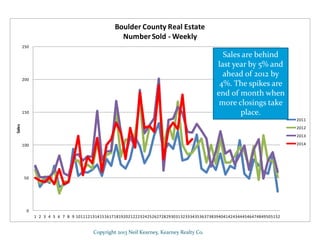


The document contains market data and analysis from Neil Kearney of Kearney Realty Co. It includes charts showing home sales, homes on the market, and homes under contract from 2010 to 2014 in Boulder County. The summary is: Single family home sales in Boulder County are down 6.6% year-to-date compared to last year. Homes on the market throughout the region continue to be fewer. The housing market has slowed in August compared to previous months and years but is still stronger than 2012.


