Downloaded 11 times
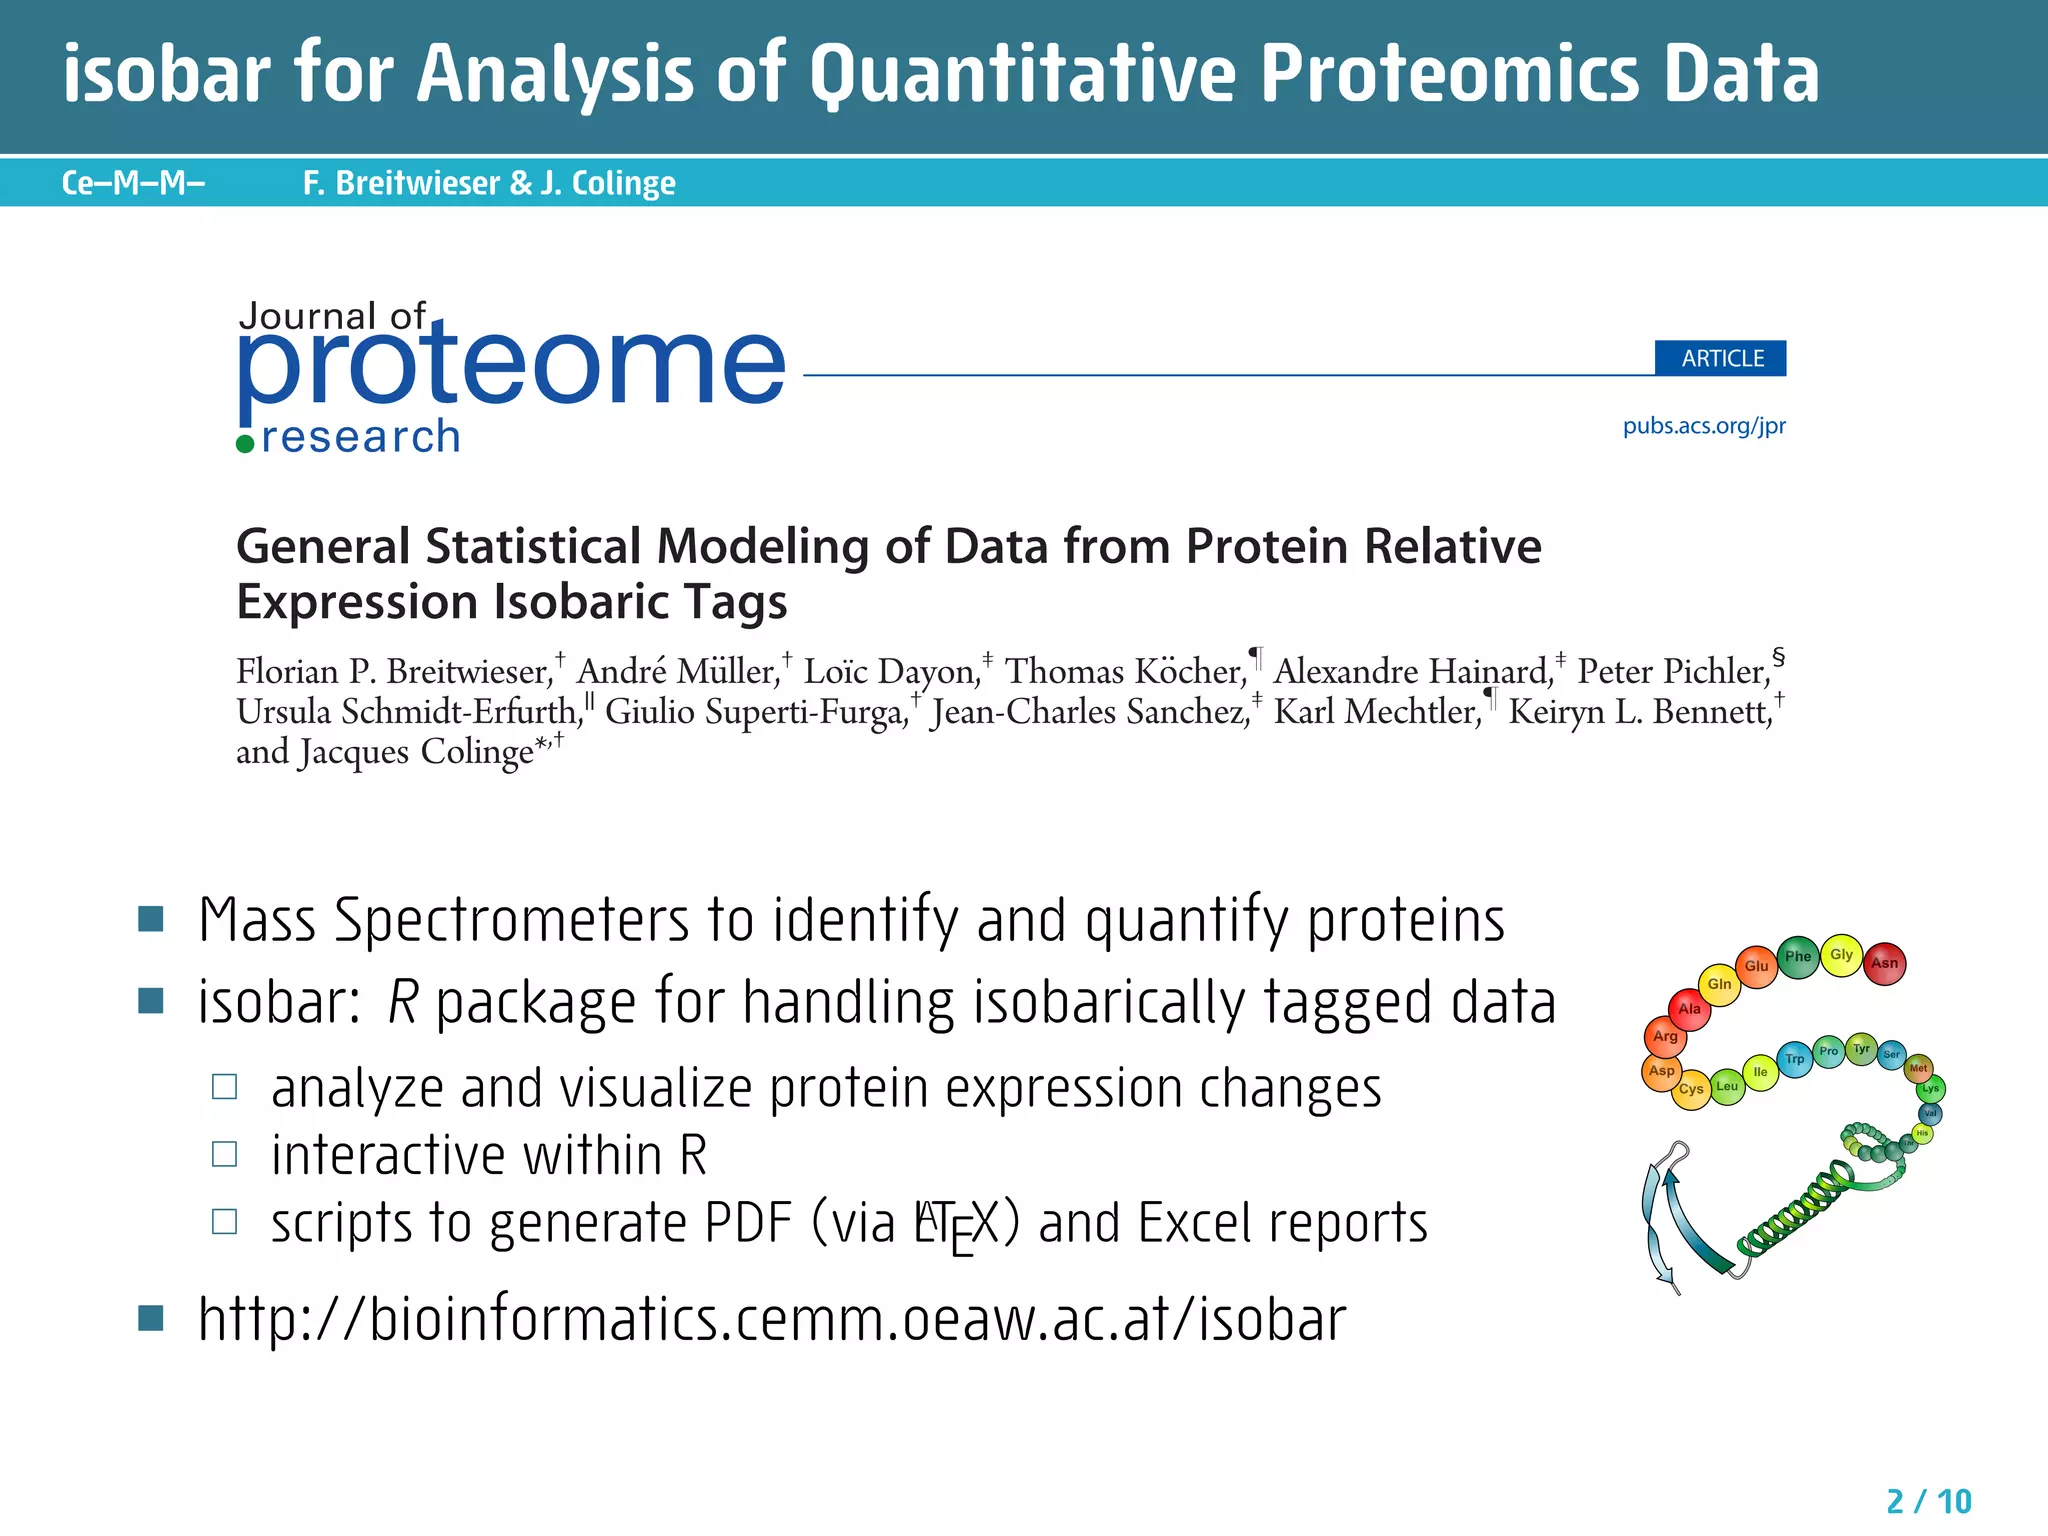
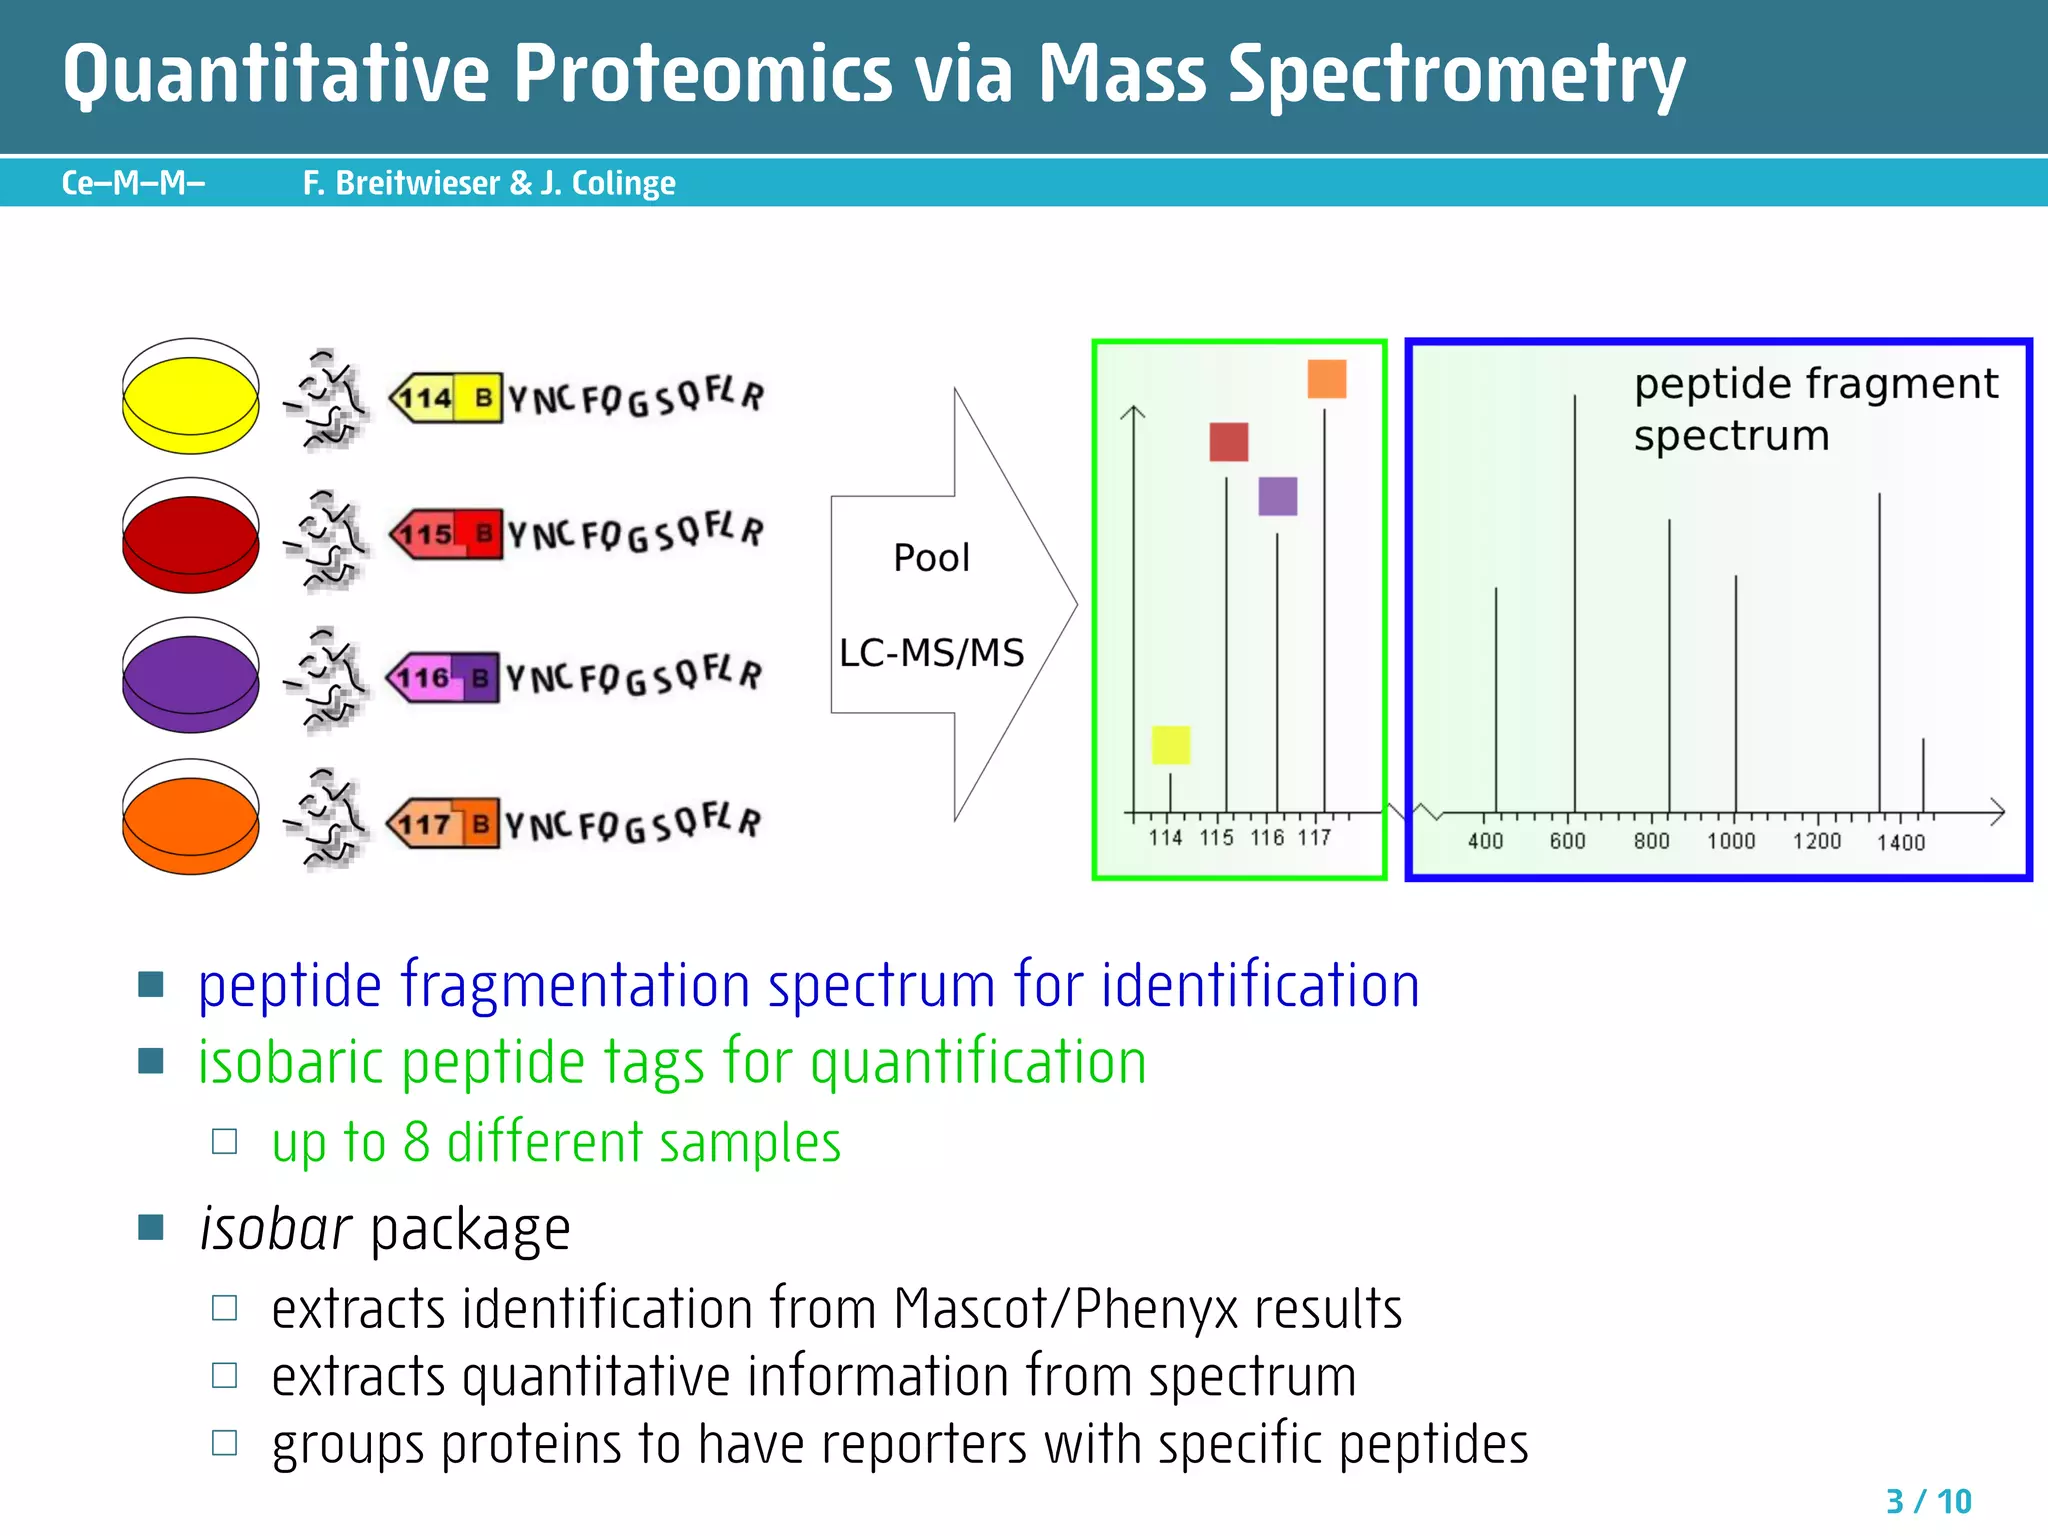
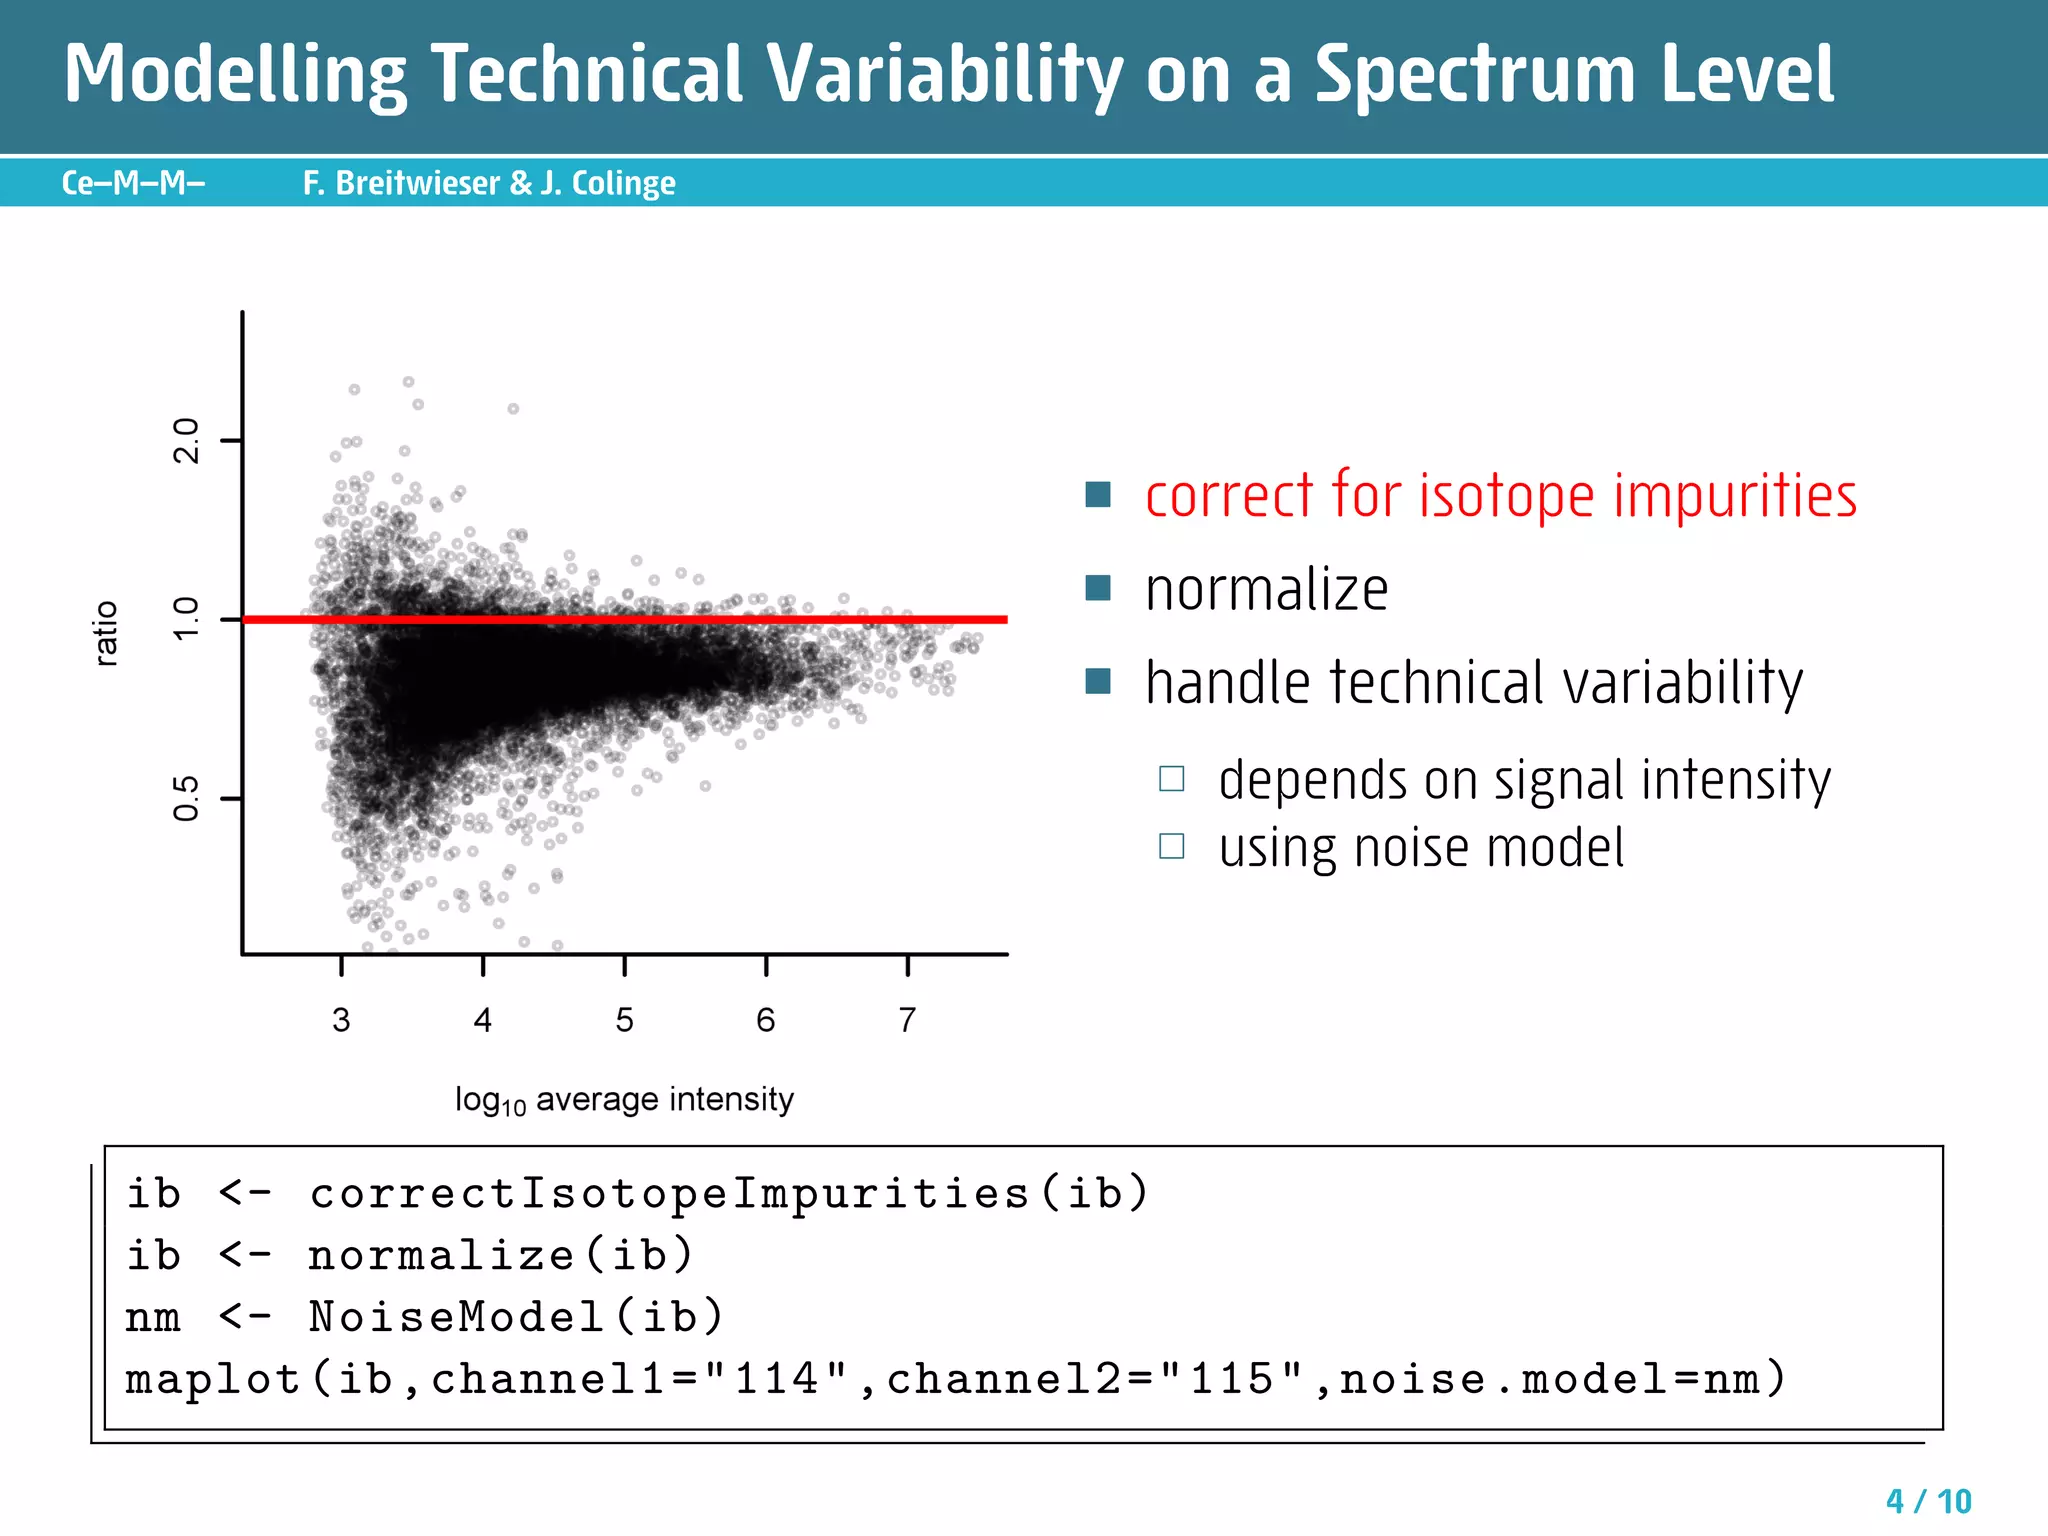
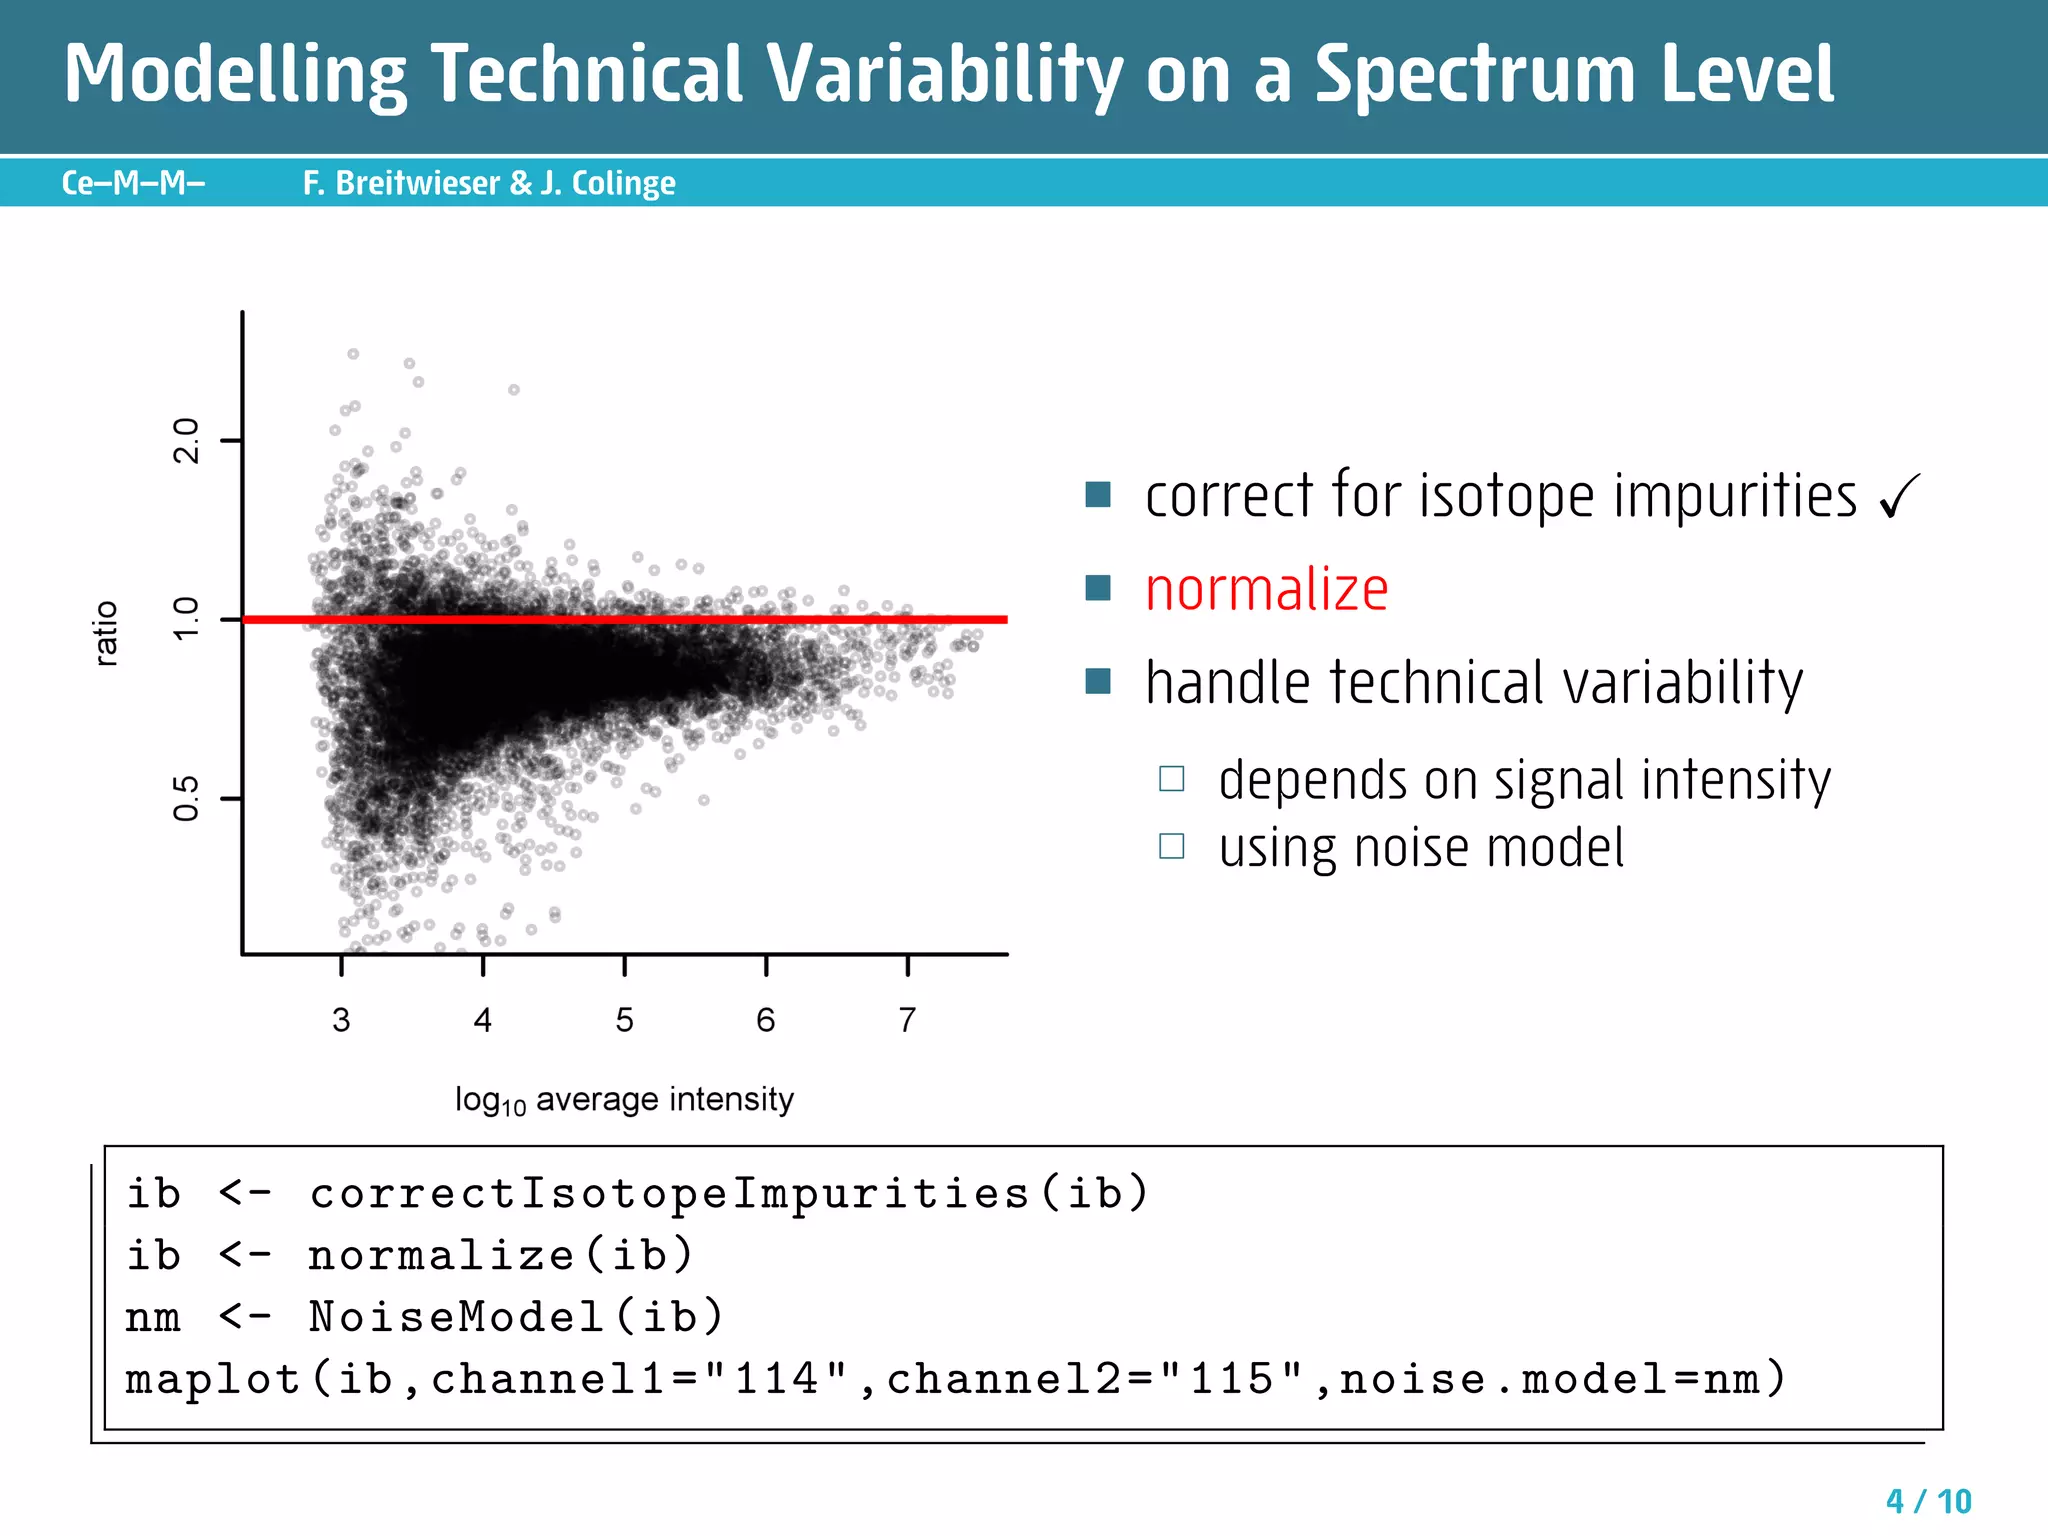
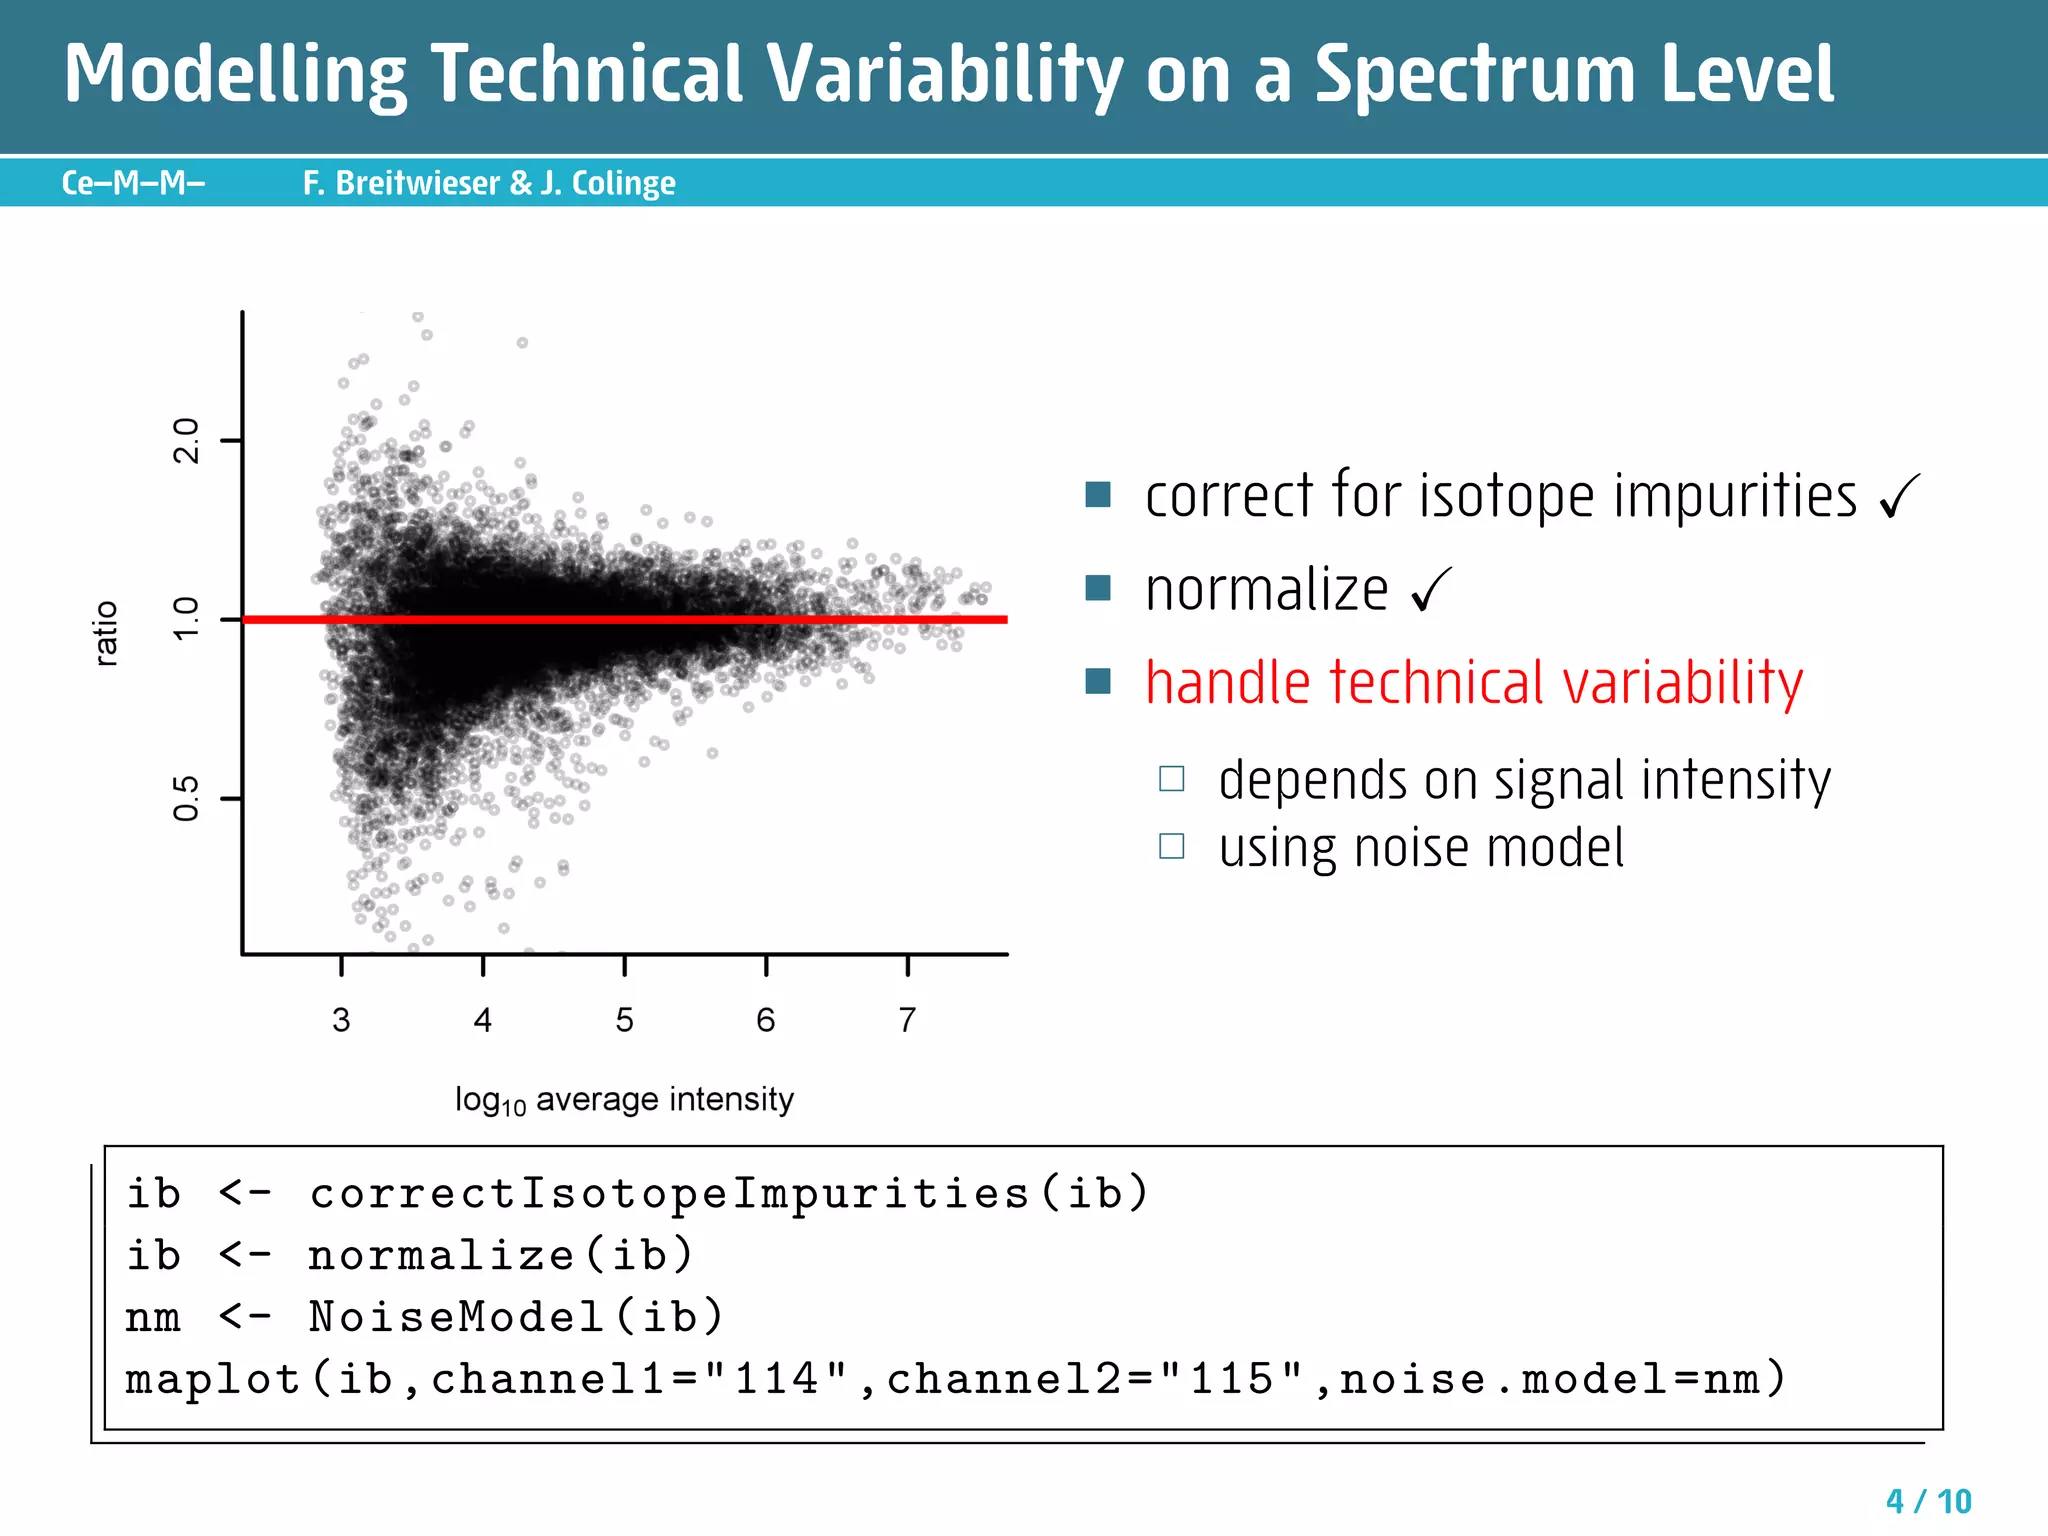
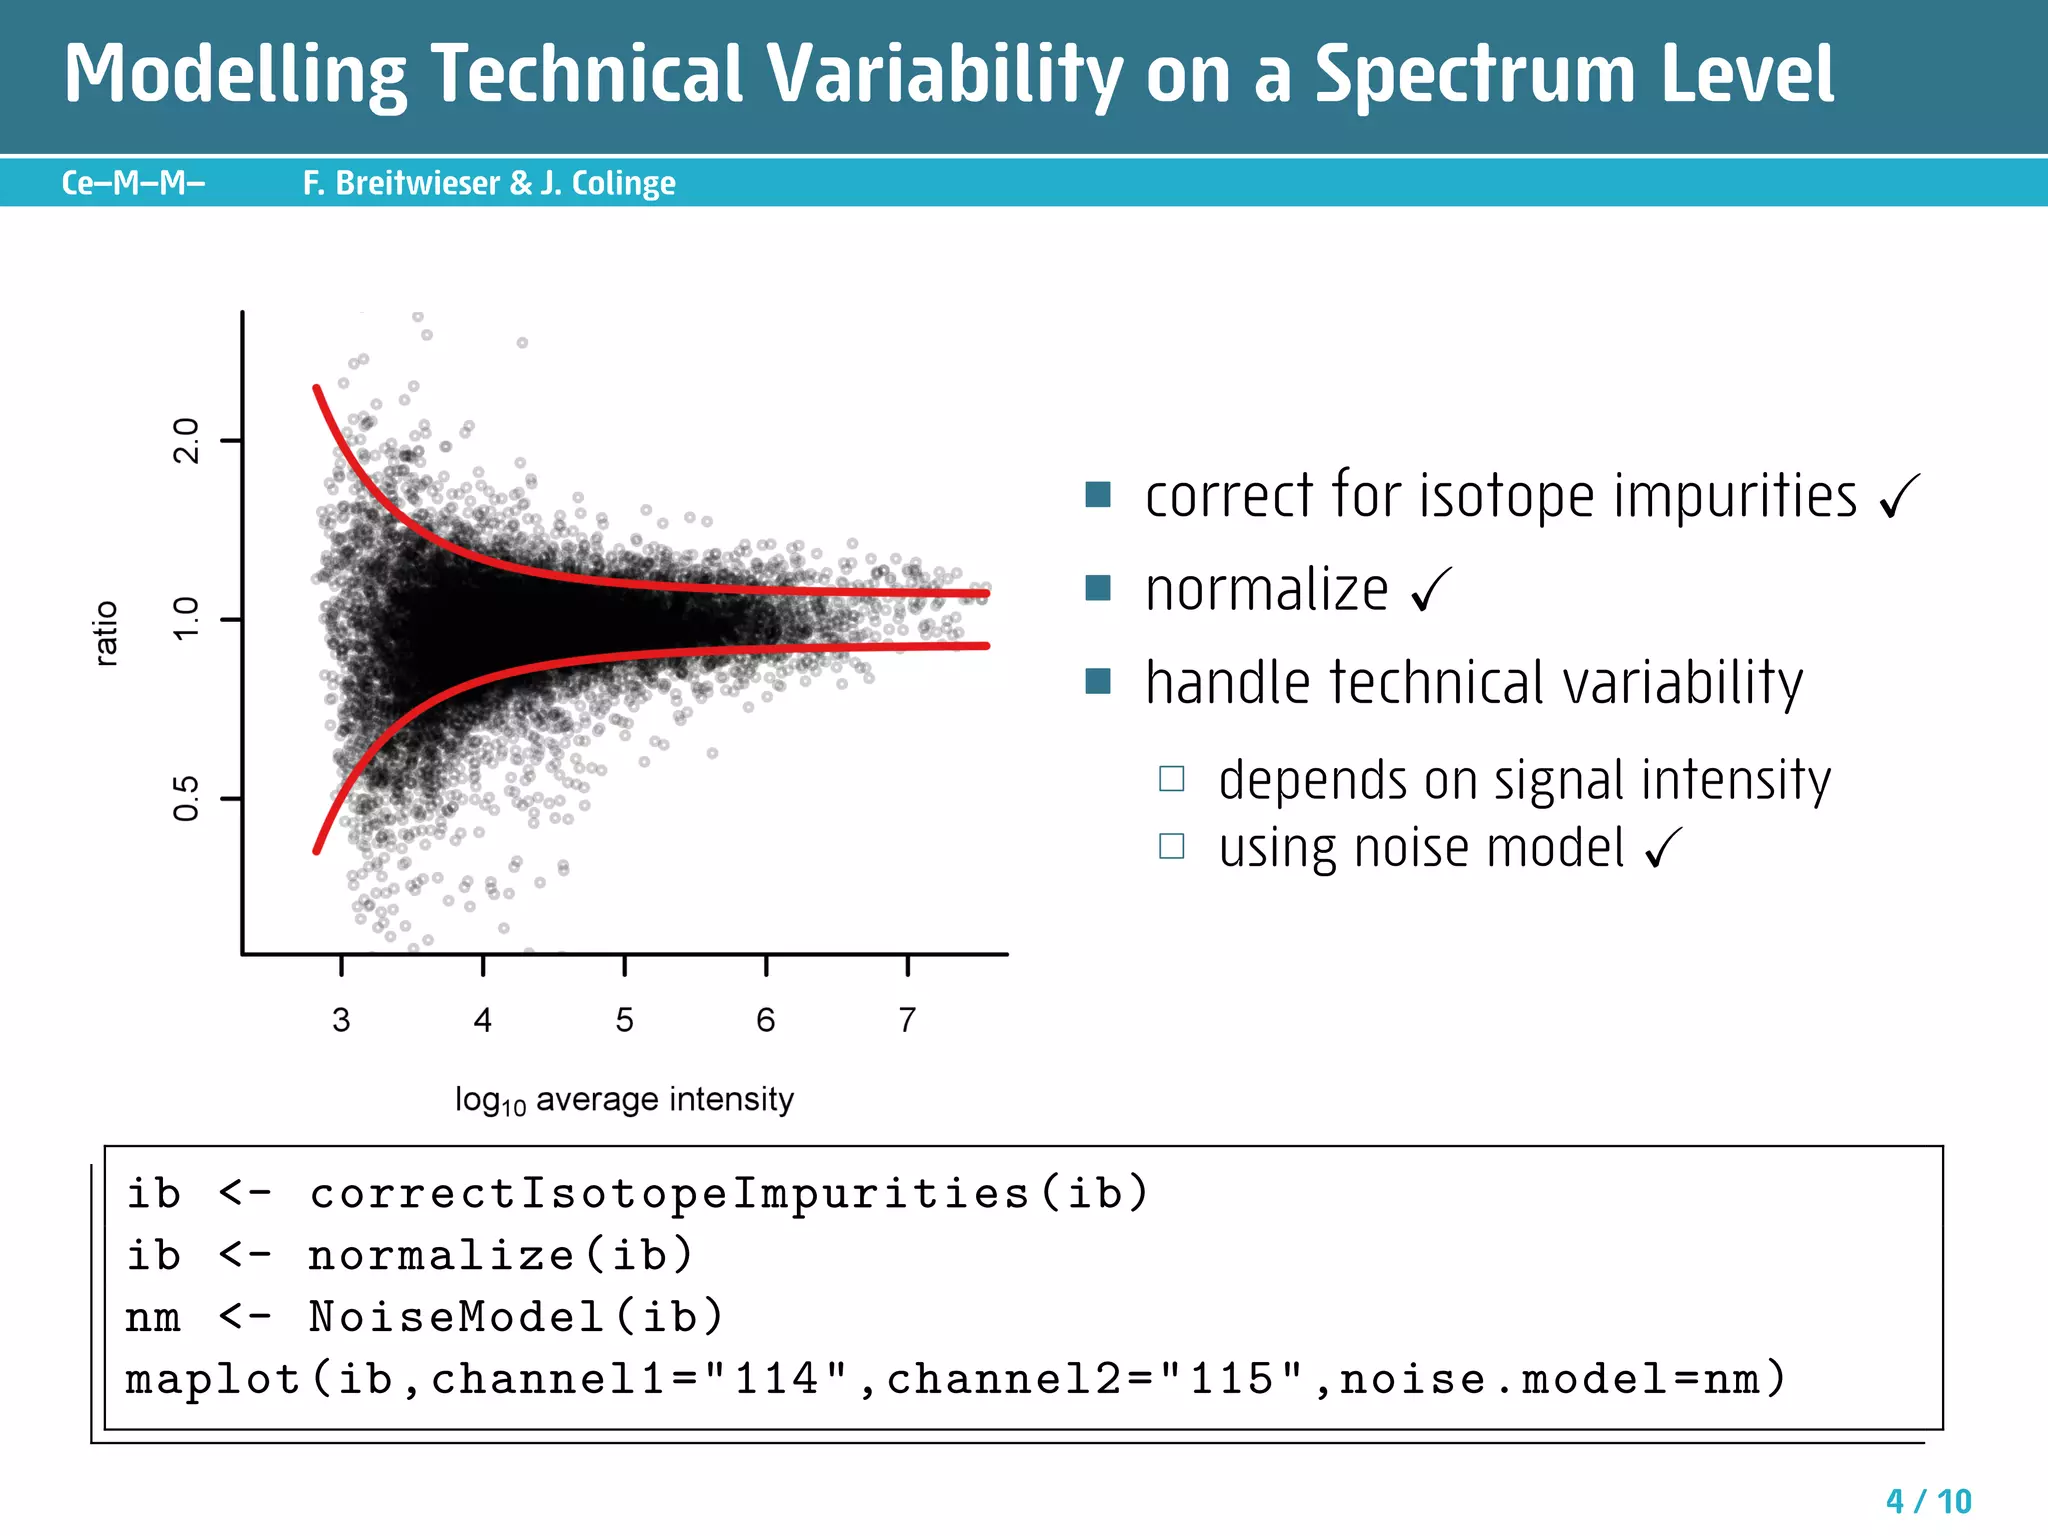
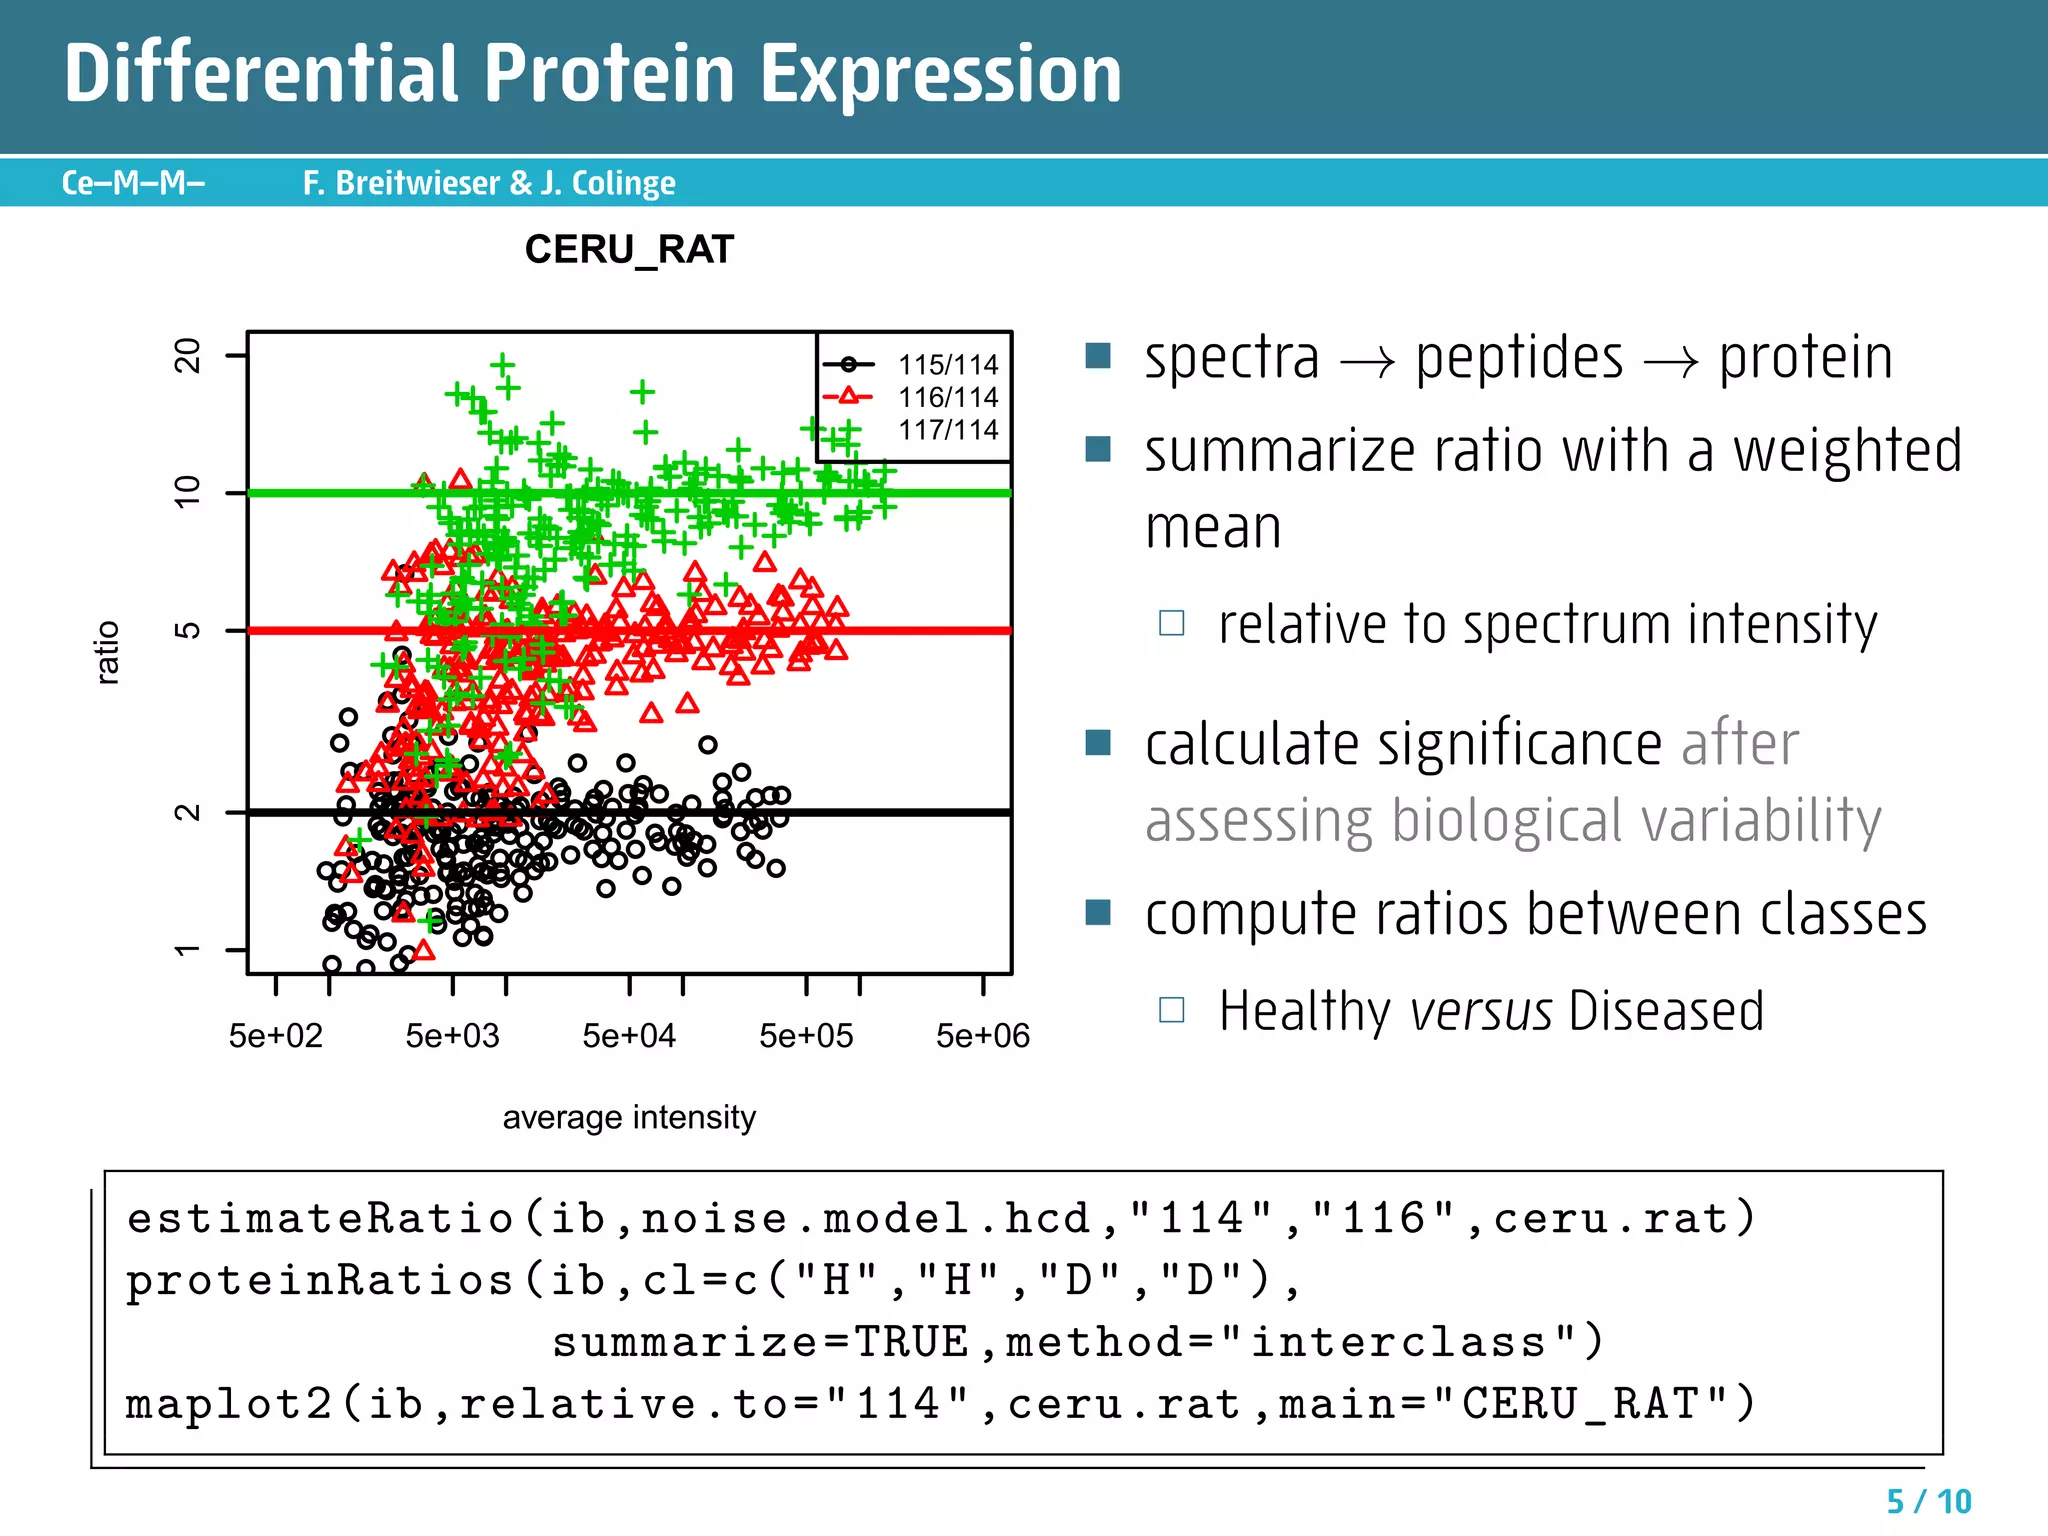
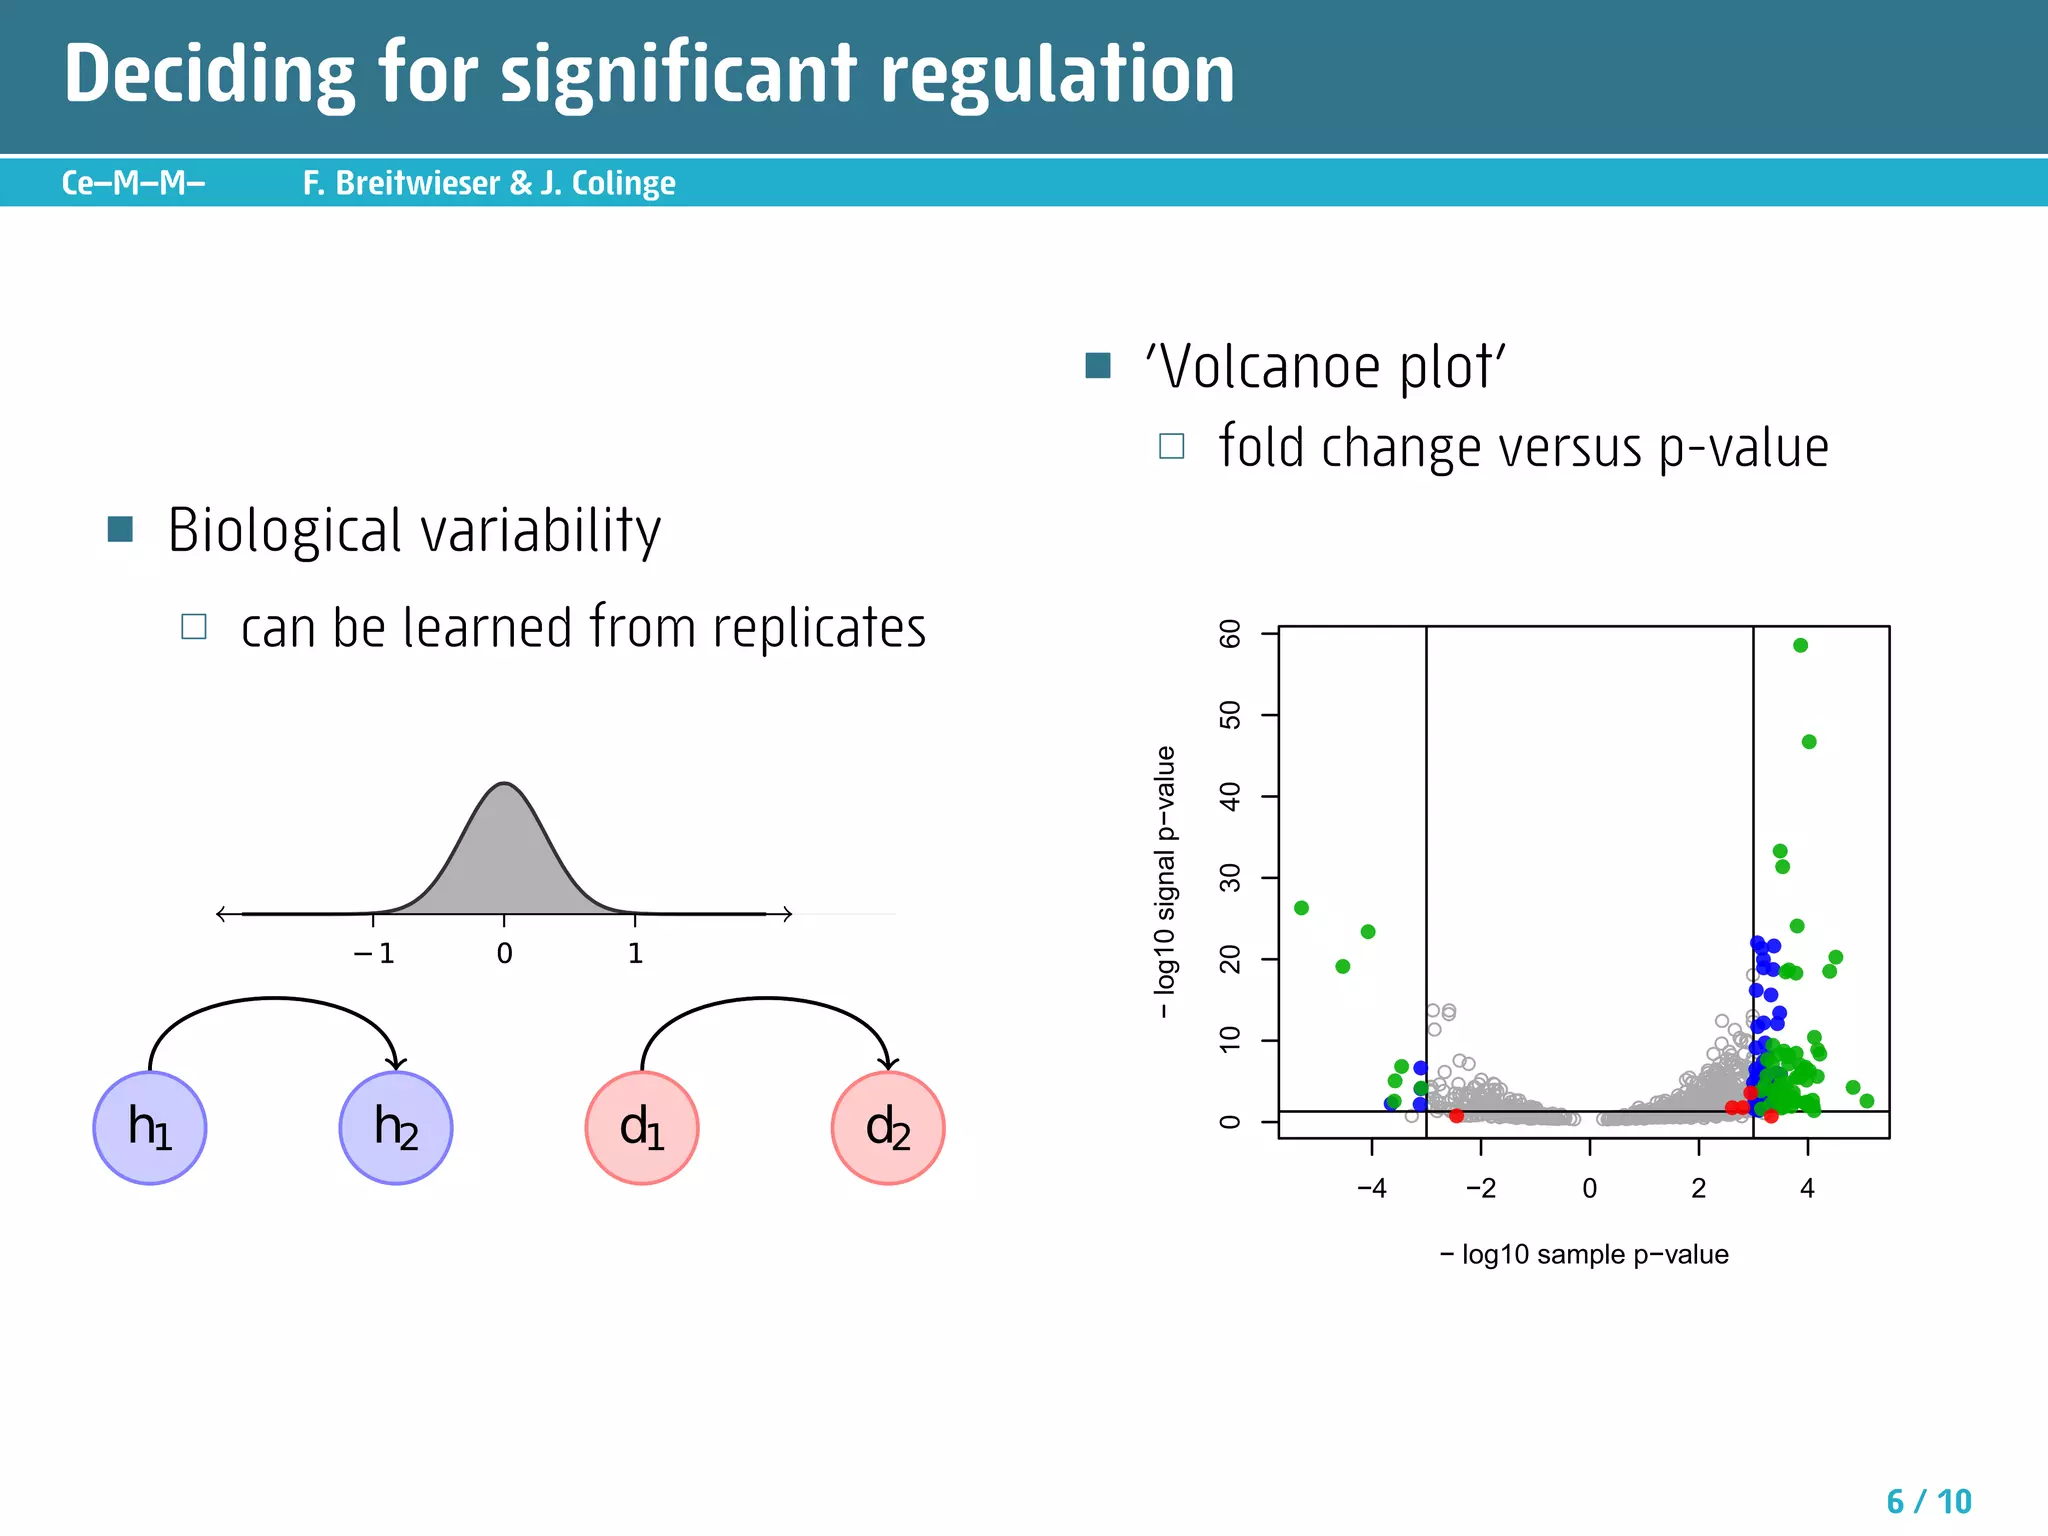
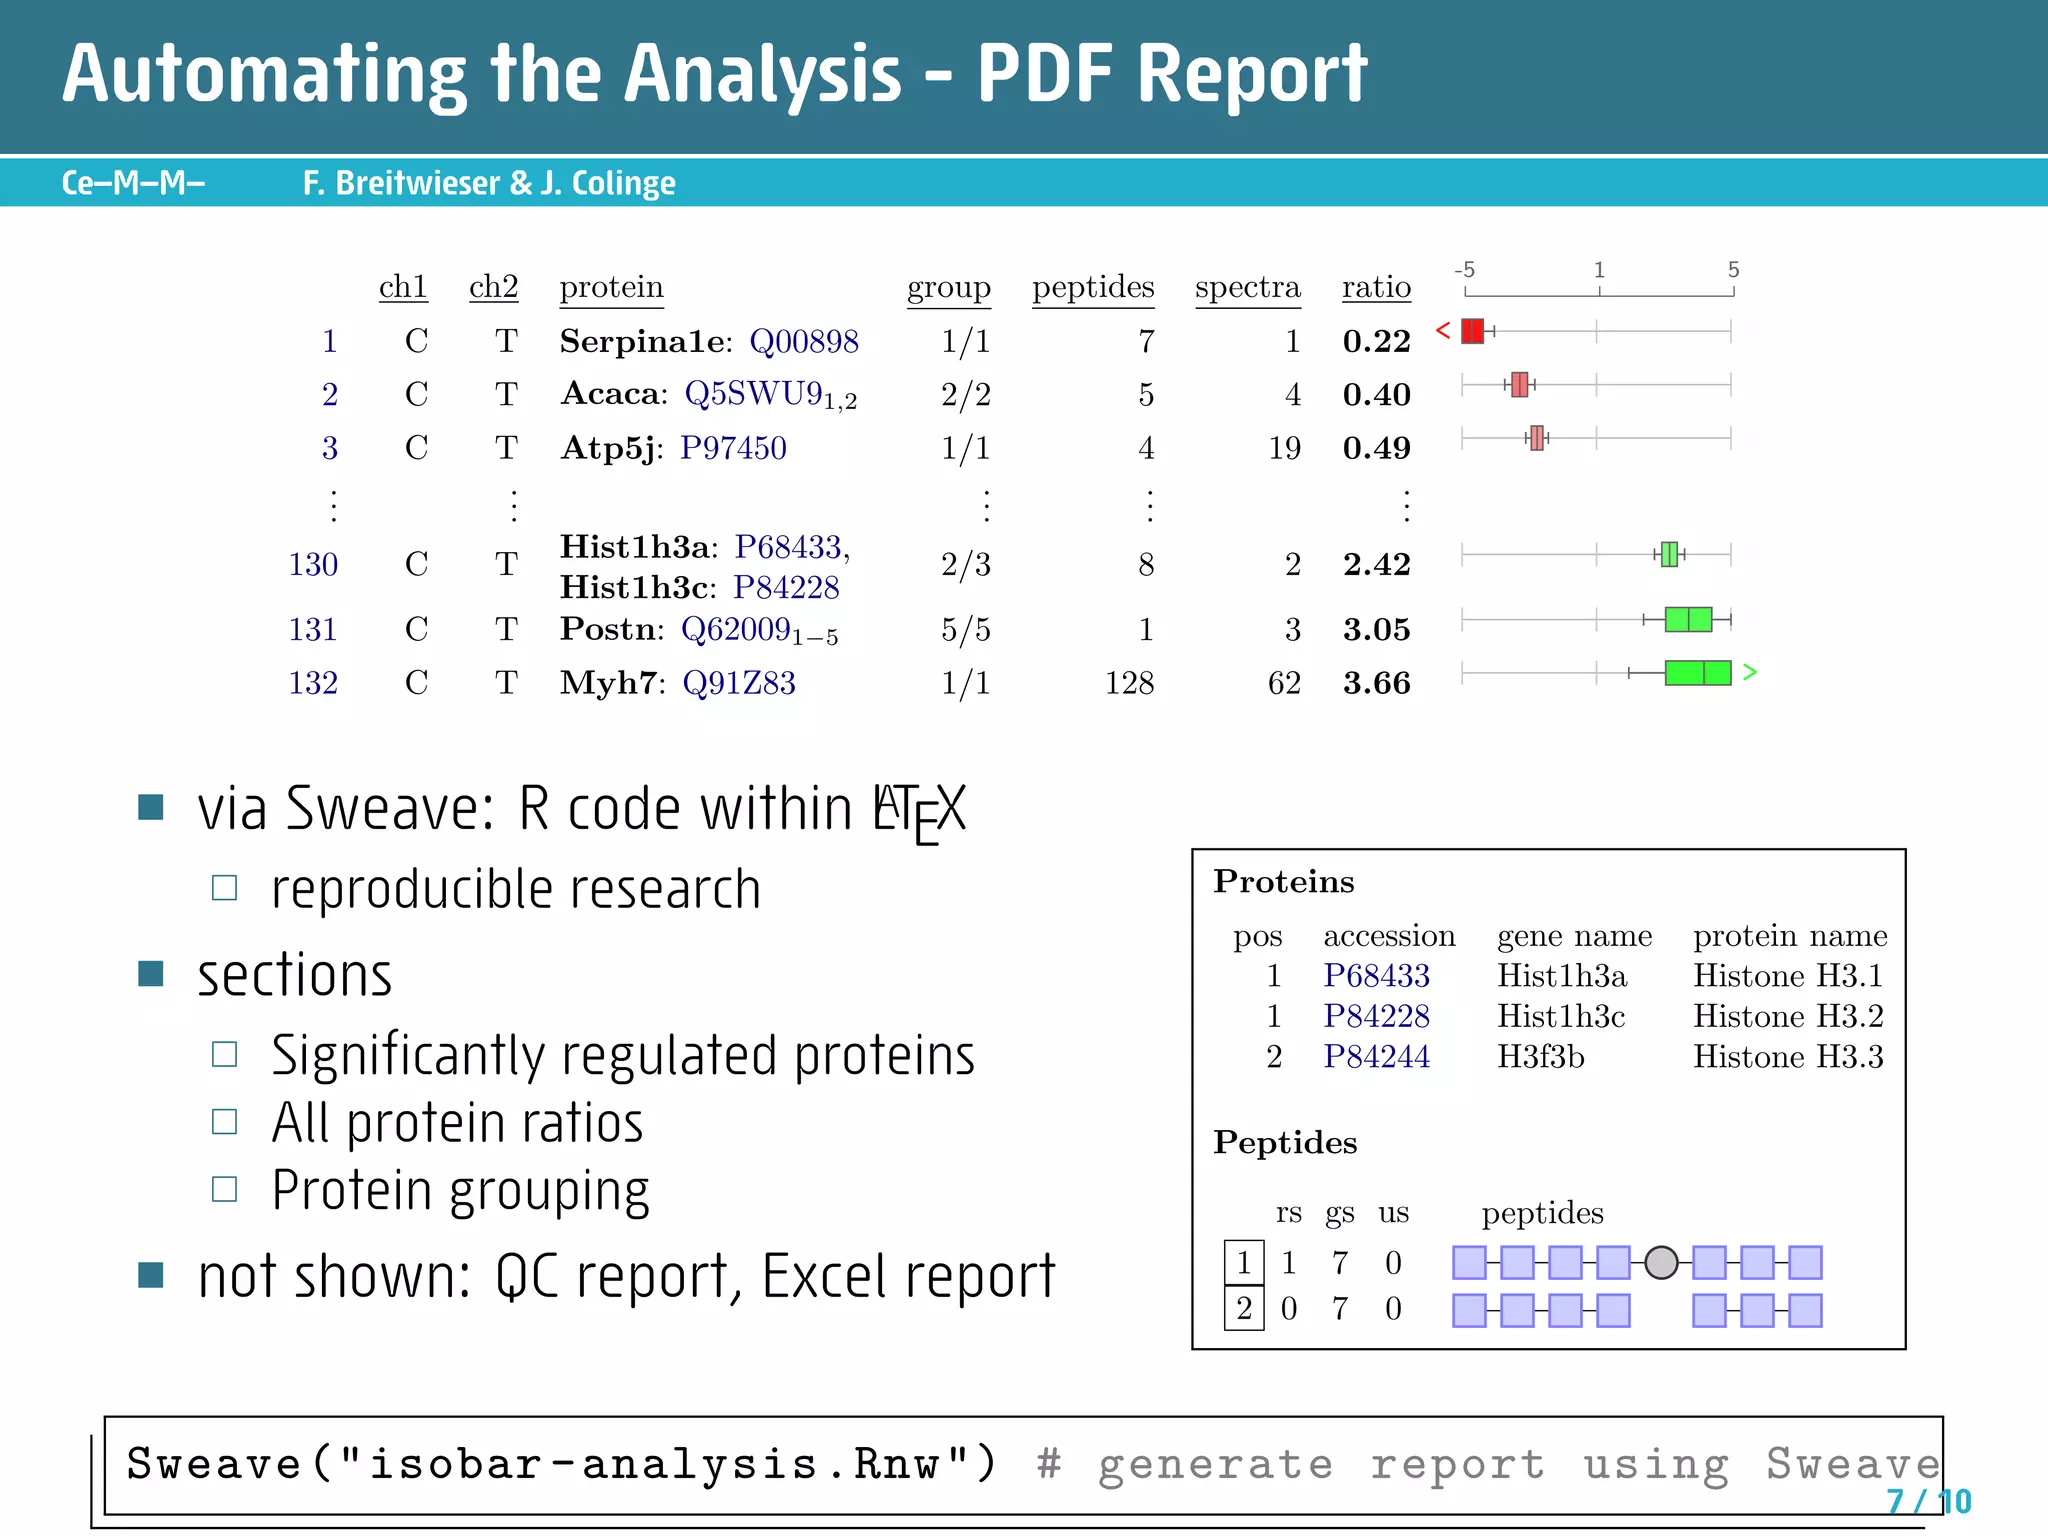
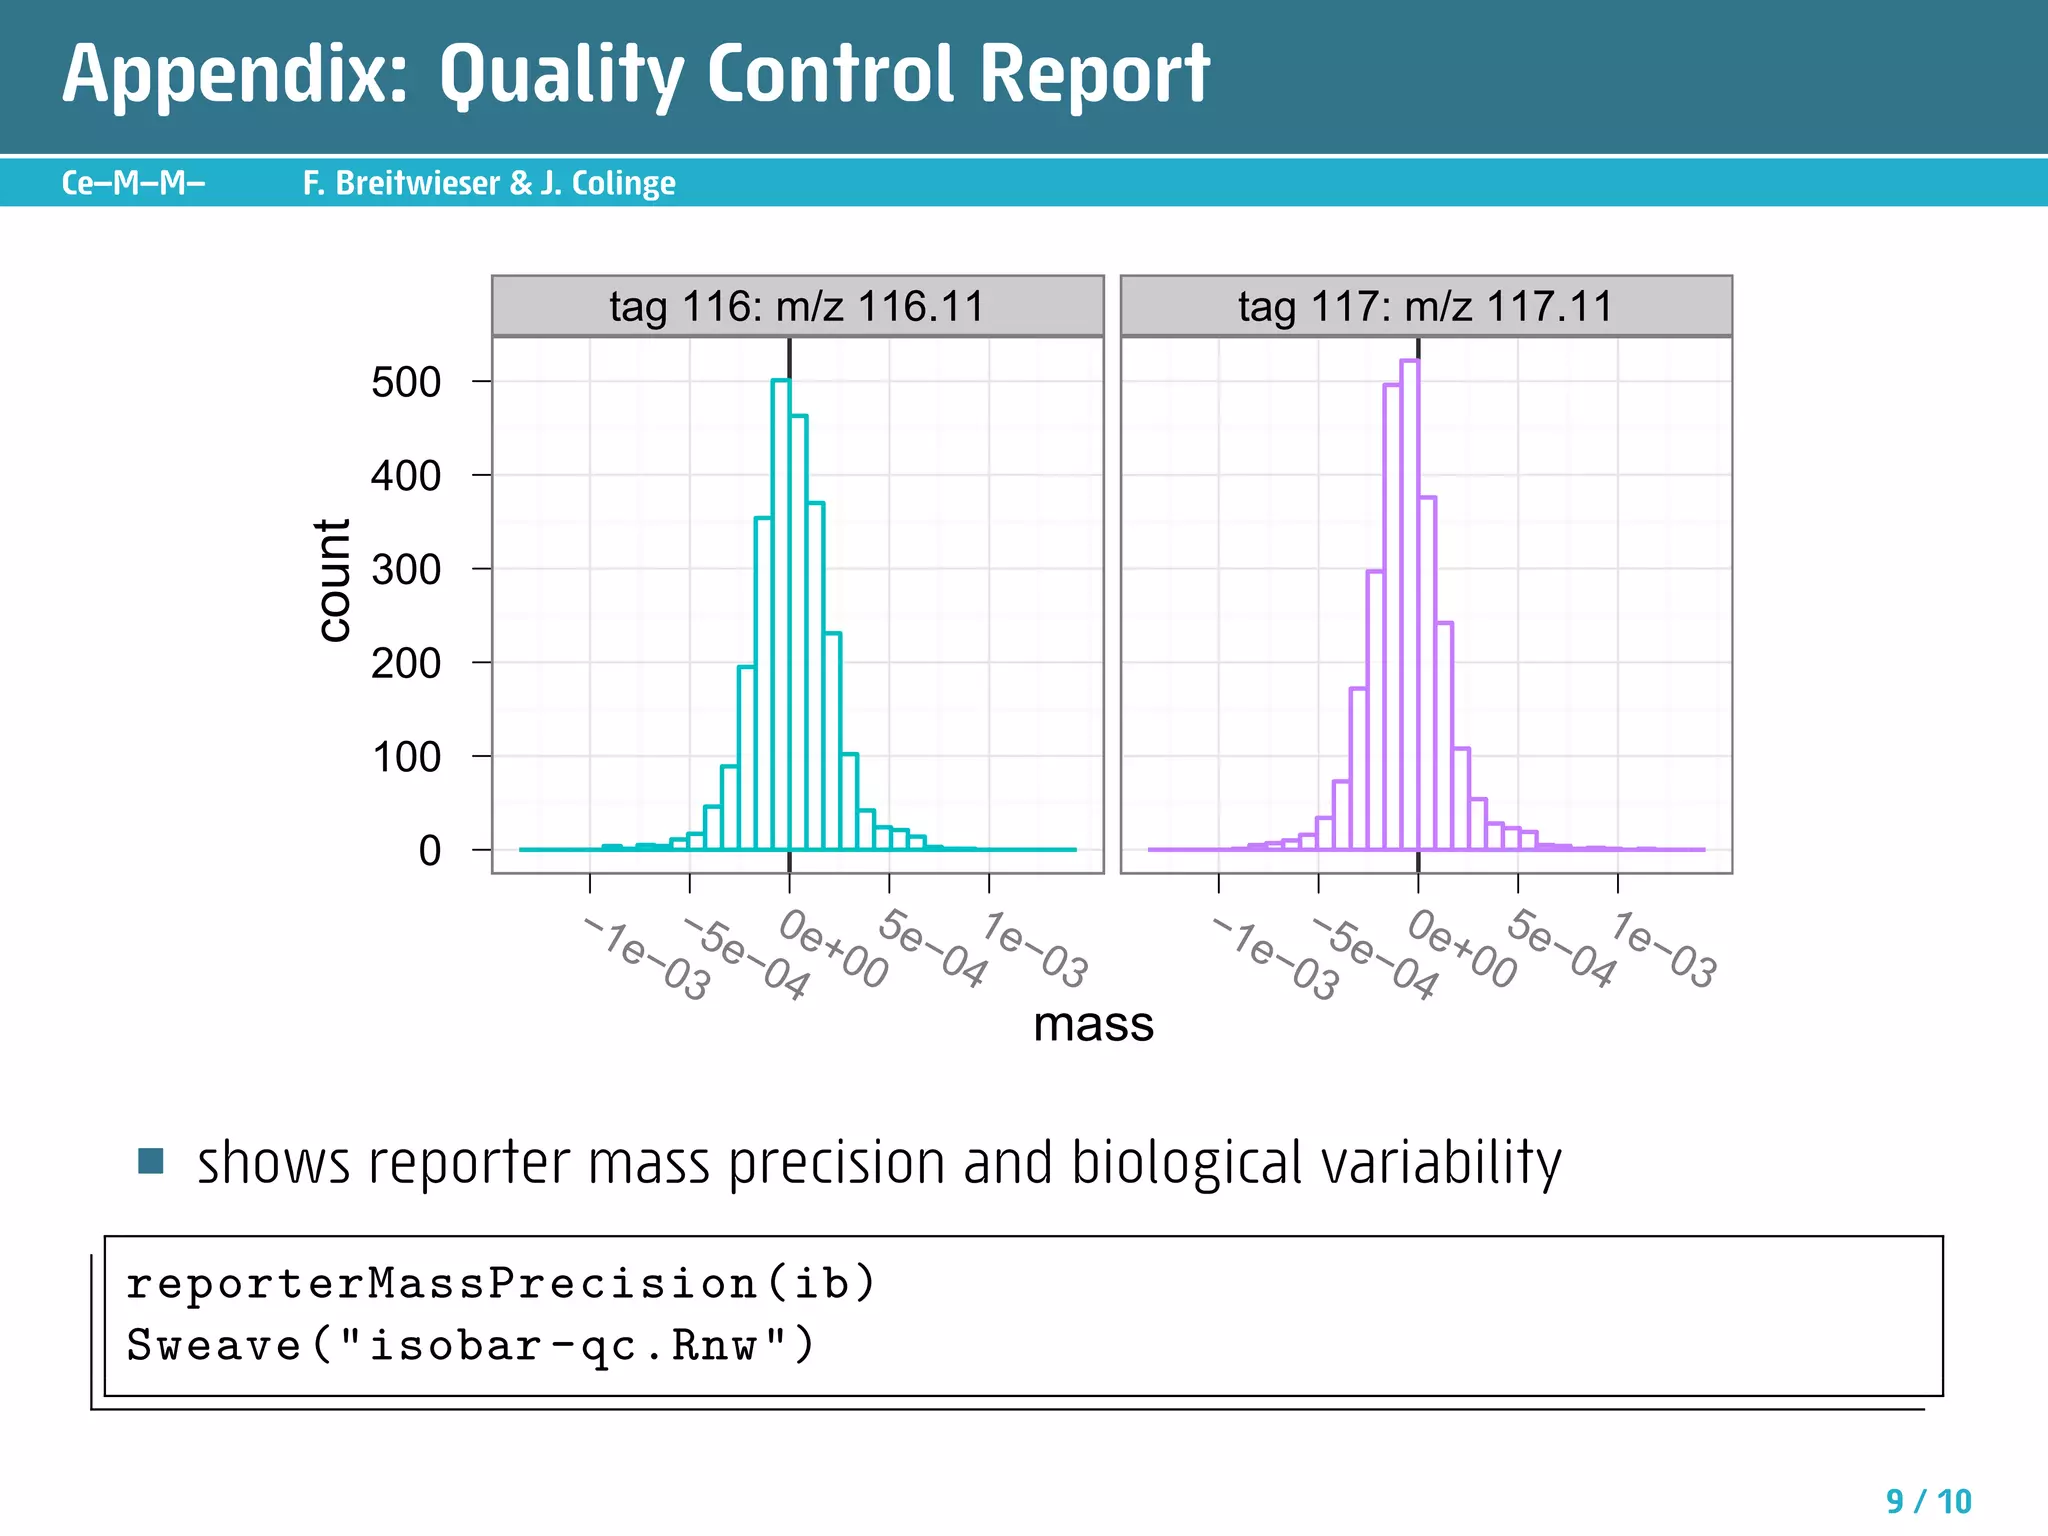

The document describes an R package called isobar that provides tools for analyzing quantitative proteomics data from isobaric labeling experiments. The package extracts identification and quantitative information from mass spectrometry data. It models technical variability, normalizes data, and handles biological variability to determine differential protein expression accurately. Statistical tests and data visualization help decide significant regulation. Automated reporting of results in PDF format via Sweave is demonstrated.


![Vibe Coding vs. Spec-Driven Development [Free Meetup]](https://cdn.slidesharecdn.com/ss_thumbnails/vibecodingvsspecdrivendevelopment-251209105622-43f455e7-thumbnail.jpg?width=640&height=640&fit=bounds)


![Coded Agents – with UiPath SDK + LangGraph [Virtual Hands-on Workshop]](https://cdn.slidesharecdn.com/ss_thumbnails/codedagentsdeck-251215155422-5497c599-thumbnail.jpg?width=640&height=640&fit=bounds)


