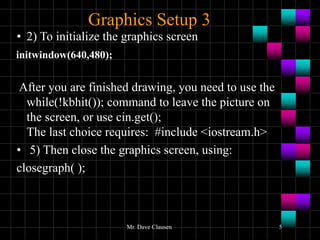
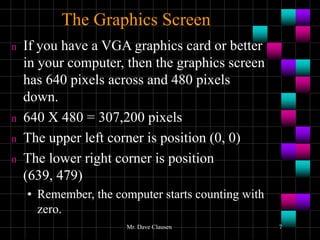
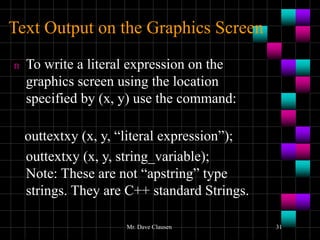
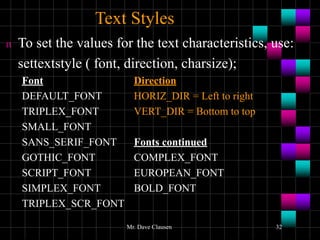
This document provides an overview of graphics programming in Borland C++. It discusses initializing the graphics screen, setting colors and line styles, drawing basic shapes like lines, rectangles, circles and arcs, filling regions, adding text, and clearing the screen. The key steps outlined are initializing the graphics mode, selecting colors and styles, using functions like line(), rectangle(), circle() to draw shapes, floodfill() to fill regions, and closegraph() to close the graphics screen.
This document provides an introduction to graphics programming in C. It discusses setting up graphics using GCC, basic concepts of graphics programming in C, common graphics functions like line(), circle(), rectangle(), and text functions like outtext() and outtextxy(). It also includes a short example program to demonstrate drawing various shapes and text.
This document is a lecture on advanced MATLAB methods. It discusses probability and statistics, data structures like cells and structs, images and animation, debugging techniques, and online resources. Specific topics covered include random number generation, histograms, cells vs matrices, initializing and accessing structs, figure handles, reading/writing images, creating animations, using the debugger, and the MATLAB File Exchange website.
The document discusses computer graphics concepts including pixels, colors, shapes, text, and programming. It covers:
1) Pixels are the smallest controllable elements that make up a digital image. Each pixel has a location and color value.
2) Colors are used for backgrounds and foregrounds. There are predefined color codes for text and graphics.
3) Basic shapes include lines, rectangles, circles, ellipses, polygons, and pie slices. Functions like line(), rectangle(), and circle() are used to draw shapes.
4) Text functions allow setting font, size, color, and position in graphics mode. Outtext() displays text.
5) Example programs demonstrate drawing shapes and text
This document provides an overview of graphics functions in R for creating plots and customizing plot elements. It discusses how to start a new plot, set axis scales and limits, draw axes, add titles and labels, and draw different types of graphical elements like points, lines, and shapes. Functions covered include plot.new(), plot.window(), axis(), title(), points(), lines(), abline(), segments(), and box(). The document uses examples to demonstrate how to construct basic and customized plots programmatically in R.
The document discusses the HTML5 <canvas> element and 2D Canvas API. It provides details on:
- Creating a canvas element with an id, width, and height
- Getting a 2D drawing context object
- Common drawing methods like lineTo(), arc(), fillText(), strokeRect(), and clearRect()
- Setting properties like fillStyle, strokeStyle, and globalCompositeOperation
- Drawing shapes, images, and text
- Applying transformations with methods like translate(), rotate(), and save()/restore()
- Using requestAnimationFrame() for basic animation
The document provides an overview of the canvas element and its capabilities for 2D drawing and basic animation using JavaScript.
This document discusses equation numbering and referencing in Microsoft Word using MathType. It provides instructions on:
- Inserting equation numbers in various formats using the equation numbering commands. The numbers and references will automatically update when new equations are added.
- Equation references can be placed in footnotes and endnotes.
- Equation numbers are separate from the equations and will not be deleted if the equation is removed. References link to the number, not the equation itself.
The document discusses various methods for creating graphics and animation in .NET applications, including using the Graphics object to draw shapes, lines and filled areas; creating simple animation by changing or moving images over time; using the Timer component to automate animation; and incorporating drag-and-drop functionality.
This document provides an introduction to programming concepts in Processing. It discusses basic concepts like what an image is composed of as a grid of intensity values. It explains the Processing coordinate system and how to specify simple shapes using points, lines, rectangles, and ellipses. It also covers color, including grayscale, RGB, and transparency. The document discusses installing the Processing development environment and describes its basic interface components. It provides examples of writing simple Processing programs and using methods like setup() and draw(). Overall, the document serves as a tutorial for beginners to learn basic 2D graphics and programming concepts in the Processing language.
This document contains a list of printer control codes and commands for Epson printers. It describes codes for selecting font styles like bold, italics and font sizes. It also includes codes for positioning and formatting text, setting page layout, selecting character sets and printing graphics. The codes allow controlling many aspects of printing from line spacing to margins to font selection.
This document provides a reference card for commands and settings in GrADS (Grid Analysis and Display System) version 1.7. It lists GrADS program executables, command line options, general settings, dimension environments, page control, graphic types, default colors and styles, and commands for graphics, axes, maps, strings, buttons, double buffering and animation.
The document provides an introduction to Processing, an open-source programming language and environment used for creating visuals and animations. It covers downloading and installing Processing, using the Processing Development Environment, setting the canvas size and coordinates, drawing basic shapes using code, adding color, using variables, loops and conditionals to create animations, and provides examples and resources for learning more.
This document provides instructions and examples for using various graphics functions in C++. It explains how to:
1. Initialize graphics mode and detect available graphics drivers.
2. Draw basic shapes like lines, circles, arcs, rectangles, and bars by specifying their coordinates and attributes.
3. Set properties like color, fill style, and line style.
4. Include additional functions like floodfill, moveto, outtext, and putpixel to manipulate graphics output.
5. Close the graphics mode and return to the default screen using the graphdefault and closegraph functions.
Javascript Art for Kids - Library ProgramRino Landa
An introduction to coding by using javascript to make art. The class is designed with tweens and teens, but kids as young as six can also participate with guidance. The class takes you step-by-step in using JavaScript to "draw" a house.This class is based on a Khan Academy lesson.
The document describes two methods for real-time finger detection from video captured by a laptop camera. The first method uses background subtraction and HSV segmentation to create a mask of the hand region. The second method then finds the largest contour within the mask, representing the hand shape. It calculates the hand's convex hull and convexity defects, which likely indicate spaces between fingers, to manually count the number of fingers. Alternatively, a convolutional neural network can be trained to determine the finger count directly from the masked input.
This document provides information about using graphics in Java, including:
- The DrawingPanel, Graphics, and Color objects used for drawing
- Common Graphics methods like drawLine, fillOval, setColor
- Coordinate system and drawing shapes at different positions
- Using loops and parameters to draw multiple shapes
- Creating simple animations using the DrawingPanel sleep method
This lab manual covers basic drawing in Processing by introducing functions to control size, position, color, and shape properties. It begins by explaining how to set the window size and draw points and basic shapes using functions like size(), point(), line(), rect(), ellipse(), and arc(). Parameters for these functions determine properties like position, width, height, and angles. The order of drawing shapes impacts which appear on top. Additional functions like background(), fill(), stroke(), strokeWeight(), and smooth() control background color, shape colors, line thickness, and smoothing. Values range from 0-255 to specify colors by red, green, and blue components.
This document discusses ratios, proportions, and their applications. It begins with examples of writing and using ratios to compare numbers. It then explains that a proportion is an equation stating that two ratios are equal, and introduces the cross products property for solving proportions. Several examples demonstrate solving proportions and using them to solve real-world problems involving scale drawings.
This document provides an overview of mathematical techniques for image processing. It discusses grayscale and color images, and how they can be represented as matrices. Methods for analyzing image data statistically, such as histograms and measures of center and spread, are presented. Working with images in MATLAB is demonstrated, including functions for reading, displaying, and extracting color channels of images. Different color models like RGB and YCbCr are described.
The document discusses HTML canvas and how to draw graphics on a canvas using JavaScript. It covers how to create a canvas element, get the rendering context, and use various drawing methods like fillRect(), strokeRect(), beginPath(), moveTo(), lineTo(), bezierCurveTo(), quadraticCurveTo() etc. to draw shapes, paths, images and text. It also discusses how to apply colors, gradients, patterns and shadows. The canvas state can be saved and restored using save() and restore() methods. Translations and rotations can be applied using translate() and rotate() methods.
This document discusses algorithms for rasterization and scan conversion in computer graphics. It covers:
1. Rasterization algorithms like DDA and Bresenham's line algorithm for determining which pixels are inside a primitive defined by vertices.
2. Scan conversion of line segments using DDA and Bresenham's algorithm. DDA uses floating point addition while Bresenham uses only integer operations.
3. Polygon filling algorithms like the odd-even rule and winding number to determine if a point is inside or outside a polygon. Shading is determined by interpolating colors across spans.
The document provides an overview of AutoCAD and its uses for fashion design. It discusses how CAD saves designers time in the design process and gives them more flexibility. It provides step-by-step instructions on how to open and use AutoCAD, including how to draw different shapes and modify objects. Dimensioning, layers, and importing images are also covered. The document is intended to teach the basics of using AutoCAD for fashion design applications.
This document provides an introduction to Mathematica and its capabilities. It describes how to start Mathematica in both notebook and text-based interfaces on different platforms. It then covers basic numerical calculations, functions, equations, programming constructs, graphics, data visualization, and high performance computing in Mathematica including vectorization, GPU programming, and using CUDALink.
This document discusses various problems that can be solved using backtracking, including graph coloring, the Hamiltonian cycle problem, the subset sum problem, the n-queen problem, and map coloring. It provides examples of how backtracking works by constructing partial solutions and evaluating them to find valid solutions or determine dead ends. Key terms like state-space trees and promising vs non-promising states are introduced. Specific examples are given for problems like placing 4 queens on a chessboard and coloring a map of Australia.
This document discusses graphics programming in Java. It describes the setColor() method, which sets the drawing color using constants like Color.red and Color.blue. Images are drawn in the current color until it is changed. Examples are given to draw a string in blue and a line in orange. The drawLine() method is explained, taking integer parameters for the start and end points. Similarly, drawRect() takes integers for the x, y coordinates, width, and height to draw a rectangle.
This document provides an overview of plotting and image processing capabilities in Matlab. It discusses how to generate basic scatter plots and customize axis properties. It also explains how digital images are constructed as arrays and can be displayed, rotated, and converted to grayscale using commands like plot, surf, image, and imagesc. The document demonstrates plotting multiple lines and images on the same figure. It describes how image processing techniques like Sobel filtering can be used to detect edges in an image.
The document provides five rules for presenting code in slides: 1) Use a monospaced font for readability, 2) Use large fonts that are visible from the back of the room, 3) Only highlight syntax where needed to avoid walls of text, 4) Use ellipses (...) to remove unnecessary code, and 5) Add annotations to draw attention to specific parts of the code. It then demonstrates these rules by presenting an example of using promises in JavaScript to avoid nested callbacks.
This document provides information about using colors in digital design. It discusses the two main color profiles - RGB for screens and CMYK for print. CMYK colors are created using cyan, magenta, yellow and black inks, with values from 0-100 representing the amount of each color. The document demonstrates how to create custom colors in CMYK or RGB, save them as swatches, and find color codes. Tips are provided on darkening or lightening colors and creating new hues by mixing color values.
Minesweeper is a single-player video game.
The objective of the game is to clear an abstract minefield without detonating a mine.
The player is initially presented with a grid of undistinguished squares. Some randomly selected squares, unknown to the player, are designated to contain mines.
What is Master Data Management by PiLog Groupaymanquadri279
PiLog Group's Master Data Record Manager (MDRM) is a sophisticated enterprise solution designed to ensure data accuracy, consistency, and governance across various business functions. MDRM integrates advanced data management technologies to cleanse, classify, and standardize master data, thereby enhancing data quality and operational efficiency.
This document contains a list of printer control codes and commands for Epson printers. It describes codes for selecting font styles like bold, italics and font sizes. It also includes codes for positioning and formatting text, setting page layout, selecting character sets and printing graphics. The codes allow controlling many aspects of printing from line spacing to margins to font selection.
This document provides a reference card for commands and settings in GrADS (Grid Analysis and Display System) version 1.7. It lists GrADS program executables, command line options, general settings, dimension environments, page control, graphic types, default colors and styles, and commands for graphics, axes, maps, strings, buttons, double buffering and animation.
The document provides an introduction to Processing, an open-source programming language and environment used for creating visuals and animations. It covers downloading and installing Processing, using the Processing Development Environment, setting the canvas size and coordinates, drawing basic shapes using code, adding color, using variables, loops and conditionals to create animations, and provides examples and resources for learning more.
This document provides instructions and examples for using various graphics functions in C++. It explains how to:
1. Initialize graphics mode and detect available graphics drivers.
2. Draw basic shapes like lines, circles, arcs, rectangles, and bars by specifying their coordinates and attributes.
3. Set properties like color, fill style, and line style.
4. Include additional functions like floodfill, moveto, outtext, and putpixel to manipulate graphics output.
5. Close the graphics mode and return to the default screen using the graphdefault and closegraph functions.
Javascript Art for Kids - Library ProgramRino Landa
An introduction to coding by using javascript to make art. The class is designed with tweens and teens, but kids as young as six can also participate with guidance. The class takes you step-by-step in using JavaScript to "draw" a house.This class is based on a Khan Academy lesson.
The document describes two methods for real-time finger detection from video captured by a laptop camera. The first method uses background subtraction and HSV segmentation to create a mask of the hand region. The second method then finds the largest contour within the mask, representing the hand shape. It calculates the hand's convex hull and convexity defects, which likely indicate spaces between fingers, to manually count the number of fingers. Alternatively, a convolutional neural network can be trained to determine the finger count directly from the masked input.
This document provides information about using graphics in Java, including:
- The DrawingPanel, Graphics, and Color objects used for drawing
- Common Graphics methods like drawLine, fillOval, setColor
- Coordinate system and drawing shapes at different positions
- Using loops and parameters to draw multiple shapes
- Creating simple animations using the DrawingPanel sleep method
This lab manual covers basic drawing in Processing by introducing functions to control size, position, color, and shape properties. It begins by explaining how to set the window size and draw points and basic shapes using functions like size(), point(), line(), rect(), ellipse(), and arc(). Parameters for these functions determine properties like position, width, height, and angles. The order of drawing shapes impacts which appear on top. Additional functions like background(), fill(), stroke(), strokeWeight(), and smooth() control background color, shape colors, line thickness, and smoothing. Values range from 0-255 to specify colors by red, green, and blue components.
This document discusses ratios, proportions, and their applications. It begins with examples of writing and using ratios to compare numbers. It then explains that a proportion is an equation stating that two ratios are equal, and introduces the cross products property for solving proportions. Several examples demonstrate solving proportions and using them to solve real-world problems involving scale drawings.
This document provides an overview of mathematical techniques for image processing. It discusses grayscale and color images, and how they can be represented as matrices. Methods for analyzing image data statistically, such as histograms and measures of center and spread, are presented. Working with images in MATLAB is demonstrated, including functions for reading, displaying, and extracting color channels of images. Different color models like RGB and YCbCr are described.
The document discusses HTML canvas and how to draw graphics on a canvas using JavaScript. It covers how to create a canvas element, get the rendering context, and use various drawing methods like fillRect(), strokeRect(), beginPath(), moveTo(), lineTo(), bezierCurveTo(), quadraticCurveTo() etc. to draw shapes, paths, images and text. It also discusses how to apply colors, gradients, patterns and shadows. The canvas state can be saved and restored using save() and restore() methods. Translations and rotations can be applied using translate() and rotate() methods.
This document discusses algorithms for rasterization and scan conversion in computer graphics. It covers:
1. Rasterization algorithms like DDA and Bresenham's line algorithm for determining which pixels are inside a primitive defined by vertices.
2. Scan conversion of line segments using DDA and Bresenham's algorithm. DDA uses floating point addition while Bresenham uses only integer operations.
3. Polygon filling algorithms like the odd-even rule and winding number to determine if a point is inside or outside a polygon. Shading is determined by interpolating colors across spans.
The document provides an overview of AutoCAD and its uses for fashion design. It discusses how CAD saves designers time in the design process and gives them more flexibility. It provides step-by-step instructions on how to open and use AutoCAD, including how to draw different shapes and modify objects. Dimensioning, layers, and importing images are also covered. The document is intended to teach the basics of using AutoCAD for fashion design applications.
This document provides an introduction to Mathematica and its capabilities. It describes how to start Mathematica in both notebook and text-based interfaces on different platforms. It then covers basic numerical calculations, functions, equations, programming constructs, graphics, data visualization, and high performance computing in Mathematica including vectorization, GPU programming, and using CUDALink.
This document discusses various problems that can be solved using backtracking, including graph coloring, the Hamiltonian cycle problem, the subset sum problem, the n-queen problem, and map coloring. It provides examples of how backtracking works by constructing partial solutions and evaluating them to find valid solutions or determine dead ends. Key terms like state-space trees and promising vs non-promising states are introduced. Specific examples are given for problems like placing 4 queens on a chessboard and coloring a map of Australia.
This document discusses graphics programming in Java. It describes the setColor() method, which sets the drawing color using constants like Color.red and Color.blue. Images are drawn in the current color until it is changed. Examples are given to draw a string in blue and a line in orange. The drawLine() method is explained, taking integer parameters for the start and end points. Similarly, drawRect() takes integers for the x, y coordinates, width, and height to draw a rectangle.
This document provides an overview of plotting and image processing capabilities in Matlab. It discusses how to generate basic scatter plots and customize axis properties. It also explains how digital images are constructed as arrays and can be displayed, rotated, and converted to grayscale using commands like plot, surf, image, and imagesc. The document demonstrates plotting multiple lines and images on the same figure. It describes how image processing techniques like Sobel filtering can be used to detect edges in an image.
The document provides five rules for presenting code in slides: 1) Use a monospaced font for readability, 2) Use large fonts that are visible from the back of the room, 3) Only highlight syntax where needed to avoid walls of text, 4) Use ellipses (...) to remove unnecessary code, and 5) Add annotations to draw attention to specific parts of the code. It then demonstrates these rules by presenting an example of using promises in JavaScript to avoid nested callbacks.
This document provides information about using colors in digital design. It discusses the two main color profiles - RGB for screens and CMYK for print. CMYK colors are created using cyan, magenta, yellow and black inks, with values from 0-100 representing the amount of each color. The document demonstrates how to create custom colors in CMYK or RGB, save them as swatches, and find color codes. Tips are provided on darkening or lightening colors and creating new hues by mixing color values.
Minesweeper is a single-player video game.
The objective of the game is to clear an abstract minefield without detonating a mine.
The player is initially presented with a grid of undistinguished squares. Some randomly selected squares, unknown to the player, are designated to contain mines.
Similar to borland-style-graphics-for-dev-c.pdf (20)
What is Master Data Management by PiLog Groupaymanquadri279
PiLog Group's Master Data Record Manager (MDRM) is a sophisticated enterprise solution designed to ensure data accuracy, consistency, and governance across various business functions. MDRM integrates advanced data management technologies to cleanse, classify, and standardize master data, thereby enhancing data quality and operational efficiency.
Graspan: A Big Data System for Big Code AnalysisAftab Hussain
We built a disk-based parallel graph system, Graspan, that uses a novel edge-pair centric computation model to compute dynamic transitive closures on very large program graphs.
We implement context-sensitive pointer/alias and dataflow analyses on Graspan. An evaluation of these analyses on large codebases such as Linux shows that their Graspan implementations scale to millions of lines of code and are much simpler than their original implementations.
These analyses were used to augment the existing checkers; these augmented checkers found 132 new NULL pointer bugs and 1308 unnecessary NULL tests in Linux 4.4.0-rc5, PostgreSQL 8.3.9, and Apache httpd 2.2.18.
- Accepted in ASPLOS ‘17, Xi’an, China.
- Featured in the tutorial, Systemized Program Analyses: A Big Data Perspective on Static Analysis Scalability, ASPLOS ‘17.
- Invited for presentation at SoCal PLS ‘16.
- Invited for poster presentation at PLDI SRC ‘16.
Takashi Kobayashi and Hironori Washizaki, "SWEBOK Guide and Future of SE Education," First International Symposium on the Future of Software Engineering (FUSE), June 3-6, 2024, Okinawa, Japan
Microservice Teams - How the cloud changes the way we workSven Peters
A lot of technical challenges and complexity come with building a cloud-native and distributed architecture. The way we develop backend software has fundamentally changed in the last ten years. Managing a microservices architecture demands a lot of us to ensure observability and operational resiliency. But did you also change the way you run your development teams?
Sven will talk about Atlassian’s journey from a monolith to a multi-tenanted architecture and how it affected the way the engineering teams work. You will learn how we shifted to service ownership, moved to more autonomous teams (and its challenges), and established platform and enablement teams.
Software Engineering, Software Consulting, Tech Lead, Spring Boot, Spring Cloud, Spring Core, Spring JDBC, Spring Transaction, Spring MVC, OpenShift Cloud Platform, Kafka, REST, SOAP, LLD & HLD.
Do you want Software for your Business? Visit Deuglo
Deuglo has top Software Developers in India. They are experts in software development and help design and create custom Software solutions.
Deuglo follows seven steps methods for delivering their services to their customers. They called it the Software development life cycle process (SDLC).
Requirement — Collecting the Requirements is the first Phase in the SSLC process.
Feasibility Study — after completing the requirement process they move to the design phase.
Design — in this phase, they start designing the software.
Coding — when designing is completed, the developers start coding for the software.
Testing — in this phase when the coding of the software is done the testing team will start testing.
Installation — after completion of testing, the application opens to the live server and launches!
Maintenance — after completing the software development, customers start using the software.
Introducing Crescat - Event Management Software for Venues, Festivals and Eve...Crescat
Crescat is industry-trusted event management software, built by event professionals for event professionals. Founded in 2017, we have three key products tailored for the live event industry.
Crescat Event for concert promoters and event agencies. Crescat Venue for music venues, conference centers, wedding venues, concert halls and more. And Crescat Festival for festivals, conferences and complex events.
With a wide range of popular features such as event scheduling, shift management, volunteer and crew coordination, artist booking and much more, Crescat is designed for customisation and ease-of-use.
Over 125,000 events have been planned in Crescat and with hundreds of customers of all shapes and sizes, from boutique event agencies through to international concert promoters, Crescat is rigged for success. What's more, we highly value feedback from our users and we are constantly improving our software with updates, new features and improvements.
If you plan events, run a venue or produce festivals and you're looking for ways to make your life easier, then we have a solution for you. Try our software for free or schedule a no-obligation demo with one of our product specialists today at crescat.io
Flutter is a popular open source, cross-platform framework developed by Google. In this webinar we'll explore Flutter and its architecture, delve into the Flutter Embedder and Flutter’s Dart language, discover how to leverage Flutter for embedded device development, learn about Automotive Grade Linux (AGL) and its consortium and understand the rationale behind AGL's choice of Flutter for next-gen IVI systems. Don’t miss this opportunity to discover whether Flutter is right for your project.
DDS Security Version 1.2 was adopted in 2024. This revision strengthens support for long runnings systems adding new cryptographic algorithms, certificate revocation, and hardness against DoS attacks.
Atelier - Innover avec l’IA Générative et les graphes de connaissancesNeo4j
Atelier - Innover avec l’IA Générative et les graphes de connaissances
Allez au-delà du battage médiatique autour de l’IA et découvrez des techniques pratiques pour utiliser l’IA de manière responsable à travers les données de votre organisation. Explorez comment utiliser les graphes de connaissances pour augmenter la précision, la transparence et la capacité d’explication dans les systèmes d’IA générative. Vous partirez avec une expérience pratique combinant les relations entre les données et les LLM pour apporter du contexte spécifique à votre domaine et améliorer votre raisonnement.
Amenez votre ordinateur portable et nous vous guiderons sur la mise en place de votre propre pile d’IA générative, en vous fournissant des exemples pratiques et codés pour démarrer en quelques minutes.
SOCRadar's Aviation Industry Q1 Incident Report is out now!
The aviation industry has always been a prime target for cybercriminals due to its critical infrastructure and high stakes. In the first quarter of 2024, the sector faced an alarming surge in cybersecurity threats, revealing its vulnerabilities and the relentless sophistication of cyber attackers.
SOCRadar’s Aviation Industry, Quarterly Incident Report, provides an in-depth analysis of these threats, detected and examined through our extensive monitoring of hacker forums, Telegram channels, and dark web platforms.
8 Best Automated Android App Testing Tool and Framework in 2024.pdfkalichargn70th171
Regarding mobile operating systems, two major players dominate our thoughts: Android and iPhone. With Android leading the market, software development companies are focused on delivering apps compatible with this OS. Ensuring an app's functionality across various Android devices, OS versions, and hardware specifications is critical, making Android app testing essential.
Hand Rolled Applicative User ValidationCode KataPhilip Schwarz
Could you use a simple piece of Scala validation code (granted, a very simplistic one too!) that you can rewrite, now and again, to refresh your basic understanding of Applicative operators <*>, <*, *>?
The goal is not to write perfect code showcasing validation, but rather, to provide a small, rough-and ready exercise to reinforce your muscle-memory.
Despite its grandiose-sounding title, this deck consists of just three slides showing the Scala 3 code to be rewritten whenever the details of the operators begin to fade away.
The code is my rough and ready translation of a Haskell user-validation program found in a book called Finding Success (and Failure) in Haskell - Fall in love with applicative functors.
AI Fusion Buddy Review: Brand New, Groundbreaking Gemini-Powered AI AppGoogle
AI Fusion Buddy Review: Brand New, Groundbreaking Gemini-Powered AI App
👉👉 Click Here To Get More Info 👇👇
https://sumonreview.com/ai-fusion-buddy-review
AI Fusion Buddy Review: Key Features
✅Create Stunning AI App Suite Fully Powered By Google's Latest AI technology, Gemini
✅Use Gemini to Build high-converting Converting Sales Video Scripts, ad copies, Trending Articles, blogs, etc.100% unique!
✅Create Ultra-HD graphics with a single keyword or phrase that commands 10x eyeballs!
✅Fully automated AI articles bulk generation!
✅Auto-post or schedule stunning AI content across all your accounts at once—WordPress, Facebook, LinkedIn, Blogger, and more.
✅With one keyword or URL, generate complete websites, landing pages, and more…
✅Automatically create & sell AI content, graphics, websites, landing pages, & all that gets you paid non-stop 24*7.
✅Pre-built High-Converting 100+ website Templates and 2000+ graphic templates logos, banners, and thumbnail images in Trending Niches.
✅Say goodbye to wasting time logging into multiple Chat GPT & AI Apps once & for all!
✅Save over $5000 per year and kick out dependency on third parties completely!
✅Brand New App: Not available anywhere else!
✅ Beginner-friendly!
✅ZERO upfront cost or any extra expenses
✅Risk-Free: 30-Day Money-Back Guarantee!
✅Commercial License included!
See My Other Reviews Article:
(1) AI Genie Review: https://sumonreview.com/ai-genie-review
(2) SocioWave Review: https://sumonreview.com/sociowave-review
(3) AI Partner & Profit Review: https://sumonreview.com/ai-partner-profit-review
(4) AI Ebook Suite Review: https://sumonreview.com/ai-ebook-suite-review
#AIFusionBuddyReview,
#AIFusionBuddyFeatures,
#AIFusionBuddyPricing,
#AIFusionBuddyProsandCons,
#AIFusionBuddyTutorial,
#AIFusionBuddyUserExperience
#AIFusionBuddyforBeginners,
#AIFusionBuddyBenefits,
#AIFusionBuddyComparison,
#AIFusionBuddyInstallation,
#AIFusionBuddyRefundPolicy,
#AIFusionBuddyDemo,
#AIFusionBuddyMaintenanceFees,
#AIFusionBuddyNewbieFriendly,
#WhatIsAIFusionBuddy?,
#HowDoesAIFusionBuddyWorks
What is Augmented Reality Image Trackingpavan998932
Augmented Reality (AR) Image Tracking is a technology that enables AR applications to recognize and track images in the real world, overlaying digital content onto them. This enhances the user's interaction with their environment by providing additional information and interactive elements directly tied to physical images.
2. Mr. Dave Clausen 2
The Text Screen
n The text screen contains 25 lines with a
capacity of holding 80 columns of textual
characters.
n 80 X 25 = 2,000 positions
n But there are actually over 2,000 positions on
a display screen.
n The screen consists of pixels (picture
elements) that it uses to represent the textual
characters and symbols.
3. Mr. Dave Clausen 3
Graphics Setup
n Here are the steps that you need to follow
to use “Borland Style Graphics” source
code in Dev C++:
1. Tell the compiler that graphics commands
will be used.
2. Initialize the Graphics Screen
3. Close the graphics screen after you have
finished drawing your graphics.
4. Mr. Dave Clausen 4
Graphics Setup 2
n 1) To tell the compiler that graphics
commands will be used, include the
preprocessor directive:
#include <graphics.h>
5. Mr. Dave Clausen 5
Graphics Setup 3
• 2) To initialize the graphics screen
initwindow(640,480);
After you are finished drawing, you need to use the
while(!kbhit()); command to leave the picture on
the screen, or use cin.get();
The last choice requires: #include <iostream.h>
• 5) Then close the graphics screen, using:
closegraph( );
6. Mr. Dave Clausen 6
Fundamentals
of
Graphics
n The Graphics Screen.
n Color Options.
n Graphics Mode.
n Drawing Lines
n Line Style
n Clearing the Screen.
n Plotting Points.
7. Mr. Dave Clausen 7
n If you have a VGA graphics card or better
in your computer, then the graphics screen
has 640 pixels across and 480 pixels
down.
n 640 X 480 = 307,200 pixels
n The upper left corner is position (0, 0)
n The lower right corner is position
(639, 479)
• Remember, the computer starts counting with
zero.
The Graphics Screen
8. Mr. Dave Clausen 8
The Graphics Screen
Dimensions
(0, 0) (639, 0)
(0, 479) (639, 479)
9. Mr. Dave Clausen 9
§ You can select the color of the background.
§ This is done before drawing anything in the
foreground (otherwise your drawing will
disappear.)
§ To select the background color use the
command.
§ setbkcolor(number);
§ Where (number) is a numeric constant from 0
through 15, or the symbolic constant that represents
the color.
Background
Color Options
10. Mr. Dave Clausen 10
Color Options
n You select a foreground or “drawing” color by
using the following command:
setcolor(number);
• Where (number) is a numeric constant from 0
through 15, or the symbolic constant that
represents the color.
11. Mr. Dave Clausen 11
Color Names
Here are the color numbers and names:
0 = BLACK
1 = BLUE
2 = GREEN
3 = CYAN
4 = RED
5 = MAGENTA
6 = BROWN
7 = LIGHTGRAY
8 = DARKGRAY
9 = LIGHTBLUE
10 = LIGHTGREEN
11 = LIGHTCYAN
12 = LIGHTRED
13 = LIGHTMAGENTA
14 = YELLOW
15 = WHITE
12. Mr. Dave Clausen 12
Drawing Lines
§ The Current Pointer.
The current pointer is an invisible pointer
that keeps track of the current pixel
position. It is the equivalent of the visible
cursor in text mode.
13. Mr. Dave Clausen 13
§ To move the pointer to a location on the
graph without drawing anything, use the
command:
§ moveto (X,Y);
§ This is like PenUp (PU) in LOGO
§ To draw lines from the current pointer’s
position to another point on the graph, use
the command:
§ lineto (X,Y);
§ This is like PenDown (PD) in LOGO or SetXY (x, y)
grtmplte.cpp
Drawing Lines 2
14. Mr. Dave Clausen 14
Graphics Figures
•Lines
•Rectangles
•Circles
•Arcs
•Ellipses
•Points
15. Mr. Dave Clausen 15
Lines, The Easy Way
n Instead of using the commands: moveto
and lineto, we can draw a line using one
command:
line(x1, y1, x2, y2);
n The points (x1, y1) describe the beginning
of the line, while (x2, y2) describes the
endpoint of the line.
n The numbers x1, y1, x2, y2 are integers.
16. Mr. Dave Clausen 16
Rectangles
Rectangles can be drawn in different ways
using lineto, moveto, moverel, and linerel.
But an easier and faster way is using the
Rectangle procedure which draws a rectangle
in the default color and line style with the
upper left at X1, Y1 and lower right X2, Y2.
rectangle (x1, y1, x2, y2);
17. Mr. Dave Clausen 17
Circles
Circles can be drawn using the circle
procedure.
This draws a circle in the default color and
line style with center at X, Y, radius in the X
direction of Xradius, and corresponding Y
radius.
circle (x, y, radius);
18. Mr. Dave Clausen 18
Arcs
This procedure draws a circular arc in the
default color and line style based upon a circle
with center X, Y and given X radius.
The arc begins at an angle of StartAngle and
follows the circle to EndAngle. The angles are
measured in degrees from 0 to 360 counter-
clockwise where 0 degrees is directly right.
arc ( x, y, startangle, endangle, radius);
20. Mr. Dave Clausen 20
Ellipses
Draws an elliptical arc in the default color and
line style based upon an ellipse with center X,
Y and given radii.
The arc begins at an angle to Start Angle and
follows the ellipse to End Angle. The angles
are measured in degrees from 0 to 360 counter-
clockwise where 0 degrees is directly right.
ellipse ( x, y, startangle , endangle, x_radius, y_radius);
21. Mr. Dave Clausen 21
Plotting Points
§ The Maximum value for X can be
found using:
getmaxx( )
§ The Maximum value for Y can be found
using:
getmaxy( )
§ To Plot a point:
putpixel ( x_value, y_value, color);
For example: putpixel (100, 100, WHITE);
22. Mr. Dave Clausen 22
Sample Program
n Let’s look at a program with a line,
rectangle, circle, arc, ellipse, and a point.
Objects.cpp
23. Mr. Dave Clausen 23
Line Style
n Setting the line style.
All lines have a default line mode, but
Turbo C++ allows the user to specify three
characteristics of a line:
style, pattern, and thickness.
n Use the command:
setlinestyle (style, pattern, thickness);
24. Mr. Dave Clausen 24
Line Style
and
Thickness Names
Here are the names of the line styles and
thickness:
Line Style Thickness
SOLID_LINE NORM_WIDTH
DOTTED_LINE
CENTER_LINE THICK_WIDTH
DASHED_LINE
USERBIT_LINE
25. Mr. Dave Clausen 25
Line Style Patterns
n The names of the line patterns are:
SOLID_LINE = 0
DOTTED_LINE = 1
CENTER_LINE = 2
DASHED_LINE = 3
26. Mr. Dave Clausen 26
Filling Patterns
•Selecting Pattern and Color
•Filling Regions
•Getting a Pixel
27. Mr. Dave Clausen 27
Selecting Pattern
and Color
Use the command SetFillStyle for setting the
pattern and color for the object that you wish
to fill.
setfillstyle ( pattern, color);
28. Mr. Dave Clausen 28
Pattern Names
Here are the name of available patterns:
Values Causing filling with
EMPTY_FILL Background Color
SOLID_FILL Solid Color
LINE_FILL Horizontal Lines
LTSLASH_FILL Thin diagonal lines
SLASH_FILL Thick diagonal lines
BKSLASH_FILL Thick diagonal backslashes
LTBKSLASH_FILL Light backslashes
HATCH_FILLThin cross hatching
XHATCH_FILL Thick cross hatching
INTERLEAVE_FILL Interleaving lines
WIDE_DOT_FILL Widely spaced dots
CLOSE_DOT_FILL Closely spaced dots
29. Mr. Dave Clausen 29
Filling Regions
§After selecting a color and pattern,
floodfill is used to fill the desired area.
§floodfill ( x, y, border_color );
§This “paints out” the desired color until it
reaches border color.
§Note: The border color must be the same
color as the color used to draw the shape.
§Also, you can only fill completely
“closed” shapes.
Program10_4.cpp
30. Mr. Dave Clausen 30
§To draw a filled ellipse:
fillellipse ( xcoordinate, ycoordinate, xradius, yradius);
§ To draw a filled rectangle:
bar (x1, y1, x2, y2);
§To draw a filled 3D rectangle:
bar3d(x1, y1, x2, y2, depth, topflag); //depth is width of
the 3D rectangle, if topflag is non-0 a top is added to the bar
§ To draw a filled section of a circle:
pieslice (x, y, startangle, endangle, xradius);
Filling “Special” Regions
31. Mr. Dave Clausen 31
Text Output on the Graphics Screen
n To write a literal expression on the
graphics screen using the location
specified by (x, y) use the command:
outtextxy (x, y, “literal expression”);
outtextxy (x, y, string_variable);
Note: These are not “apstring” type
strings. They are C++ standard Strings.
32. Mr. Dave Clausen 32
n To set the values for the text characteristics, use:
settextstyle ( font, direction, charsize);
Font Direction
DEFAULT_FONT HORIZ_DIR = Left to right
TRIPLEX_FONT VERT_DIR = Bottom to top
SMALL_FONT
SANS_SERIF_FONT Fonts continued
GOTHIC_FONT COMPLEX_FONT
SCRIPT_FONT EUROPEAN_FONT
SIMPLEX_FONT BOLD_FONT
TRIPLEX_SCR_FONT
Text Styles
33. Mr. Dave Clausen 33
CharSize
1 = Default (normal)
2 = Double Size
3 = Triple Size
4 = 4 Times the normal
5 = 5 Times the normal
….
10 = 10 Times the normal
Text Styles
Font Sizes
34. Mr. Dave Clausen 34
n To set the way that text is located
around the point specified use the command:
settextjustify (horizontal,vertical);
Horizontal Vertical
LEFT_TEXT TOP_TEXT
CENTER_TEXT BOTTOM_TEXT
RIGHT_TEXT
Program10_2.cpp
Text Justification
35. Mr. Dave Clausen 35
Clearing the Screen
n Here is the way to clear the graphics
screen.
n When in graphics mode use:
cleardevice( ); //#include <graphics.h>
36. Mr. Dave Clausen 36
n Returns the height, in pixels, of string S if it
were to be written on the graphics screen
using the current defaults.
textheight (S string);
n Returns the width, in pixels, of string S if it
were to be written on the graphics screen
using the current defaults.
textwidth (S string);
Text
Height & Width
37. Mr. Dave Clausen 37
Getting a Pixel
n To return the color number corresponding to
the color located at the point: X, Y use the
command:
getpixel (x, y);
38. Mr. Dave Clausen 38
Useful Non Graphic Commands
n kbhit()
• checks to see if a keystroke is currently
available
• If a keystroke is available, returns a nonzero
integer.
• If a keystroke is not available, returns a zero.
n Any available keystrokes can be retrieved
with getch().