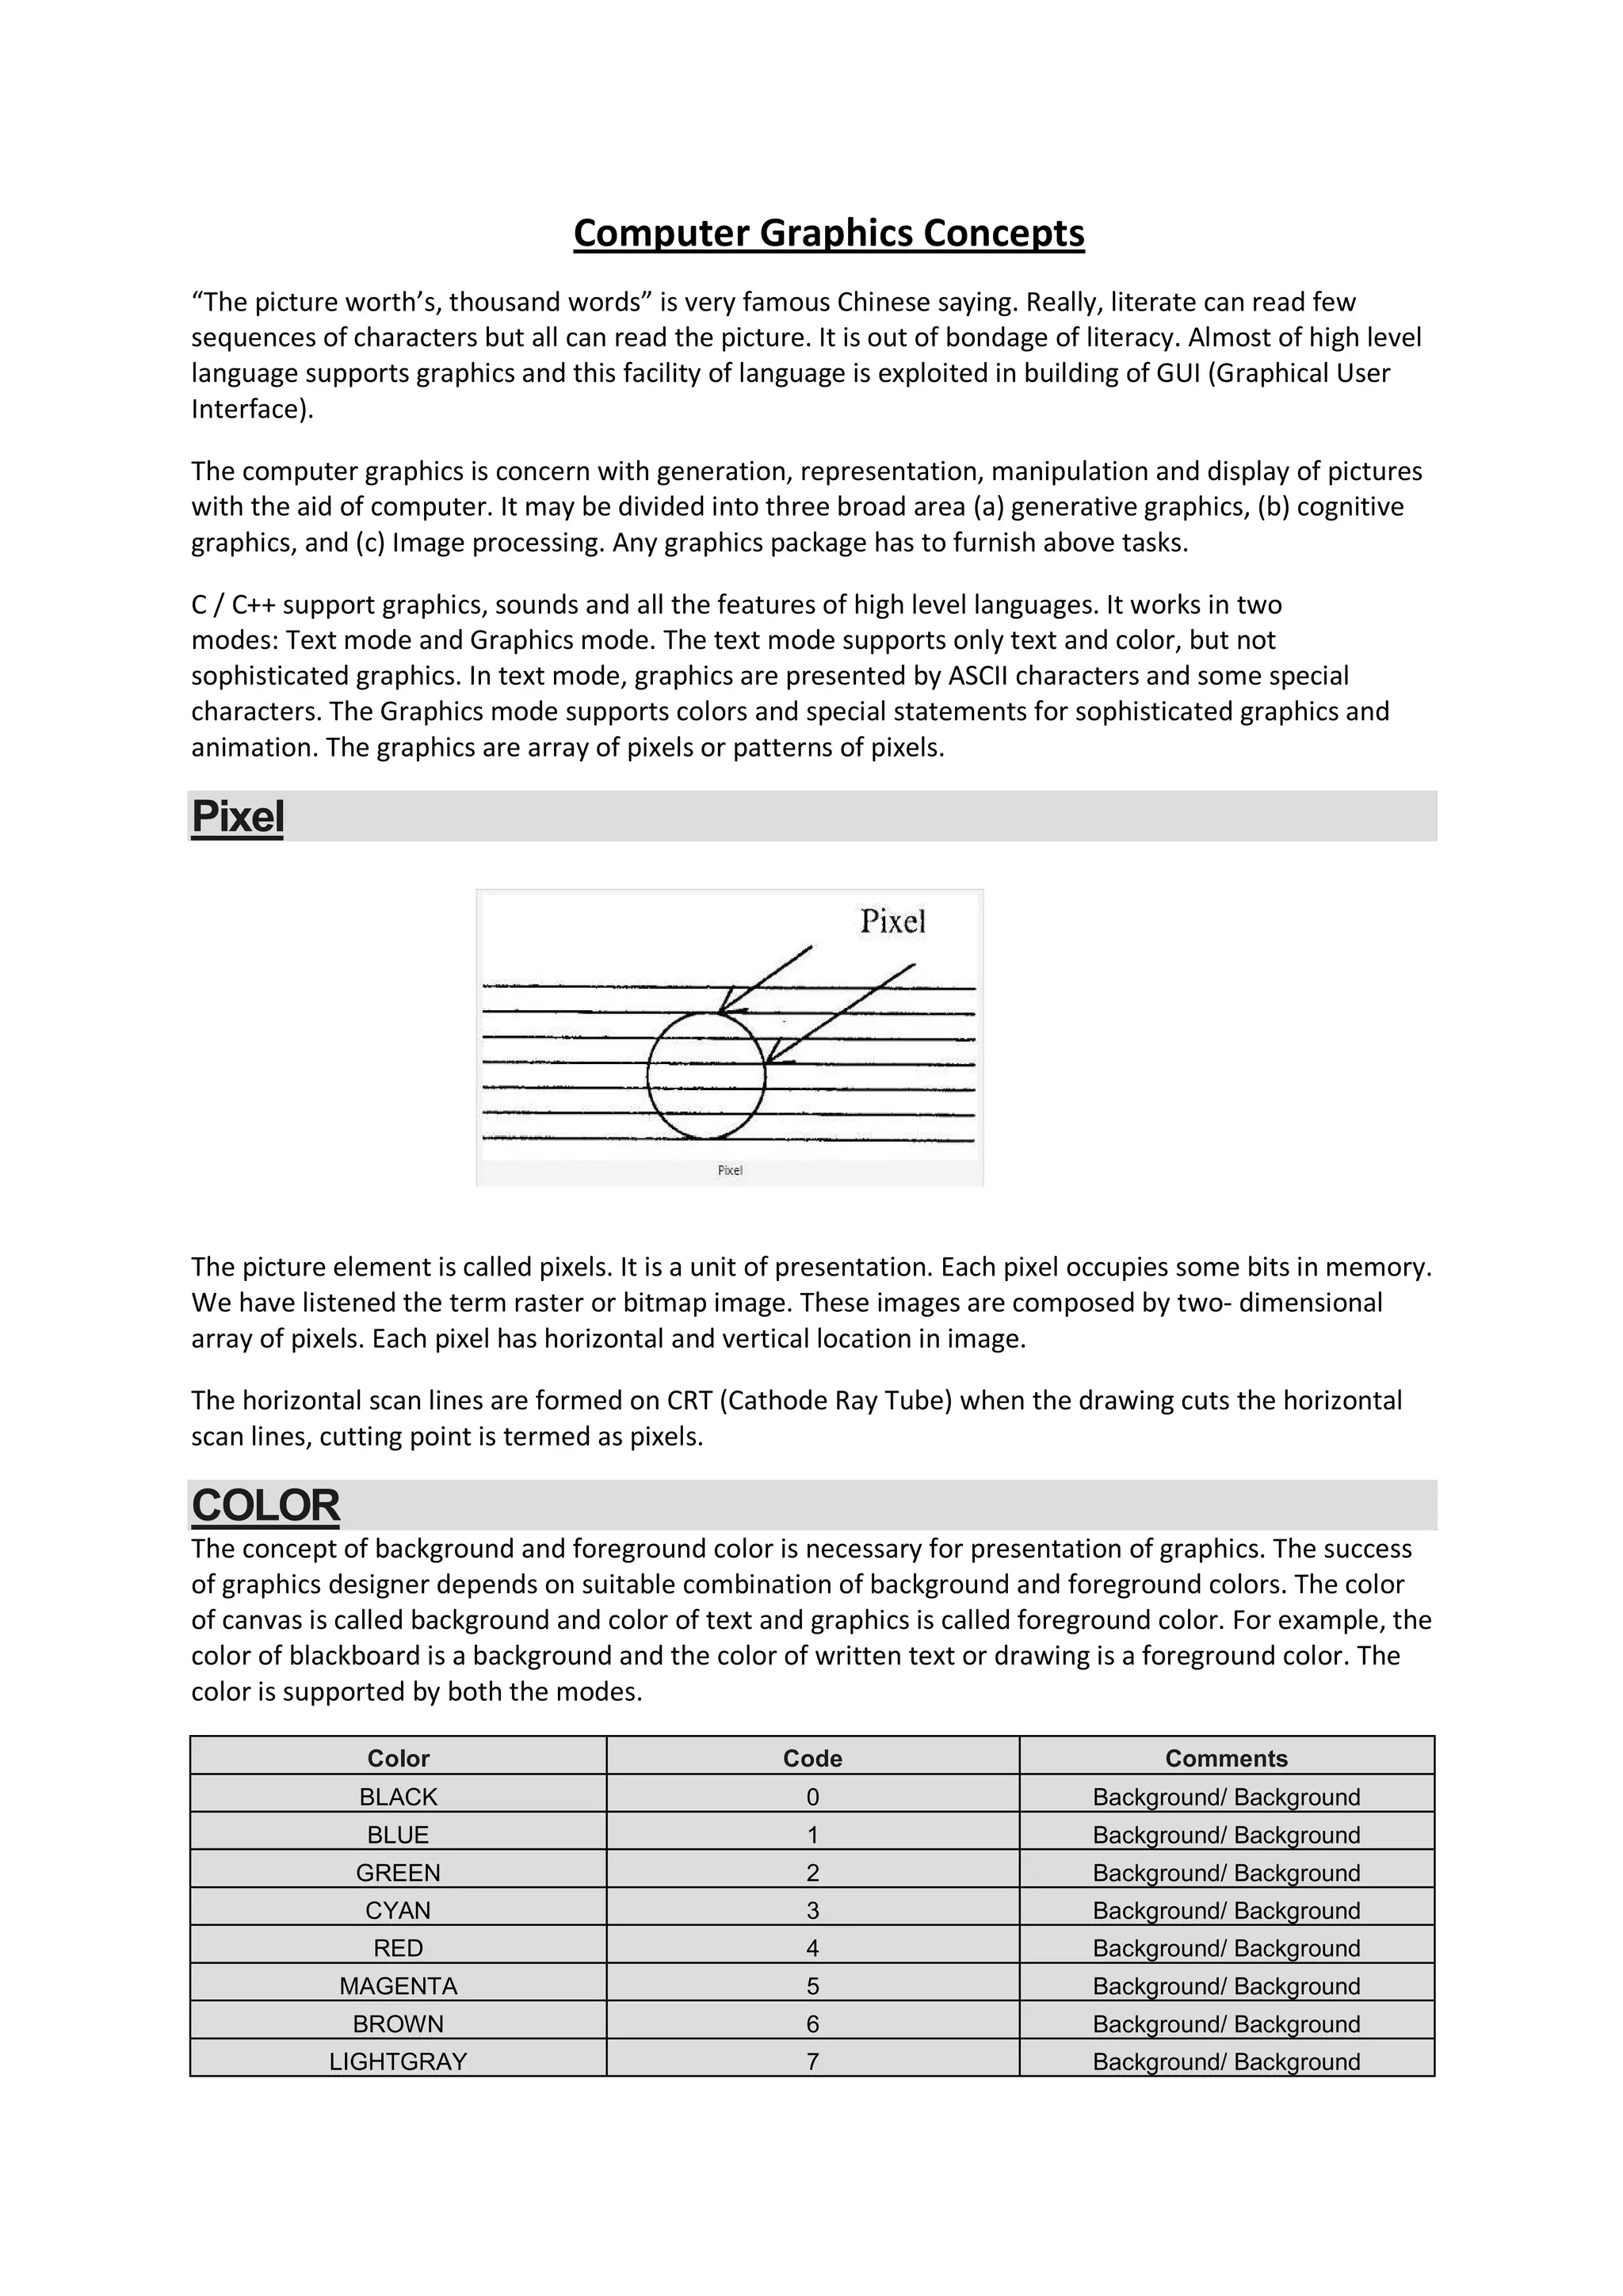
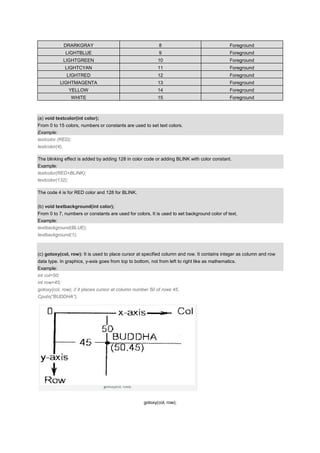
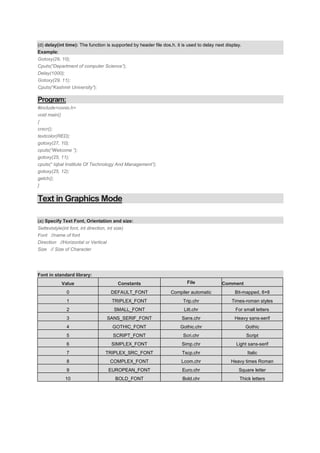
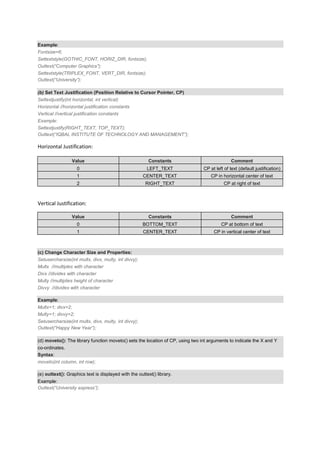
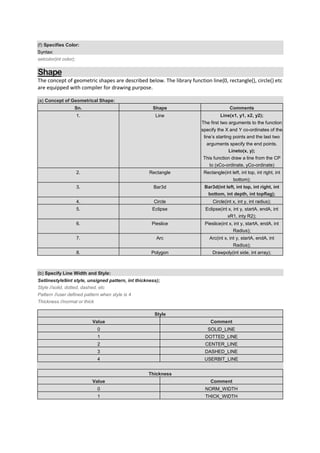
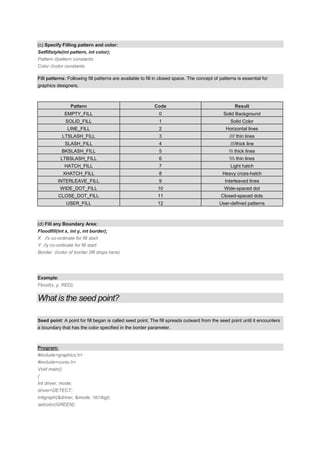
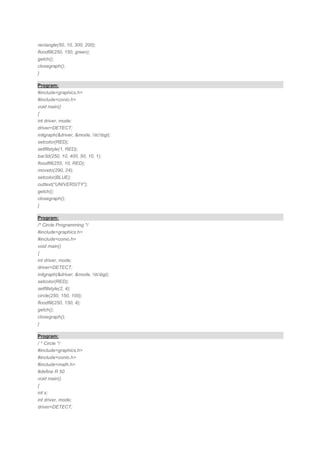
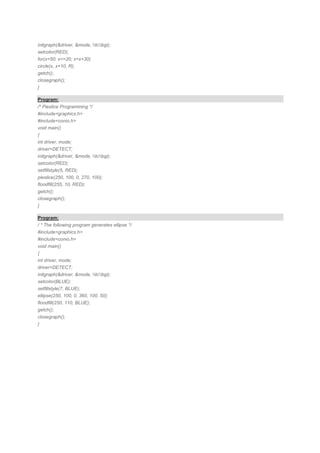
The document discusses computer graphics concepts including pixels, colors, shapes, text, and programming. It covers:
1) Pixels are the smallest controllable elements that make up a digital image. Each pixel has a location and color value.
2) Colors are used for backgrounds and foregrounds. There are predefined color codes for text and graphics.
3) Basic shapes include lines, rectangles, circles, ellipses, polygons, and pie slices. Functions like line(), rectangle(), and circle() are used to draw shapes.
4) Text functions allow setting font, size, color, and position in graphics mode. Outtext() displays text.
5) Example programs demonstrate drawing shapes and text
This document provides information about graphics functions in C. It begins by explaining graphics modes and how images are displayed on screens using pixels. It then provides details on the initgraph() function which initializes the graphics system. The rest of the document summarizes many common graphics functions like line(), rectangle(), circle(), putpixel(), getpixel() and more, explaining what they do and their parameters.
This document provides an introduction to computer graphics and outlines some basic functions. It discusses initializing graphics mode using initgraph(), closing graphics mode with closegraph(), and checking for errors with graphresult(). Common graphics functions introduced include putpixel() and getpixel() for drawing pixels, setcolor() and setbcolor() for setting colors, and line(), circle(), ellipse(), and rectangle() for drawing shapes. Additional functions like settextstyle() and outtext() are used for displaying text.
For all who wish to learn c graphics programming, no knowledge of graphics concepts is required. C Graphics programming is very easy and interesting. You can use graphics programming for developing your own games, in making projects, for animation etc. It's not like traditional C programming in which you have to apply complex logic in your program and then you end up with a lot of errors and warnings in your program. In C graphics programming you have to use standard library functions ( need not worry if you don't know functions ) to get your task done. Just you pass arguments to the functions and it's done. On this website you will find almost all functions with detailed explanation and a sample program showing the usage of a function. To make things easy you are provided with executable files which you can download and execute. Firstly you should know the function initgraph which is used to initialize the graphics mode . To initialize graphics mode we use initgraph function in our program. initgraph function is present in "graphics.h" header file, so your every graphics program should include "graphics.h" header file. We will discuss initgraph withe help of following sample program:-
This document discusses computer graphics in C language. It describes various graphics functions in C like line(), rectangle(), circle(), arc(), ellipse(), setcolor(), settextstyle() etc. that are used to draw basic shapes and text. It also explains concepts like viewports, color functions and filling patterns that are important for computer graphics programming in C.
This document provides an introduction to graphics programming in C. It discusses setting up graphics using GCC, basic concepts of graphics programming in C, common graphics functions like line(), circle(), rectangle(), and text functions like outtext() and outtextxy(). It also includes a short example program to demonstrate drawing various shapes and text.
The document discusses various graphics concepts used in C programming including:
1. Color constants, fill patterns, graphics drivers, errors, and modes that are used in graphics functions.
2. The functions closegraph, detectgraph, getbkcolor, getcolor, getmaxx, getmaxy, getpixel, getx, gety, grapherrormsg, graphresult, initgraph, outtext, outtexttxy, putpixel, setbkcolor, setcolor, and setfillpattern and their purposes.
3. initgraph initializes the graphics system by loading a driver and putting the system into graphics mode, while closegraph deallocates memory and restores the original screen mode.
This document contains information about computer graphics including:
1. An introduction to computer graphics, its applications, and basic functions like drawing lines, circles, rectangles.
2. Details of 4 assignments - the first involves studying graphics functions, the second develops a CPU architecture GUI, the third defines a point class, and the fourth defines line and circle drawing classes.
3. The last assignment involves writing C++ classes to draw lines using DDA and Bresenham's algorithms and inheriting from the point class, and a circle class inheriting from the line class.
The document discusses computer graphics and provides examples of its applications. It discusses graphics inbuilt functions such as arc(), initgraph(), closegraph(), and line(). It provides code snippets and explanations for these functions. It also lists algorithms for direct and Bresenham lines, circles, ellipses, and their code programs. Finally, it mentions static and dynamic applications of computer graphics.
This file contains all the practicals with output regarding GTU syllabus. so it will help to IT and Computer engineering students. It is really knowledgeable so refer these for computer graphics practicals.
Turbo C Graphics and Mouse ProgrammingHuzaifa Butt
This document discusses graphics and mouse programming in Turbo C. It describes several functions for initializing graphics mode, drawing shapes, displaying text, and setting colors. These functions include initgraph(), outtext(), rectangle(), setcolor(), and cleardevice(). It also covers mouse programming using interrupts, registers, and functions like int86() to get the mouse status, position, and button pressed. Input and output data is passed between registers like AX, BX, CX, and DX.
The document contains an algorithm for drawing an ellipse using the midpoint algorithm. It initializes the graphics system and gets user input for the major and minor radii. It calculates an initial decision parameter P and plots the first point. It then loops while a condition on the x and y coordinates is met, incrementing x by 1 each iteration. The decision parameter P is updated each iteration based on whether it is greater than or less than 0. Symmetric points are plotted in each quadrant to draw the ellipse. After drawing across the minor axis, it continues the algorithm to draw across the major axis by initializing new parameters and looping while y is not 0, updating the decision parameter P1 and decrementing y each iteration.
The document contains programs for computer graphics concepts like drawing lines, circles, ellipses and implementing transformations using C programming language. It includes 27 programs - programs to draw lines using different algorithms, programs to draw circles using midpoint, polynomial and Bresenham's algorithm, programs to draw ellipses using different methods and programs to implement 2D transformations like translation, rotation, scaling, reflection, shearing on graphics objects. The programs take input coordinates, draw the graphics primitives and implement the transformations.
The document provides an algorithm and sample program to implement Bresenham's circle drawing algorithm in C.
The algorithm reads the radius of the circle, initializes the starting points and decision variable, and then uses a do-while loop to plot pixels on the circle by incrementing x and conditionally incrementing or decrementing y based on the decision variable.
The sample program includes code to read the radius, initialize graphics mode, set starting points, and implement the do-while loop to plot pixels and delay between each pixel for visualization. It plots all four quadrants of the circle.
The document provides a lab manual for computer graphics experiments in C language. It includes experiments on digital differential analyzer algorithm, Bresenham's line drawing algorithm, midpoint circle generation algorithm, ellipse generation algorithm, text and shape creation, 2D and 3D transformations, curve generation, and basic animations. It outlines the hardware and software requirements to run the experiments and provides background, algorithms, sample programs and outputs for each experiment.
This document provides an overview of graphics programming in C using Turbo C++. It outlines the course content which includes drawing points, lines, polygons, circles and filling areas. It also discusses geometric transformations in 2D and 3D as well as line clipping algorithms. It provides details on setting up the integrated development environment and creating a graphics header file to initialize and exit graphics mode. It includes code examples to display a single point on the screen by approximating pixel coordinates as integers.
The document provides an introduction to computer graphics including:
1) Computer graphics are images created using computers through specialized software and hardware. They have made computers easier to use and better for interpreting data.
2) Computer graphics are used in many fields including science, engineering, medicine, business, art, entertainment, education and more.
3) Common techniques in computer graphics include computer-aided design, rendering, and image processing. Rendering generates images from 3D models using computer programs.
This document provides instructions for drawing basic shapes in graphics mode in Turbo C++. It explains how to enable the graphics library, initialize graphics mode, and use functions like putpixel, line, rectangle, circle, ellipse, arc, bar and bar3d to draw pixels, lines, rectangles, circles, ellipses, arcs, filled rectangles and 3D filled rectangles. Examples of code are given to draw each shape. Programming assignments are provided to combine the shapes to draw a flag, hut, smiley face and fish.
The document contains instructions for 15 computer graphics experiments to be completed in a Computer Graphics lab course. The experiments include programs to draw lines and shapes using algorithms like DDA, Bresenham, midpoint circle and ellipse algorithms. Programs for transformations like rotation, translation, scaling and shearing of shapes are also included. Boundary fill and flood fill algorithms are among the programs listed.
This document contains a computer graphics lab manual with instructions and sample code for programming graphics experiments. It includes:
1. An introduction and list of experiments covering topics like drawing lines, circles, ellipses, implementing transformations and clipping.
2. Samples of experiment documents with aims, descriptions of algorithms, code samples and questions. The experiments cover drawing pixels, lines using DDA and Bresenham's algorithms, circles using Bresenham's algorithm, and ellipses.
3. The code samples demonstrate how to use graphics functions in C like initgraph, putpixel, getpixel to implement various computer graphics algorithms.
The document provides source code for generating and manipulating computer graphics using various algorithms. It includes algorithms for drawing lines, circles and curves, as well as algorithms for translating, rotating, and scaling two-dimensional and three-dimensional objects. The source code is written in C/C++ and uses graphics libraries to output the results. Various input parameters are taken from the user and output is displayed to demonstrate the algorithms.
This document is a practical file submitted by a student for their Computer Graphics subject. It contains an index listing the topics covered, which include introductions to computer graphics and its applications, descriptions of basic graphics functions in C++ like line, circle, and ellipse drawing algorithms, and examples of applications programs. The file provides information and code samples to help the student learn about core computer graphics concepts and programming.
Matlab Feature Extraction Using Segmentation And Edge DetectionDataminingTools Inc
This document discusses several image processing techniques in Matlab:
1) Edge detection using the edge function and Sobel and Canny edge detection algorithms.
2) The radon transform which computes projections of an image along specified directions and the inverse radon transform used to reconstruct images from projections.
3) Marker-controlled watershed segmentation which separates touching objects in an image using morphological operations like gradients and markers.
The document contains 10 programs written in C programming language to perform various 2D and 3D graphics operations like drawing lines, rectangles, circles, ellipses, torus, scaling, rotating, shearing and reflecting objects. Program 1-5 demonstrate drawing basic shapes like line, rectangle, circle and ellipse. Program 6 draws a 3D torus using OpenGL. Program 7-9 demonstrate transformations like scaling, rotating and shearing of objects. Program 10 shows reflection of an object about x-axis, y-axis and origin.
This document contains solutions to two questions about image processing techniques. Question 1 involves implementing Sobel edge detection using 4 convolution masks and calculating the approximate gradient magnitude. Question 2 involves implementing a corner detector by building a neighborhood matrix around each pixel, computing its singular values via SVD, and highlighting locations where the second singular value exceeds a threshold after removing neighboring duplicates.
The document describes a computer graphics lab and contains programs to perform various graphics functions in C++ using graphics libraries. It includes 14 programs to:
1) Draw a line using the DDA algorithm
2) Draw a scenery using 20 graphics functions such as lines, circles, rectangles
3) Draw a circle using Bresenham's circle drawing algorithm
The document provides explanations of various graphics functions from the graphics.h library in C language. It discusses functions for initializing graphics mode, drawing basic shapes like lines, rectangles, circles, getting and setting colors, reading and writing pixel values, loading and saving bitmap images, handling events and cleaning up graphics memory. It also includes code snippets to demonstrate drawing a rectangle, smiley and star using these graphics functions.
This document discusses graphics programming in C++. It explains that the graphics.h and graphics.lib files are needed to use graphics functions. It also describes graphics modes, the XY coordinate system used in graphics with the origin at the top-left corner, and some common graphics functions like rectangle(), circle(), and closegraph(). It provides examples of using functions like setcolor() and putpixel() to draw on the screen.
This ppt's introduced Basics of computer graphics, which helps to diploma in computer engineering, DCA BCA, BE computer science student's to improve study in computer graphics.
The document discusses class design principles for a graphing library. It describes using inheritance to create a class hierarchy with Shape as the base class. Shape defines common functionality like drawing lines and storing points. Derived classes like Circle override draw_lines() to draw themselves polymorphically. Encapsulation is used to hide data representations and provide uniform access through member functions.
The document discusses class design principles for a graphing library. It describes using inheritance to create a class hierarchy with a base Shape class. Shape stores common data like color and lines. Derived classes like Circle override draw_lines() to draw themselves polymorphically. Encapsulation is used to hide data and access it through member functions to allow future flexibility.
Pixel shaders are programs that run on the GPU to manipulate pixels. There are different types of shaders including pixel shaders, vertex shaders, and geometric shaders. Shaders replaced fixed functionality with programmability, allowing effects to be programmed. Popular shader programming languages include HLSL, GLSL, and Cg. Cg is a C-like language designed for GPU programming and shader development. It allows shaders to be written in a high-level language and compiled for different GPUs.
- Chapter 13 shows how graphics shapes and operations are implemented in C++ classes and provides more examples.
- Key classes are introduced like Point, Line, Lines, Color, and Text to represent graphical elements.
- Methods are defined for these classes to manipulate and draw the elements like setting color, style, and adding text.
- More complex shapes like polylines and a color matrix are demonstrated composed of simpler graphic objects.
This document discusses pixel shaders and GPU programming. It begins by defining what a shader is and describing the basic entities and traits involved in shader programming. It then covers the different types of shaders including pixel shaders, vertex shaders, and geometric shaders. The document discusses the graphics pipeline and how shaders are used. It introduces Cg as a programming language for shaders and provides examples of loading and using pixel shaders in OpenGL.
The document discusses generics and partial classes in C# and .NET framework 4.5. It provides code examples of using generics to define classes and methods that operate on type parameters. It also explains how to define partial classes that split a class definition across multiple files. The document then covers basics of Windows forms programming, including the Graphics object, drawing strings, lines, rectangles, and using coordinates and shapes.
\begin{pspicture}(-0.5,-0.5)(2.5,1.5)
\psdots(0,0)(2,0)(1,1)
\end{pspicture}
The document discusses using the PSTricks package to draw graphics in LaTeX. It begins by explaining how PSTricks uses coordinate pairs to specify points, with the default axes being the current text position. It then demonstrates how to draw single dots with \psdots and multiple dots by listing coordinate pairs. Enclosing the graphics in a \begin{pspicture} environment ensures space is reserved. Line segments can be drawn with \psline, and linestyle options like dashed and dotted
Computer Project For Class XII Topic - The Snake Game Pritam Samanta
This was a group project but it was completely made by me. The program is fully working. There are no bugs. This will not work in OLD C++ COMPILERS namely turbo-c++,etc., but it will work in latest ANSI COMPLIERS namely Dev-c++, Code-blocks, ellipse, etc. If any one has any suggestion for correction or improvement please contact: appleball@inbound.plus. Every suggestions are valuable. Feel free to share this with your friends to share the happiness.
This ppt explains basic topics of computer graphics like - pixel, resolution, text mode, graphics mode, various types of displays, applications of computer graphics etc.
The document provides an overview of C# program structure including comments, identifiers, classes, methods, data types, variables, and input/output. Some key points:
- C# uses single-line and multi-line comments for documentation.
- Identifiers name variables, classes, and methods using letters, digits and underscores with case sensitivity.
- A class contains methods and defines the structure of an object. The Main method is entry point for console apps.
- Built-in data types include integers, floats, decimals, booleans, characters and strings.
- Variables store values of a specific data type and are declared with type and name. Constants are similar but values cannot change.
- Console
The document contains 40 multiple choice questions related to computer science class 12. It covers topics like variables, data types, operators, loops, functions, arrays and more. The questions test concepts like escape sequences, format specifiers, assignment operators, comments, input/output functions, and the difference between various loops in C programming language. It is a practice test to help students prepare for their computer science exam.
- Java applets allow Java programs to run within web browsers. All applets extend the Applet class and override lifecycle methods like init(), start(), stop(), and destroy().
- To create an applet, you define its structure using these lifecycle methods and draw to the screen using the Graphics object's drawing methods. Applets are compiled and run within HTML using the <applet> tag.
- Applets differ from standalone Java applications in that they have security restrictions and run within a web browser rather than having their own execution environment. The Graphics class provides methods for drawing various shapes, text, and images to the applet display area.
This document discusses graphics classes and how shapes are implemented in C++. It describes:
- The display model where objects are "attached" to windows and the display engine draws the objects.
- The code organization with interface classes like Shape and implementation files.
- Key classes like Point, Line, Lines, Color, and Polylines. Lines represents a set of lines.
- Methods to add shapes, lines, and points. Color and Line_style are used to manipulate appearance.
- Examples that demonstrate creating and manipulating lines, grids, and polylines using these classes. Implementation details are also provided.
THIS SLIDE CONTAINS WHOLE SYLLABUS OF ENGINEERING DRAWING/GRAPHICS. IT IS THE MOST SIMPLE AND INTERACTIVE WAY TO LEARN ENGINEERING DRAWING.SYLLABUS IS RELATED TO rajiv gandhi proudyogiki vishwavidyalaya / rajiv gandhi TECHNICAL UNIVERSITY ,BHOPAL.
GraphSummit Singapore | The Art of the Possible with Graph - Q2 2024Neo4j
Neha Bajwa, Vice President of Product Marketing, Neo4j
Join us as we explore breakthrough innovations enabled by interconnected data and AI. Discover firsthand how organizations use relationships in data to uncover contextual insights and solve our most pressing challenges – from optimizing supply chains, detecting fraud, and improving customer experiences to accelerating drug discoveries.
Essentials of Automations: The Art of Triggers and Actions in FMESafe Software
In this second installment of our Essentials of Automations webinar series, we’ll explore the landscape of triggers and actions, guiding you through the nuances of authoring and adapting workspaces for seamless automations. Gain an understanding of the full spectrum of triggers and actions available in FME, empowering you to enhance your workspaces for efficient automation.
We’ll kick things off by showcasing the most commonly used event-based triggers, introducing you to various automation workflows like manual triggers, schedules, directory watchers, and more. Plus, see how these elements play out in real scenarios.
Whether you’re tweaking your current setup or building from the ground up, this session will arm you with the tools and insights needed to transform your FME usage into a powerhouse of productivity. Join us to discover effective strategies that simplify complex processes, enhancing your productivity and transforming your data management practices with FME. Let’s turn complexity into clarity and make your workspaces work wonders!
HCL Notes und Domino Lizenzkostenreduzierung in der Welt von DLAUpanagenda
Webinar Recording: https://www.panagenda.com/webinars/hcl-notes-und-domino-lizenzkostenreduzierung-in-der-welt-von-dlau/
DLAU und die Lizenzen nach dem CCB- und CCX-Modell sind für viele in der HCL-Community seit letztem Jahr ein heißes Thema. Als Notes- oder Domino-Kunde haben Sie vielleicht mit unerwartet hohen Benutzerzahlen und Lizenzgebühren zu kämpfen. Sie fragen sich vielleicht, wie diese neue Art der Lizenzierung funktioniert und welchen Nutzen sie Ihnen bringt. Vor allem wollen Sie sicherlich Ihr Budget einhalten und Kosten sparen, wo immer möglich. Das verstehen wir und wir möchten Ihnen dabei helfen!
Wir erklären Ihnen, wie Sie häufige Konfigurationsprobleme lösen können, die dazu führen können, dass mehr Benutzer gezählt werden als nötig, und wie Sie überflüssige oder ungenutzte Konten identifizieren und entfernen können, um Geld zu sparen. Es gibt auch einige Ansätze, die zu unnötigen Ausgaben führen können, z. B. wenn ein Personendokument anstelle eines Mail-Ins für geteilte Mailboxen verwendet wird. Wir zeigen Ihnen solche Fälle und deren Lösungen. Und natürlich erklären wir Ihnen das neue Lizenzmodell.
Nehmen Sie an diesem Webinar teil, bei dem HCL-Ambassador Marc Thomas und Gastredner Franz Walder Ihnen diese neue Welt näherbringen. Es vermittelt Ihnen die Tools und das Know-how, um den Überblick zu bewahren. Sie werden in der Lage sein, Ihre Kosten durch eine optimierte Domino-Konfiguration zu reduzieren und auch in Zukunft gering zu halten.
Diese Themen werden behandelt
- Reduzierung der Lizenzkosten durch Auffinden und Beheben von Fehlkonfigurationen und überflüssigen Konten
- Wie funktionieren CCB- und CCX-Lizenzen wirklich?
- Verstehen des DLAU-Tools und wie man es am besten nutzt
- Tipps für häufige Problembereiche, wie z. B. Team-Postfächer, Funktions-/Testbenutzer usw.
- Praxisbeispiele und Best Practices zum sofortigen Umsetzen
How to Get CNIC Information System with Paksim Ga.pptxdanishmna97
Pakdata Cf is a groundbreaking system designed to streamline and facilitate access to CNIC information. This innovative platform leverages advanced technology to provide users with efficient and secure access to their CNIC details.
Unlocking Productivity: Leveraging the Potential of Copilot in Microsoft 365, a presentation by Christoforos Vlachos, Senior Solutions Manager – Modern Workplace, Uni Systems
Goodbye Windows 11: Make Way for Nitrux Linux 3.5.0!SOFTTECHHUB
As the digital landscape continually evolves, operating systems play a critical role in shaping user experiences and productivity. The launch of Nitrux Linux 3.5.0 marks a significant milestone, offering a robust alternative to traditional systems such as Windows 11. This article delves into the essence of Nitrux Linux 3.5.0, exploring its unique features, advantages, and how it stands as a compelling choice for both casual users and tech enthusiasts.
Observability Concepts EVERY Developer Should Know -- DeveloperWeek Europe.pdfPaige Cruz
Monitoring and observability aren’t traditionally found in software curriculums and many of us cobble this knowledge together from whatever vendor or ecosystem we were first introduced to and whatever is a part of your current company’s observability stack.
While the dev and ops silo continues to crumble….many organizations still relegate monitoring & observability as the purview of ops, infra and SRE teams. This is a mistake - achieving a highly observable system requires collaboration up and down the stack.
I, a former op, would like to extend an invitation to all application developers to join the observability party will share these foundational concepts to build on:
Sudheer Mechineni, Head of Application Frameworks, Standard Chartered Bank
Discover how Standard Chartered Bank harnessed the power of Neo4j to transform complex data access challenges into a dynamic, scalable graph database solution. This keynote will cover their journey from initial adoption to deploying a fully automated, enterprise-grade causal cluster, highlighting key strategies for modelling organisational changes and ensuring robust disaster recovery. Learn how these innovations have not only enhanced Standard Chartered Bank’s data infrastructure but also positioned them as pioneers in the banking sector’s adoption of graph technology.
UiPath Test Automation using UiPath Test Suite series, part 5DianaGray10
Welcome to UiPath Test Automation using UiPath Test Suite series part 5. In this session, we will cover CI/CD with devops.
Topics covered:
CI/CD with in UiPath
End-to-end overview of CI/CD pipeline with Azure devops
Speaker:
Lyndsey Byblow, Test Suite Sales Engineer @ UiPath, Inc.
“An Outlook of the Ongoing and Future Relationship between Blockchain Technologies and Process-aware Information Systems.” Invited talk at the joint workshop on Blockchain for Information Systems (BC4IS) and Blockchain for Trusted Data Sharing (B4TDS), co-located with with the 36th International Conference on Advanced Information Systems Engineering (CAiSE), 3 June 2024, Limassol, Cyprus.
Best 20 SEO Techniques To Improve Website Visibility In SERPPixlogix Infotech
Boost your website's visibility with proven SEO techniques! Our latest blog dives into essential strategies to enhance your online presence, increase traffic, and rank higher on search engines. From keyword optimization to quality content creation, learn how to make your site stand out in the crowded digital landscape. Discover actionable tips and expert insights to elevate your SEO game.
Building Production Ready Search Pipelines with Spark and MilvusZilliz
Spark is the widely used ETL tool for processing, indexing and ingesting data to serving stack for search. Milvus is the production-ready open-source vector database. In this talk we will show how to use Spark to process unstructured data to extract vector representations, and push the vectors to Milvus vector database for search serving.
Pushing the limits of ePRTC: 100ns holdover for 100 daysAdtran
At WSTS 2024, Alon Stern explored the topic of parametric holdover and explained how recent research findings can be implemented in real-world PNT networks to achieve 100 nanoseconds of accuracy for up to 100 days.
Driving Business Innovation: Latest Generative AI Advancements & Success StorySafe Software
Are you ready to revolutionize how you handle data? Join us for a webinar where we’ll bring you up to speed with the latest advancements in Generative AI technology and discover how leveraging FME with tools from giants like Google Gemini, Amazon, and Microsoft OpenAI can supercharge your workflow efficiency.
During the hour, we’ll take you through:
Guest Speaker Segment with Hannah Barrington: Dive into the world of dynamic real estate marketing with Hannah, the Marketing Manager at Workspace Group. Hear firsthand how their team generates engaging descriptions for thousands of office units by integrating diverse data sources—from PDF floorplans to web pages—using FME transformers, like OpenAIVisionConnector and AnthropicVisionConnector. This use case will show you how GenAI can streamline content creation for marketing across the board.
Ollama Use Case: Learn how Scenario Specialist Dmitri Bagh has utilized Ollama within FME to input data, create custom models, and enhance security protocols. This segment will include demos to illustrate the full capabilities of FME in AI-driven processes.
Custom AI Models: Discover how to leverage FME to build personalized AI models using your data. Whether it’s populating a model with local data for added security or integrating public AI tools, find out how FME facilitates a versatile and secure approach to AI.
We’ll wrap up with a live Q&A session where you can engage with our experts on your specific use cases, and learn more about optimizing your data workflows with AI.
This webinar is ideal for professionals seeking to harness the power of AI within their data management systems while ensuring high levels of customization and security. Whether you're a novice or an expert, gain actionable insights and strategies to elevate your data processes. Join us to see how FME and AI can revolutionize how you work with data!
Maruthi Prithivirajan, Head of ASEAN & IN Solution Architecture, Neo4j
Get an inside look at the latest Neo4j innovations that enable relationship-driven intelligence at scale. Learn more about the newest cloud integrations and product enhancements that make Neo4j an essential choice for developers building apps with interconnected data and generative AI.
Programming Foundation Models with DSPy - Meetup SlidesZilliz
Prompting language models is hard, while programming language models is easy. In this talk, I will discuss the state-of-the-art framework DSPy for programming foundation models with its powerful optimizers and runtime constraint system.
Programming Foundation Models with DSPy - Meetup Slides
Computer Graphics Concepts
1. Computer Graphics Concepts
“The picture worth’s, thousand words” is very famous Chinese saying. Really, literate can read few
sequences of characters but all can read the picture. It is out of bondage of literacy. Almost of high level
language supports graphics and this facility of language is exploited in building of GUI (Graphical User
Interface).
The computer graphics is concern with generation, representation, manipulation and display of pictures
with the aid of computer. It may be divided into three broad area (a) generative graphics, (b) cognitive
graphics, and (c) Image processing. Any graphics package has to furnish above tasks.
C / C++ support graphics, sounds and all the features of high level languages. It works in two
modes: Text mode and Graphics mode. The text mode supports only text and color, but not
sophisticated graphics. In text mode, graphics are presented by ASCII characters and some special
characters. The Graphics mode supports colors and special statements for sophisticated graphics and
animation. The graphics are array of pixels or patterns of pixels.
Pixel
The picture element is called pixels. It is a unit of presentation. Each pixel occupies some bits in memory.
We have listened the term raster or bitmap image. These images are composed by two- dimensional
array of pixels. Each pixel has horizontal and vertical location in image.
The horizontal scan lines are formed on CRT (Cathode Ray Tube) when the drawing cuts the horizontal
scan lines, cutting point is termed as pixels.
COLOR
The concept of background and foreground color is necessary for presentation of graphics. The success
of graphics designer depends on suitable combination of background and foreground colors. The color
of canvas is called background and color of text and graphics is called foreground color. For example, the
color of blackboard is a background and the color of written text or drawing is a foreground color. The
color is supported by both the modes.
Color Code Comments
BLACK 0 Background/ Background
BLUE 1 Background/ Background
GREEN 2 Background/ Background
CYAN 3 Background/ Background
RED 4 Background/ Background
MAGENTA 5 Background/ Background
BROWN 6 Background/ Background
LIGHTGRAY 7 Background/ Background
2. DRARKGRAY 8 Foreground
LIGHTBLUE 9 Foreground
LIGHTGREEN 10 Foreground
LIGHTCYAN 11 Foreground
LIGHTRED 12 Foreground
LIGHTMAGENTA 13 Foreground
YELLOW 14 Foreground
WHITE 15 Foreground
(a) void textcolor(int color);
From 0 to 15 colors, numbers or constants are used to set text colors.
Example:
textcolor (RED);
textcolor(4);
The blinking effect is added by adding 128 in color code or adding BLINK with color constant.
Example:
textcolor(RED+BLINK);
textcolor(132);
The code 4 is for RED color and 128 for BLINK.
(b) void textbackground(int color);
From 0 to 7, numbers or constants are used for colors. It is used to set background color of text.
Example:
textbackground(BLUE);
textbackground(1);
(c) gotoxy(col, row): It is used to place cursor at specified column and row. It contains integer as column and row
data type. In graphics, y-axis goes from top to bottom, not from left to right like as mathematics.
Example:
int col=50;
int row=45;
gotoxy(col, row); // it places cursor at column number 50 of rows 45.
Cputs(“BUDDHA”);
gotoxy(col, row);
3. (d) delay(int time): The function is supported by header file dos.h. it is used to delay next display.
Example:
Gotoxy(29, 10);
Cputs(“Department of computer Science”);
Delay(1000);
Gotoxy(29, 11);
Cputs(“Kashmir University”);
Program:
#include<conio.h>
void main()
{
crscr();
textcolor(RED);
gotoxy(27, 10);
cputs(“Welcome ”);
gotoxy(25, 11);
cputs(“ Iqbal Institute Of Technology And Management”);
gotoxy(25, 12);
getch();
}
Text in Graphics Mode
(a) Specify Text Font, Orientation and size:
Settextstyle(int font, int direction, int size)
Font //name of font
Direction //Horizontal or Vertical
Size // Size of Character
Font in standard library:
Value Constants File Comment
0 DEFAULT_FONT Compiler automatic Bit-mapped, 8×8
1 TRIPLEX_FONT Trip.chr Times-roman styles
2 SMALL_FONT Litt.chr For small letters
3 SANS_SERIF_FONT Sans.chr Heavy sans-serif
4 GOTHIC_FONT Gothic.chr Gothic
5 SCRIPT_FONT Scri.chr Script
6 SIMPLEX_FONT Simp.chr Light sans-serif
7 TRIPLEX_SRC_FONT Tscp.chr Italic
8 COMPLEX_FONT Lcom.chr Heavy times Roman
9 EUROPEAN_FONT Euro.chr Square letter
10 BOLD_FONT Bold.chr Thick letters
4. Example:
Fontsize=6;
Settextstyle(GOTHIC_FONT, HORIZ_DIR, fontsize);
Outtext(“Computer Graphics”);
Settextstyle(TRIPLEX_FONT, VERT_DIR, fontsize);
Outtext(“University”);
(b) Set Text Justification (Position Relative to Cursor Pointer, CP)
Settextjustify(int horizontal, int vertical)
Horizontal //horizontal justification constants
Vertical //vertical justification constants
Example:
Settextjustify(RIGHT_TEXT, TOP_TEXT);
Outtext(“IQBAL INSTITUTE OF TECHNOLOGY AND MANAGEMENT”);
Horizontal Justification:
Value Constants Comment
0 LEFT_TEXT CP at left of text (default justification)
1 CENTER_TEXT CP in horizontal center of text
2 RIGHT_TEXT CP at right of text
Vertical Justification:
Value Constants Comment
0 BOTTOM_TEXT CP at bottom of text
1 CENTER_TEXT CP in vertical center of text
(c) Change Character Size and Properties:
Setusercharsize(int multx, divx, multy, int divvy);
Multx //multiples with character
Divx //divides with character
Multy //multiplies height of character
Divvy //divides with character
Example:
Multx=1; divx=2;
Multy=1; divvy=2;
Setusercharsize(int multx, divx, multy, int divvy);
Outtext(“Happy New Year”);
(d) moveto(): The library function moveto() sets the location of CP, using two int arguments to indicate the X and Y
co-ordinates.
Syntax:
moveto(int column, int row);
(e) outtext(): Graphics text is displayed with the outtext() library.
Example:
Outtext(“University express”);
5. (f) Specifies Color:
Syntax:
setcolor(int color);
Shape
The concept of geometric shapes are described below. The library function line(0, rectangle(), circle() etc
are equipped with compiler for drawing purpose.
(a) Concept of Geometrical Shape:
Sn. Shape Comments
1. Line Line(x1, y1, x2, y2);
The first two arguments to the function
specify the X and Y co-ordinates of the
line’s starting points and the last two
arguments specify the end points.
Lineto(x, y);
This function draw a line from the CP
to (xCo-ordinate, yCo-ordinate)
2. Rectangle Rectangle(int left, int top, int right, int
bottom);
3. Bar3d Bar3d(int left, int top, int right, int
bottom, int depth, int topflag);
4. Circle Circle(int x, int y, int radius);
5. Eclipse Eclipse(int x, int y, startA, endA, int
xR1, inty R2);
6. Pieslice Pieslice(int x, int y, startA, endA, int
Radius);
7. Arc Arc(int x, int y, startA, endA, int
Radius);
8. Polygon Drawpoly(int side, int array);
(b) Specify Line Width and Style:
Setlinestyle9int style, unsigned pattern, int thickness);
Style //solid, dotted, dashed, etc
Pattern //user defined pattern when style is 4
Thickness //normal or thick
Style
Value Comment
0 SOLID_LINE
1 DOTTED_LINE
2 CENTER_LINE
3 DASHED_LINE
4 USERBIT_LINE
Thickness
Value Comment
0 NORM_WIDTH
1 THICK_WIDTH
6. (c) Specify Filling pattern and color:
Setfillstyle(int pattern, int color);
Pattern //pattern constants
Color //color constants
Fill patterns: Following fill patterns are available to fill in closed space. The concept of patterns is essential for
graphics designers.
Pattern Code Result
EMPTY_FILL 0 Solid Background
SOLID_FILL 1 Solid Color
LINE_FILL 2 Horizontal lines
LTSLASH_FILL 3 //// thin lines
SLASH_FILL 4 ////thick line
BKSLASH_FILL 5 thick lines
LTBSLASH_FILL 6 thin lines
HATCH_FILL 7 Light hatch
XHATCH_FILL 8 Heavy cross-hatch
INTERLEAVE_FILL 9 Interleaved lines
WIDE_DOT_FILL 10 Wide-spaced dot
CLOSE_DOT_FILL 11 Closed-spaced dots
USER_FILL 12 User-defined patterns
(d) Fill any Boundary Area:
Floodfill(int x, int y, int border);
X //x co-ordinate for fill start
Y //y co-ordinate for fill start
Border //color of border (fill stops here)
Example:
Flood(x, y, RED);
What is the seed point?
Seed point: A point for fill began is called seed point. The fill spreads outward from the seed point until it encounters
a boundary that has the color specified in the border parameter.
Program:
#include<graphics.h>
#include<conio.h>
Void main()
{
Int driver, mode;
driver=DETECT;
initgraph(&driver, &mode, tcbgi);
setcolor(GREEN);