This document summarizes the results of repeated surveys of public attitudes regarding water issues in Texas following periods of drought. It finds that from 2008 to 2014, the percentage of Texans who believe that water quantity is an issue in their area and that their area will experience prolonged drought both increased significantly. Additionally, the percentage of Texans who believe there will likely not be enough water resources to meet needs in 10 years increased substantially. The survey also found that more Texans now believe global warming will cause a significant decrease in rainfall, though about a third still say they don't know.
Causes and Consequences of Declining Municipal Water DemandEMA-tucson
Webcast presented by Gary Woodard, M&A Senior Water Policy & Economics Consultant, for the National Ground Water Association on the municipal water demand declines in the Southwest
Housing Problems of Climate Migrant Poor People: A Study in Dhaka CityKarisma Amjad
Attended “Third Annual National Conference on Urban Resilience to Climate: Building Climate- Resilient, Migrant-Friendly Cities and Towns”, 18 to 20 November 2018 presented research paper on “Housing Problems of Climate Migrant Poor People: A Study in Dhaka City” organized by ICCCAD.
City of Cambridge Climate Change Preparedness & Resilience Planning - A Model...JSI
APHA Presentation - Best Practices of Policy Initiatives at the Local & Community Level to Address Climate Impacts.
A collaborative project with the City of Cambridge, JSI Research & Training Institute, Inc. and Kleinfelder, Inc.
Already exacerbating conditions such as asthma and heat-related mortality, climate change is a growing threat to public health that each community must confront. The City of Cambridge, MA is among the first in the nation to comprehensively plan and prepare strategic public health responses, with a focus on equity to avert intensifying health disparities. This session will review the approach taken by the City that can be replicated, starting with having conducted a thorough 2015 Cambridge Climate Change Vulnerability Assessment. The Assessment identified inequities in flood-related risks, heat exposures, and access to critical resources that varied by neighborhood and demographic risk factors. Cohorts with greater physical or mental health vulnerability were identified by several parameters. Socioeconomically disadvantaged groups, the elderly (particularly the elderly living alone) and people with who reported speak English less than very well experience impacts of heat and flooding that can be two to four times greater than people without these characteristics.
A literature review highlighted potential risk mitigation strategies. These were reviewed to identify existing capacity and gaps by a Stakeholder Workgroup comprised of health/public health institutions, medical suppliers, emergency responders, utility representatives, and those representing or serving vulnerable populations including elder service agencies, low-income housing organizations, and environmental justice advocates. Prioritized actions were incorporated into a Climate Change Preparedness and Resiliency Plan. They include: 1) Addressing transportation/accessibility disruptions. 2) Protecting critical healthcare capacity and access, maintaining access to essential medications. 3) Limiting the consequences of utility service failures during extreme weather-related events such as extreme heat, extreme cold, and/or flooding from storm surges and/or intense precipitation events. 4) Reducing long-term flooding and heat islands risks; and protecting indoor environments (especially basement apartments and senior housing). Employing a social/ecological framework, of central importance is supporting resident leadership to build social cohesion and address social determinants for individual, family, and neighborhood preparedness, using participation and other process indicators to monitor and evaluate engagement and readiness over time. We will discuss progress on resident engagement and the cross-sectoral collaborative efforts that have been launched as a result.
This is a presentation given at a stakeholder meeting to discuss community views of watershed management in the Wappinger Creek Watershed in the Hudson Valley, New York, May 2010.
Drinking Water Systems management perceptions, priorities, and expectations: ...AngelosAlamanos
Drinking Water Systems management perceptions, priorities, and expectations - using Multicriteria Analysis (AHP) to compare water consumption factors effect and water conservation measures perception to 2 sample groups: A Water Utility and its customers (i.e. decision-makers and stakeholders). Perceptions, priorities, and expectations are compared, while willingness to pay (WTP) is also explored for water services improvements.
Education, awareness, and healthy initiatives to increase action are required, so the concept of Water Stewardship is examined (international practices review). Finally, a novel way is suggested to assess Water Stewardship Standards.
Similar to Repeated Survey of Public Attitudes Following an Extended Period of Exceptional Drought in Texas - Boellstorff (20)
WRI’s brand new “Food Service Playbook for Promoting Sustainable Food Choices” gives food service operators the very latest strategies for creating dining environments that empower consumers to choose sustainable, plant-rich dishes. This research builds off our first guide for food service, now with industry experience and insights from nearly 350 academic trials.
"Understanding the Carbon Cycle: Processes, Human Impacts, and Strategies for...MMariSelvam4
The carbon cycle is a critical component of Earth's environmental system, governing the movement and transformation of carbon through various reservoirs, including the atmosphere, oceans, soil, and living organisms. This complex cycle involves several key processes such as photosynthesis, respiration, decomposition, and carbon sequestration, each contributing to the regulation of carbon levels on the planet.
Human activities, particularly fossil fuel combustion and deforestation, have significantly altered the natural carbon cycle, leading to increased atmospheric carbon dioxide concentrations and driving climate change. Understanding the intricacies of the carbon cycle is essential for assessing the impacts of these changes and developing effective mitigation strategies.
By studying the carbon cycle, scientists can identify carbon sources and sinks, measure carbon fluxes, and predict future trends. This knowledge is crucial for crafting policies aimed at reducing carbon emissions, enhancing carbon storage, and promoting sustainable practices. The carbon cycle's interplay with climate systems, ecosystems, and human activities underscores its importance in maintaining a stable and healthy planet.
In-depth exploration of the carbon cycle reveals the delicate balance required to sustain life and the urgent need to address anthropogenic influences. Through research, education, and policy, we can work towards restoring equilibrium in the carbon cycle and ensuring a sustainable future for generations to come.
Prevalence of Toxoplasma gondii infection in domestic animals in District Ban...Open Access Research Paper
Toxoplasma gondii is an intracellular zoonotic protozoan parasite, infect both humans and animals population worldwide. It can also cause abortion and inborn disease in humans and livestock population. In the present study total of 313 domestic animals were screened for Toxoplasma gondii infection. Of which 45 cows, 55 buffalos, 68 goats, 60 sheep and 85 shaver chicken were tested. Among these 40 (88.88%) cows were negative and 05 (11.12%) were positive. Similarly 55 (92.72%) buffalos were negative and 04 (07.28%) were positive. In goats 68 (98.52%) were negative and 01 (01.48%) was recorded positive. In sheep and shaver chicken the infection were not recorded.
Artificial Reefs by Kuddle Life Foundation - May 2024punit537210
Situated in Pondicherry, India, Kuddle Life Foundation is a charitable, non-profit and non-governmental organization (NGO) dedicated to improving the living standards of coastal communities and simultaneously placing a strong emphasis on the protection of marine ecosystems.
One of the key areas we work in is Artificial Reefs. This presentation captures our journey so far and our learnings. We hope you get as excited about marine conservation and artificial reefs as we are.
Please visit our website: https://kuddlelife.org
Our Instagram channel:
@kuddlelifefoundation
Our Linkedin Page:
https://www.linkedin.com/company/kuddlelifefoundation/
and write to us if you have any questions:
info@kuddlelife.org
Characterization and the Kinetics of drying at the drying oven and with micro...Open Access Research Paper
The objective of this work is to contribute to valorization de Nephelium lappaceum by the characterization of kinetics of drying of seeds of Nephelium lappaceum. The seeds were dehydrated until a constant mass respectively in a drying oven and a microwawe oven. The temperatures and the powers of drying are respectively: 50, 60 and 70°C and 140, 280 and 420 W. The results show that the curves of drying of seeds of Nephelium lappaceum do not present a phase of constant kinetics. The coefficients of diffusion vary between 2.09.10-8 to 2.98. 10-8m-2/s in the interval of 50°C at 70°C and between 4.83×10-07 at 9.04×10-07 m-8/s for the powers going of 140 W with 420 W the relation between Arrhenius and a value of energy of activation of 16.49 kJ. mol-1 expressed the effect of the temperature on effective diffusivity.
Willie Nelson Net Worth: A Journey Through Music, Movies, and Business Venturesgreendigital
Willie Nelson is a name that resonates within the world of music and entertainment. Known for his unique voice, and masterful guitar skills. and an extraordinary career spanning several decades. Nelson has become a legend in the country music scene. But, his influence extends far beyond the realm of music. with ventures in acting, writing, activism, and business. This comprehensive article delves into Willie Nelson net worth. exploring the various facets of his career that have contributed to his large fortune.
Follow us on: Pinterest
Introduction
Willie Nelson net worth is a testament to his enduring influence and success in many fields. Born on April 29, 1933, in Abbott, Texas. Nelson's journey from a humble beginning to becoming one of the most iconic figures in American music is nothing short of inspirational. His net worth, which estimated to be around $25 million as of 2024. reflects a career that is as diverse as it is prolific.
Early Life and Musical Beginnings
Humble Origins
Willie Hugh Nelson was born during the Great Depression. a time of significant economic hardship in the United States. Raised by his grandparents. Nelson found solace and inspiration in music from an early age. His grandmother taught him to play the guitar. setting the stage for what would become an illustrious career.
First Steps in Music
Nelson's initial foray into the music industry was fraught with challenges. He moved to Nashville, Tennessee, to pursue his dreams, but success did not come . Working as a songwriter, Nelson penned hits for other artists. which helped him gain a foothold in the competitive music scene. His songwriting skills contributed to his early earnings. laying the foundation for his net worth.
Rise to Stardom
Breakthrough Albums
The 1970s marked a turning point in Willie Nelson's career. His albums "Shotgun Willie" (1973), "Red Headed Stranger" (1975). and "Stardust" (1978) received critical acclaim and commercial success. These albums not only solidified his position in the country music genre. but also introduced his music to a broader audience. The success of these albums played a crucial role in boosting Willie Nelson net worth.
Iconic Songs
Willie Nelson net worth is also attributed to his extensive catalog of hit songs. Tracks like "Blue Eyes Crying in the Rain," "On the Road Again," and "Always on My Mind" have become timeless classics. These songs have not only earned Nelson large royalties but have also ensured his continued relevance in the music industry.
Acting and Film Career
Hollywood Ventures
In addition to his music career, Willie Nelson has also made a mark in Hollywood. His distinctive personality and on-screen presence have landed him roles in several films and television shows. Notable appearances include roles in "The Electric Horseman" (1979), "Honeysuckle Rose" (1980), and "Barbarosa" (1982). These acting gigs have added a significant amount to Willie Nelson net worth.
Television Appearances
Nelson's char
UNDERSTANDING WHAT GREEN WASHING IS!.pdfJulietMogola
Many companies today use green washing to lure the public into thinking they are conserving the environment but in real sense they are doing more harm. There have been such several cases from very big companies here in Kenya and also globally. This ranges from various sectors from manufacturing and goes to consumer products. Educating people on greenwashing will enable people to make better choices based on their analysis and not on what they see on marketing sites.
Repeated Survey of Public Attitudes Following an Extended Period of Exceptional Drought in Texas - Boellstorff
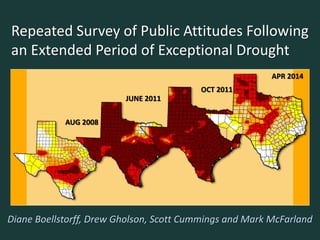
1. Repeated Survey of Public Attitudes Following
an Extended Period of Exceptional Drought
Diane Boellstorff, Drew Gholson, Scott Cummings and Mark McFarland
AUG 2008
JUNE 2011
OCT 2011
APR 2014
2. Acknowledgements
• Project is part of the National Water Survey Needs
Assessment (2001-present) led by Dr. Robert Mahler,
Univ. of Idaho.
• Funded by the USDA/CSREES National Water Program.
• Questionnaire was developed by institutional water
quality coordinators nationwide. State-level
modifications were accepted.
2
3. Water Issues: A Survey of Public Attitudes
Project goals:
• Gauge the level of public
knowledge and concerns
about water issues
• Determine priorities for
outreach/educational
programs
• Measure the impacts of
outreach programs and
changes in public attitudes
at 5-year intervals
Typical Resulting State Publication
4. Survey Design and Administration
• Instrument:
– Based on the survey developed for US EPA Region 10 (2002)
– 59 questions
• Distribution
– Random sample of residential mailing addresses
– August 2008 and April 2014
– Four-stage mailing procedure following Dillman (2000)
Cover letter and survey with a self-addressed, stamped envelope
mailed
Reminder postcard mailed 20 days later to nonresponders
20 days later, another cover letter, survey and business reply
envelope mailed to nonresponders
20 days later, another reminder postcard was sent to
nonresponders 4
5. Survey Instrument
• Importance of water
resource issues
• Importance of management
actions
• Drinking water issues
• Water quality and water
availability
• Water resource information
• Demographics and
residence
2014
2008
6. Respondent Demographics: 2008 and 2014
2008 2014
Response Rate 33% of 1275 29% of 1655
N 419 475
Average Age 57 49
Gender
Male: 63%
Female: 36%
Male: 49%
Female: 51%
Years in Texas: All my life or
more than 10 years
89% 92%
7. Respondent Demographics: 2008 and 2014
2008 2014
Response Rate 33% of 1275 29% of 1655
N 419 475
Average Age* 57 49
Gender*
Male: 63%
Female: 36%
Male: 49%
Female: 51%
Years in Texas: All my life or
more than 10 years
89% 92%
8. Respondent Demographics: Sample and TX Pop.
2008 2014 TX
Live Inside City Limits 73% 73% 75 - 80%
Community Size > 25,000 69% 73% 75 – 80%
Completed High School 95%a 97%b 81%
9. Analysis
• Focuses on four questions related to water
availability, drought and climate change
• Examines likelihood of selecting a response
depending on before/after drought and
socio-demographic information
Chi-squared tests
Logistic / ordinal logistic regression (JMP
11.2.0)
9
14. 2008 2014
Increasing 52% 69%
Staying the same 38% 22%
Decreasing 2% 2%
No opinion 8% 7%
The likelihood of your area suffering from a
prolonged drought is:
15. The likelihood of your area having enough water
resources to meet all of its needs 10 years from now is:
High (likely enough
water)
Medium Low (likely not
enough water)
No opinion
20
41
30
87
32
53
8
2008 2014
16.
17. Do you think that the amount of rainfall in your area will
change as a result of global warming?
2008 2014
Yes, a significant increase in rainfall 6% 3%
Yes, a slight increase in rainfall 7% 3%
No, no change in rainfall 26% 18%
Yes, a slight decrease in rainfall 17% 17%
Yes, a significant decrease in rainfall 13% 26%
I don’t know 30% 34%
18. Conclusions
• From 2008 to 2014, the percentage of Texans replying
that water quantity is an issue in their area increased
from 47% to 61% (p < 0.0001).
• Similarly, the percentage of Texans believing that that
their area will experience prolonged drought increased
from 52% to 69% (p < 0.0001).
• Texans believe that there is only a low likelihood that
their areas will have enough water resources to meet
needs 10 years from now increased from 30% to 53%.
• Texans indicating that global warming will cause
significant decreases in rainfall increased from 13% to
26%; however, about a third still say, “Don’t Know.”
Set baseline data —to compare successes of future programs
12 stage question development process
16 states
Texas population grew 2.6 million from 2008 to 2014. Random addresses obtained from SSI in CT. Median age in Texas is 33, but that figure includes 0-17 and our sample excluded that group.
Large increase in the number of college graduates (more categories in detailed analysis). Went from 40% to 60%. Possibly because of slight recession in Texas, more students completed college instead of going to work (there was also a reduction of the category of some college or vocational – and so maybe they were going ahead and completing). HS grads are 86% for US. Involved in farming and ranching essentially the same from 3.9% to 4.5%.
About 75 percent of Texans now live in cities of 50,000 people or more. An additional 5 percent live in communities of 2,500 people or more. That leaves about 3.8 million Texans living in rural areas, compared to 21.3 million Texas living in suburban or urban areas.
Most of our residential water use is for landscaping and it is estimated that usually half of that water is wasted, and so that area is where there is the most room for conservation improvement.
Ordinal logistic fit of likelihood of drought with community size, years lived in Texas, Gender, Age and Educational Attainment showed that Educational Attainment had the greatest effect and toward increased likelihood of drought (78% thought increasing in 2014 vs. 60% in 2008, significantly more). Note to me: look at Have you ever changed your mind . . . question.
In 2008, gender was the strongest predictor, with more men optimistic that there will be enough water in 10 years than were women (p<.0050, Likelihood Ratio). In 2014, the strongest predictors were residency where NONE of those currently engaged in farming thought chances were high that there would be enough water. Also, those with less or some high school were more likely to express no opinion on this topic in 2014 than in 2008 and so Educational Attainment was also a good predictor.
Population growth in many areas of Texas has been rapid. About 1,400 people move to Texas each day. Very large cities include Houston, Dallas-Fort Worth, San Antonio, and Austin. Population growth for state from Apr. 2010 to July, 2014 was 7.2%. Current population is 26.7 million.
Many Texans still don’t know what to think about climate change. Increase in the significant decrease in rainfall seems to have come from the No change in rainfall category.