Download to read offline


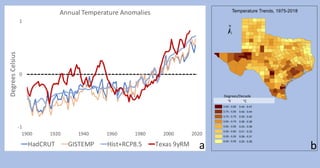
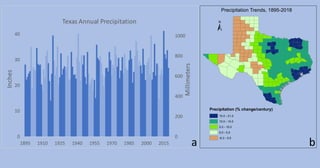
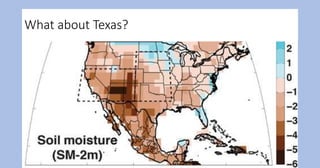
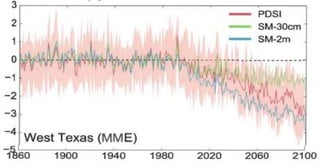
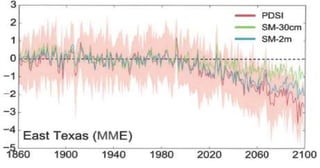
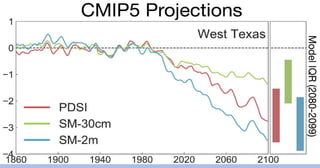
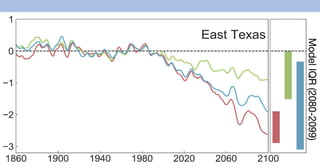
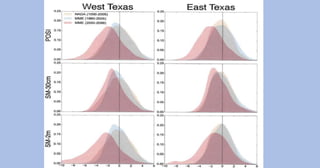
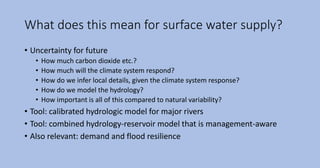
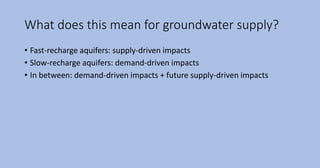
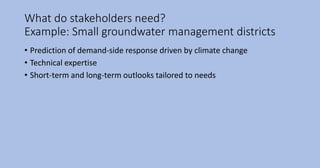
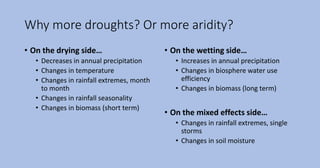
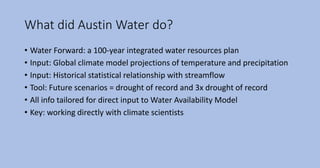
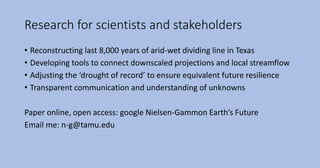

This document discusses the future of drought in Texas and its relationship to groundwater. It notes that climate change is likely to decrease annual precipitation and increase temperatures in Texas, exacerbating drought conditions. This could negatively impact both surface water supply from rivers and groundwater supply. The document outlines work being done with stakeholders like water districts to help them prepare for potential impacts on water demand and supply. It also discusses efforts to provide regional climate projections and tools to help water managers assess how climate change may affect their local resources.


