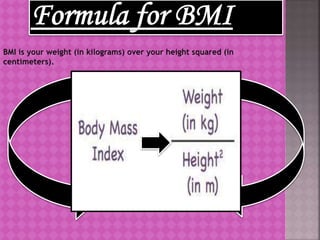
Body Mass Index is the latest tool to
assess the amount of body fatness in a
person.
It is a calculation using a person’s height
and weight
Health professionals use BMI to
determine if one is underweight ,a
healthy weight ,overweight or obese.
BMI can provide an indication of weight
categories that could lead to future
health problems.
BMI levels are interpreted differently for
adults and children so different BMI
calculators are used.
The body mass index (BMI), or Quetelet index,
is a value derived from the mass (weight) and
height of an individual.
The BMI is defined as the body mass divided by
the square of the body height, and is universally
expressed in units of kg/m2, resulting from
weight in and height in
The BMI is an
attempt to quantify
the amount of
tissue mass in an
individual, and then
categorize that
person
as underweight, no
rmal weight,
overweight,
or obese based on
that value.
The BMI trait is
influenced by
both genetic and
non-genetic
factors, and it
provides a
paradigm to
understand and
estimate the risk
factors for health
problems.
BMI provides a simple
numeric measure of a
person's thickness or t
hinness, allowing
health professionals to
discuss weight
problems more
objectively with their
patients. BMI was
designed to be used as
a simple means of
classifying average
sedentary populations,
with an average body
composition
PHOTO PERSON HEIGHT
[IN
meters]
WEIGH
T [in
KG]
WEIGHT/
HEIGHT2
BMI Weight status
VISHAL 1.75 42 42/(1.75)2 3.71 underweight
LAKSHAY 1.80 50 50/(1.80)2 15.43 underweight
SHUBHAM 1.60 35 35/(1.60)2 13.67 Underweight
PRAYAG 1.56 60 60/(1.56)2 24.65 overweight
SHYAM 1.65 40 40/(1.65)2 14.69 underweight
YATIN 1.85 70 70/(1.85)2 20.45 normal
RISHAB 1.90 90 90/(1.90)2 24.93 Overweight
JATIN 1.50 35 35/(1.50)2 15.55 underweight
ARYAN 1.70 45 45/(1.70)2 15.57 underweight
SAHIL 1.95 85 85/(1.95)2 22.35 normal
PHOTO PERSON HEIGHT
[IN
meters]
WEIGH
T [in
KG]
WEIGHT/
HEIGHT2
BMI Weight status
PHOTO PERSON HEIGHT
[in M]
WEIGHT
[in KGs]
WEIGHT/
(HEIGHT)2
BMI WEIGHT
STATUS
PRIYA 1.75 80 80/(1.75)2 26.12 OVERWEIGHT
TANYA 1.45 50 50/(1.45)2 23.78 NORMAL
SEEMA 1.85 43 43/(1.85)2 12.56 UNDERWEIGHT
SNEHA 1.50 32 32/(1.50)2 14.22 UNDERWEIGHT
MEHAK 1.55 90 90/(1.55)2 37.46 OBESE
PHOTO PERSON HEIGHT
[in
meters]
WEIGHT
[in
kilograms]
WEIGHT/
(HEIGHT)2
BMI WEIGHT
STATUS
MUSKAN 1.40 75 75/(1.40)2 38.26 OBESE
ALINA 1.70 62 62/(1.70)2 21.45 NORMAL
PALAK 1.53 40 40/(1.53)2 17.08 UNDERWEIGHT
MANSI 1.72 55 55/(1.72)2 18.59 NORMAL
PURVA 1.64 58 58/(1.64)2 21.56 NORMAL
Balancing calories in your food
Healthy eating for a healthy weight
Do physical activities to maintain your body mass
Do yoga and exercise
Go for a walk daily
Bmi
Bmi

Bmi

  • 2.
    Body Mass Indexis the latest tool to assess the amount of body fatness in a person. It is a calculation using a person’s height and weight Health professionals use BMI to determine if one is underweight ,a healthy weight ,overweight or obese. BMI can provide an indication of weight categories that could lead to future health problems. BMI levels are interpreted differently for adults and children so different BMI calculators are used.
  • 3.
    The body massindex (BMI), or Quetelet index, is a value derived from the mass (weight) and height of an individual. The BMI is defined as the body mass divided by the square of the body height, and is universally expressed in units of kg/m2, resulting from weight in and height in
  • 5.
    The BMI isan attempt to quantify the amount of tissue mass in an individual, and then categorize that person as underweight, no rmal weight, overweight, or obese based on that value. The BMI trait is influenced by both genetic and non-genetic factors, and it provides a paradigm to understand and estimate the risk factors for health problems. BMI provides a simple numeric measure of a person's thickness or t hinness, allowing health professionals to discuss weight problems more objectively with their patients. BMI was designed to be used as a simple means of classifying average sedentary populations, with an average body composition
  • 8.
    PHOTO PERSON HEIGHT [IN meters] WEIGH T[in KG] WEIGHT/ HEIGHT2 BMI Weight status VISHAL 1.75 42 42/(1.75)2 3.71 underweight LAKSHAY 1.80 50 50/(1.80)2 15.43 underweight SHUBHAM 1.60 35 35/(1.60)2 13.67 Underweight PRAYAG 1.56 60 60/(1.56)2 24.65 overweight SHYAM 1.65 40 40/(1.65)2 14.69 underweight
  • 9.
    YATIN 1.85 7070/(1.85)2 20.45 normal RISHAB 1.90 90 90/(1.90)2 24.93 Overweight JATIN 1.50 35 35/(1.50)2 15.55 underweight ARYAN 1.70 45 45/(1.70)2 15.57 underweight SAHIL 1.95 85 85/(1.95)2 22.35 normal PHOTO PERSON HEIGHT [IN meters] WEIGH T [in KG] WEIGHT/ HEIGHT2 BMI Weight status
  • 10.
    PHOTO PERSON HEIGHT [inM] WEIGHT [in KGs] WEIGHT/ (HEIGHT)2 BMI WEIGHT STATUS PRIYA 1.75 80 80/(1.75)2 26.12 OVERWEIGHT TANYA 1.45 50 50/(1.45)2 23.78 NORMAL SEEMA 1.85 43 43/(1.85)2 12.56 UNDERWEIGHT SNEHA 1.50 32 32/(1.50)2 14.22 UNDERWEIGHT MEHAK 1.55 90 90/(1.55)2 37.46 OBESE
  • 11.
    PHOTO PERSON HEIGHT [in meters] WEIGHT [in kilograms] WEIGHT/ (HEIGHT)2 BMIWEIGHT STATUS MUSKAN 1.40 75 75/(1.40)2 38.26 OBESE ALINA 1.70 62 62/(1.70)2 21.45 NORMAL PALAK 1.53 40 40/(1.53)2 17.08 UNDERWEIGHT MANSI 1.72 55 55/(1.72)2 18.59 NORMAL PURVA 1.64 58 58/(1.64)2 21.56 NORMAL
  • 12.
    Balancing calories inyour food Healthy eating for a healthy weight Do physical activities to maintain your body mass Do yoga and exercise Go for a walk daily