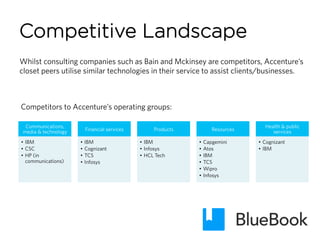
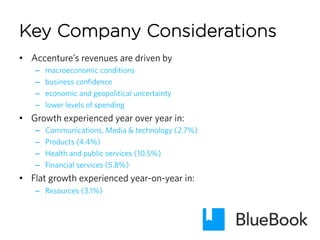
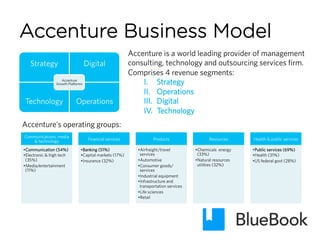
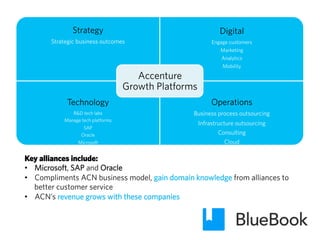
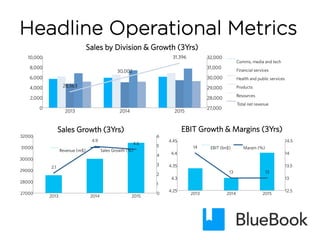
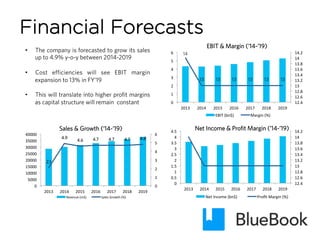
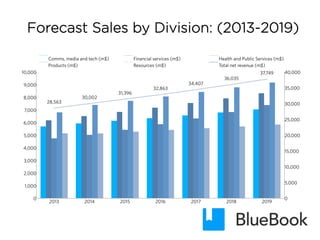
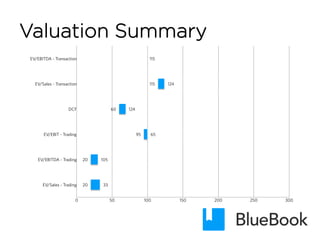
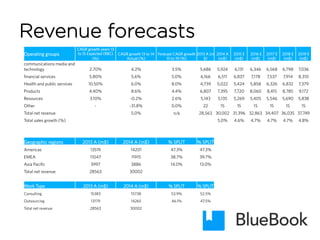
2. Table of Contents
• Executive Summary
• Industry Overview
• Company Considerations
– Share Price Performance
– Acquisition History
– Operating Performance
– Valuation
• Trade Idea
• Appendix
3. Executive Summary
• This project considers why Accenture (NYSE:ACN) is a valuable global brand from an investors point of view
• ACN is a global provider of consulting, technology and outsourcing services with operations in the Americas (47%),
EMEA (40%) and APAC (13%)
• ACN has experienced positive revenue growth in past years and is forecasted to continue this trend annually, due to
the following business initiatives:
– Outsourcing business witnessing higher growth in contrast to declines in its consulting arm
– SMAC stack (social media, big data analytics, cloud)
• Pressure for financial institutions to automate services
– Acquisitions (increasing domain knowledge)
– Revenue increases alongside alliances (SAP, Oracle, Microsoft)
– Trend in cost saving initiatives have increased demand for ACN outsourcing services
• Healthcare shifting into IT outsourcing
• ACN has shown it is still very profitable even under adverse economic conditions/within a very competitive
environment:
– Strong US dollar, reducing ACN revenue (high translation risk for their international business).
– Trouble in Europe, reducing demand for their consulting businesses
• Based on our forecasts for (FY2015-19), applying discounted cash flow and comparable trading multiples
analyses of ACN’s closest competitors (IBM, Cognizant, HP, Infosys) we conclude the following:
– ACN’s $60 billion market valuation price tag is supported by its breadth of experience across industry
segments and diversified geographic footprint
– Based on assumed 9.7% WACC and 3% terminal growth, our intrinsic value for ACN shares is $76.1 as
compared to the $89.9 stock market price as at 12 January 2015
5. -6
-4
-2
0
2
4
1Q07 4Q07 3Q08 2Q09 1Q10 4Q10 3Q11 2Q12 1Q13
EU GDP growth (%)
EU GDP growth (%)
-8
-6
-4
-2
0
2
4
6
8
10
12
2008 2009 2010 2011 2012 2013
Asia Pacific GDP growth (%)
India GDP growth (%)
China GDP growth (%)
Australia GDP growth (%)
JapanGDP growth (%)-8
-6
-4
-2
0
2
4
6
US GDP growth (%)
US GDP growth (%)
Macroeconomic story
• US economy showing signs of improvement- key
growth areas in financial and health care
• EU shows a slowly declining GDP growth rate
• APAC expected to grow at CAGR 2.3% through
to 2015- growing demand in IT services.
6. Mixed global picture at
corporate level
• The US -showing rising corporate profits,
declining unemployment rates and
stabilizing manufacturing indices.
• Expecting a continuation of growth in the
US.
• Europe still carries an uncertain climate,
with flat to rising unemployment and
declining manufacturing/consumer
confidence.
• APAC sees growth in the demand for IT
services and further need of effective
business operations. There is further
investment in Cloud, mobility, social
media and analytics.
0
500
1000
1500
2000
2500
1Q07 4Q07 3Q08 2Q09 1Q10 4Q10 3Q11 2Q12 1Q13
US corporation profits $bn
-40
-30
-20
-10
0
Jan-08 Jan-09 Jan-10 Jan-11 Jan-12 Jan-13
Change in EU consumer
confidence
Change in EU
consumer
confidence
7. Competitive Landscape
Communications,
media & technology
• IBM
• CSC
• HP (in
communications)
Financial services
• IBM
• Cognizant
• TCS
• Infosys
Products
• IBM
• Infosys
• HCL Tech
Resources
• Capgemini
• Atos
• IBM
• TCS
• Wipro
• Infosys
Health & public
services
• Cognizant
• IBM
Competitors to Accenture’s operating groups:
Whilst consulting companies such as Bain and Mckinsey are competitors, Accenture’s
closet peers utilise similar technologies in their service to assist clients/businesses.
9. Key Company Considerations
• Accenture’s revenues are driven by
– macroeconomic conditions
– business confidence
– economic and geopolitical uncertainty
– lower levels of spending
• Growth experienced year over year in:
– Communications, Media & technology (2.7%)
– Products (4.4%)
– Health and public services (10.5%)
– Financial services (5.8%)
• Flat growth experienced year-on-year in:
– Resources (3.1%)
10. Key Company Considerations
• Revenue growth was strong in Outsourcing and modest in
consulting.
– Clients want more outsourcing services with an emphasis on cost savings
initiatives
• A weak USD is favourable for Accenture and a strong US dollar is
considered unfavourable – exposure to high translation risk for
international business
• During fourth quarter fiscal year 2014 - US dollar weakened
against other currency which was favourable for Accenture’s P&L.
11. Accenture Business Model
Strategy Digital
Technology Operations
Accenture
Growth Platforms
Communications, media
& technology
• Communication (54%)
• Electronic & high tech
(35%)
• Media/entertainment
(11%)
Financial services
• Banking (51%)
• Capital markets (17%)
• Insurance (32%)
Products
• Airfreight/travel
services
• Automotive
• Consumer goods/
services
• Industrial equipment
• Infrastructure and
transportation services
• Life sciences
• Retail
Resources
• Chemicals energy
(33%)
• Natural resources
utilities (32%)
Health & public services
• Public services (69%)
• Health (31%)
• US federal govt (28%)
Accenture is a world leading provider of management
consulting, technology and outsourcing services firm.
Comprises 4 revenue segments:
I. Strategy
II. Operations
III. Digital
IV. Technology
Accenture’s operating groups:
12. Strategy
Strategic business outcomes
Digital
Engage customers
Marketing
Analytics
Mobility
Technology
R&D tech labs
Manage tech platforms
SAP
Oracle
Microsoft
Operations
Business process outsourcing
Infrastructure outsourcing
Consulting
Cloud
Accenture
Growth Platforms
Key alliances include:
• Microsoft, SAP and Oracle
• Compliments ACN business model, gain domain knowledge from alliances to
better customer service
• ACN’s revenue grows with these companies
13. How
Accenture
uses tech to
help clients?
SMAC
stack-:Social
media, Mobility,
Big data analysts,
Cloud
ACN offer tech
expertise: to help
businesses run
efficiently/more
effectively/reduce
costs
Help companies
achieve
strategic
objectives
ACN interactive: closer
interaction with
customers, marketing
software (ACN digital
diagnostics), improves
company’s website
ACN customer
insight solution:
help business focus
their marketing
strategy
Manage
company’s tech
platforms
Implement tech:
Microsoft,
Oracle, SAP
19. Acquisition History
• Accenture have acquired five IT consulting services companies over the past 12 months
M&A Transaction History
Announced Date Target Description
February 03, 2014 ClientHouse GmbH IT Consulting & Services
Merger/Acquisition
March 03, 2014 Evopro IT Consulting & Services
Merger/Acquisition
May 15, 2014 i4C Analytics Srl IT Consulting & Services
Merger/Acquisition
June 09, 2014 PureApps Ltd IT Consulting & Services
Merger/Acquisition
June 10, 2014 Enkitec LP IT Consulting & Services
Merger/Acquisition
21. Valuation Commentary (1)
• Key financial assumptions used in discounted cash flow analysis:
– WACC=9.7%
– Terminal growth rate= 3.0%
– Tax rate= 26%
Valuation drivers by division:
• Communications, media & technology:
– expect an increase in CAGR growth through to 2019. ACN have using the SMAC stack ($200bn market). RBC expects it to
grow with a CAGR of 15% through to 2017.
• Resources:
– decrease in CAGR. IT spending in this industry, only expected to increase from $332bn to $369bn (2013 to 2017).
• Financial services:
– expecting an increase in CAGR, IT outsourcing is increasing, pressure for financial institutions to automate services
• Health & public services:
– major CAGR increase promoted by RBC for 2015 by 10.5%. Healthcare institutions are moving into IT outsourcing, CAGR will
lower eventually after initial peak.
• Products:
– uncertainty in the global economy caused revenue pressures/rising costs (triggered more outsourcing) resulting in a slight
increase in CAGR.
22. • Decrease in CAGR growth from the Americas:
– trend in the stronger US dollar adversely affect revenues for ACN
– Troubles in Europe have caused the consulting business to suffer
• CAGR growth for consulting reduced:
– consulting has troughed, however may pick up with the economy
– Outsourcing has increased, due to the trend in companies wanting
cost savings initiatives from ACN
Valuation Commentary (2)
23. Discounted Cash Flow Analysis
Financial Year (Dec. Year end) 31-Aug-14 31-Aug-15 31-Aug-16 31-Aug-17 31-Aug-18 31-Aug-19 Terminal Period
Total Turnover 32 33 35 37 38 40
growth (%) 4.6% 4.7% 4.7% 4.7% 4.8%
EBIT 4 4 5 5 5 5
margin (%) 13.5% 13.2% 13.2% 13.2% 13.2% 13.2%
Depreciation & Amortisation 0.6 0.6 0.4 0.4 0.4 0.4
Tax @ 26.1% (1.1) (1.1) (1.2) (1.3) (1.3) (1.4)
Capital Expenditure 0.3 0.3 0.3 0.4 0.4 0.4
Capex/Sales (%) -1.0% -1.0% -1.0% -1.0% -1.0% -1.0%
Change in Working Capital 0.0 (2.9) (0.1) (0.1) (0.1) (0.1)
Working Capital / Sales (%) 0.0% 8.7% 0.2% 0.2% 0.2% 0.2%
Free Cash Flow 3 1 3 3 4 4 4
Discount Factor 0.91 0.83 0.76 0.69 0.63 0.63
Terminal Value 59
Present Value 0.6 2.8 2.6 2.5 2.4 37
Enterprise Value 48
Net Debt as at (August 2014) -4.897174
Market Capitalisation ($bn) 53
No. Shares (m) 0.692
Share Price ($) 76.1