Download as PDF, PPTX


![Social
Mobile Video
$40
$30
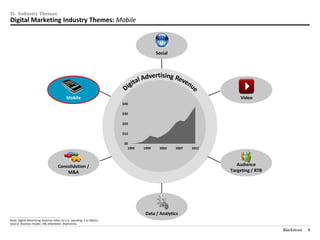
II. Industry Themes
$20
$10
$0
1995 1999 2003 2007 2012
Audience
Consolidation Targeting /
/ M&A RTB
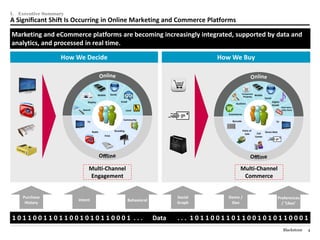
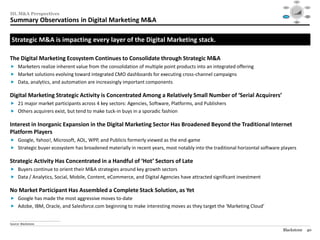
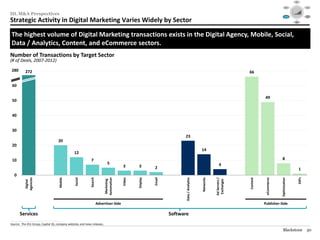
A Huge Opportunity, One that Online Video Is Ideally-Suited to Target, Exists in Display & Brand Advertising Data /
Analytics
A significant gap exists between the relative share of online and offline branding, implying a $13.0bn
untapped market opportunity in the U.S. alone.
U.S. Market Opportunity (2011) Online Becoming ‘The New Primetime’
($ in billions)
70
Prime Time
% People 15+ Using Medium
$152.0bn $31.0bn
100% 60
Direct Direct 50
(1) (1)
Response Response 40
TV
($27.0bn, 18%) ($19.0bn, 61%) 30
75% 20
10 Internet
Implied
0
Gap Midnight 2 AM 4 AM 6 AM 8 AM 10 AM 12 PM 2 PM 4 PM 6 PM 8 PM 10 PM
($13.0bn, 43%)
50% Harder to Reach Audiences in the New Media Model
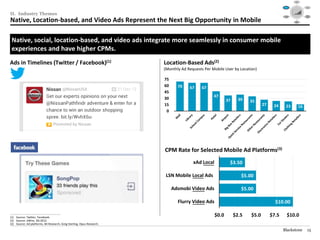
ADS TARGET AUDIENCE MEDIA
(2)
Branding
Traditional
Fewer ads… Reached more people… With undivided attention.
Media
($125.0bn, 82%)
25% (2)
Branding (2)
Branding
($12.0bn, 39%)
[__]
More ads… Reaching fewer people… Paying less attention.
New Media
0%
U.S. Offline U.S. Online
Media Spend Media Spend
________________________________________________
Source: IAB, Wall Street research, comScore, Blackstone.
(1) Offline DR includes direct mail and directories. Online DR includes classifieds, e-mail, lead generation, and search.
(2) Offline Branding includes outdoor, print, radio, and TV. Online Branding includes banner ads, rich media, sponsorships, and video.
Blackstone 23](https://image.slidesharecdn.com/blackstonedigitalmarketingreview-130129132533-phpapp01/85/Blackstone-2013-Digital-Marketing-Review-24-320.jpg)
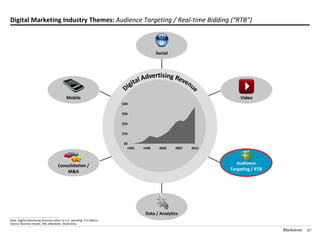
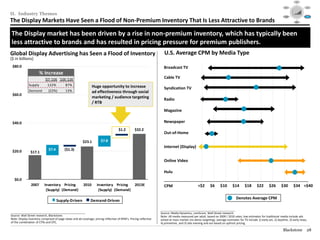
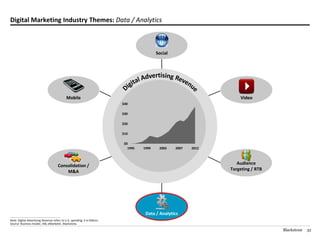
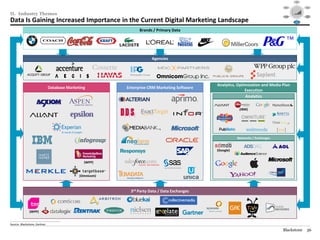
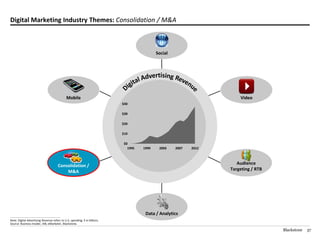
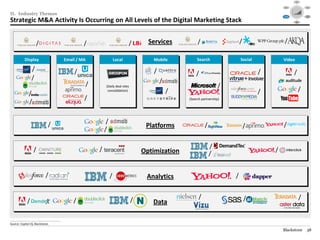

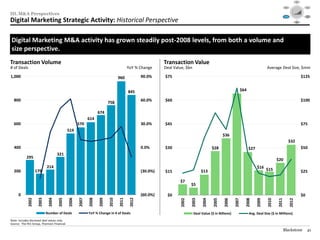


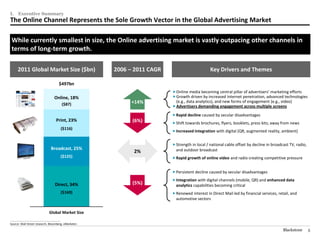
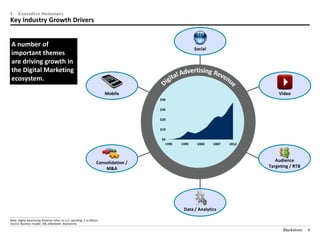
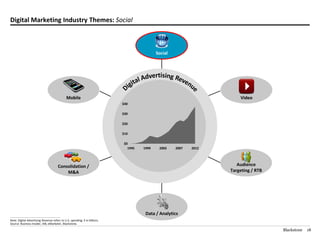
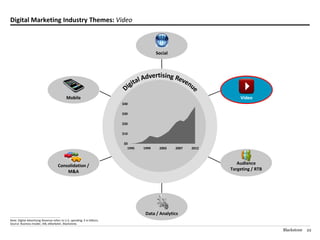
The digital marketing industry is undergoing significant transformation as it shifts from analog to digital. Growth is being driven by mobile, social, video, audience targeting, and data/analytics capabilities. This has catalyzed consolidation as leading acquirers seek these capabilities through M&A to build unified, multi-channel offerings fueled by data. Consolidation and M&A will continue to define the evolving digital marketing ecosystem.


