Download to read offline

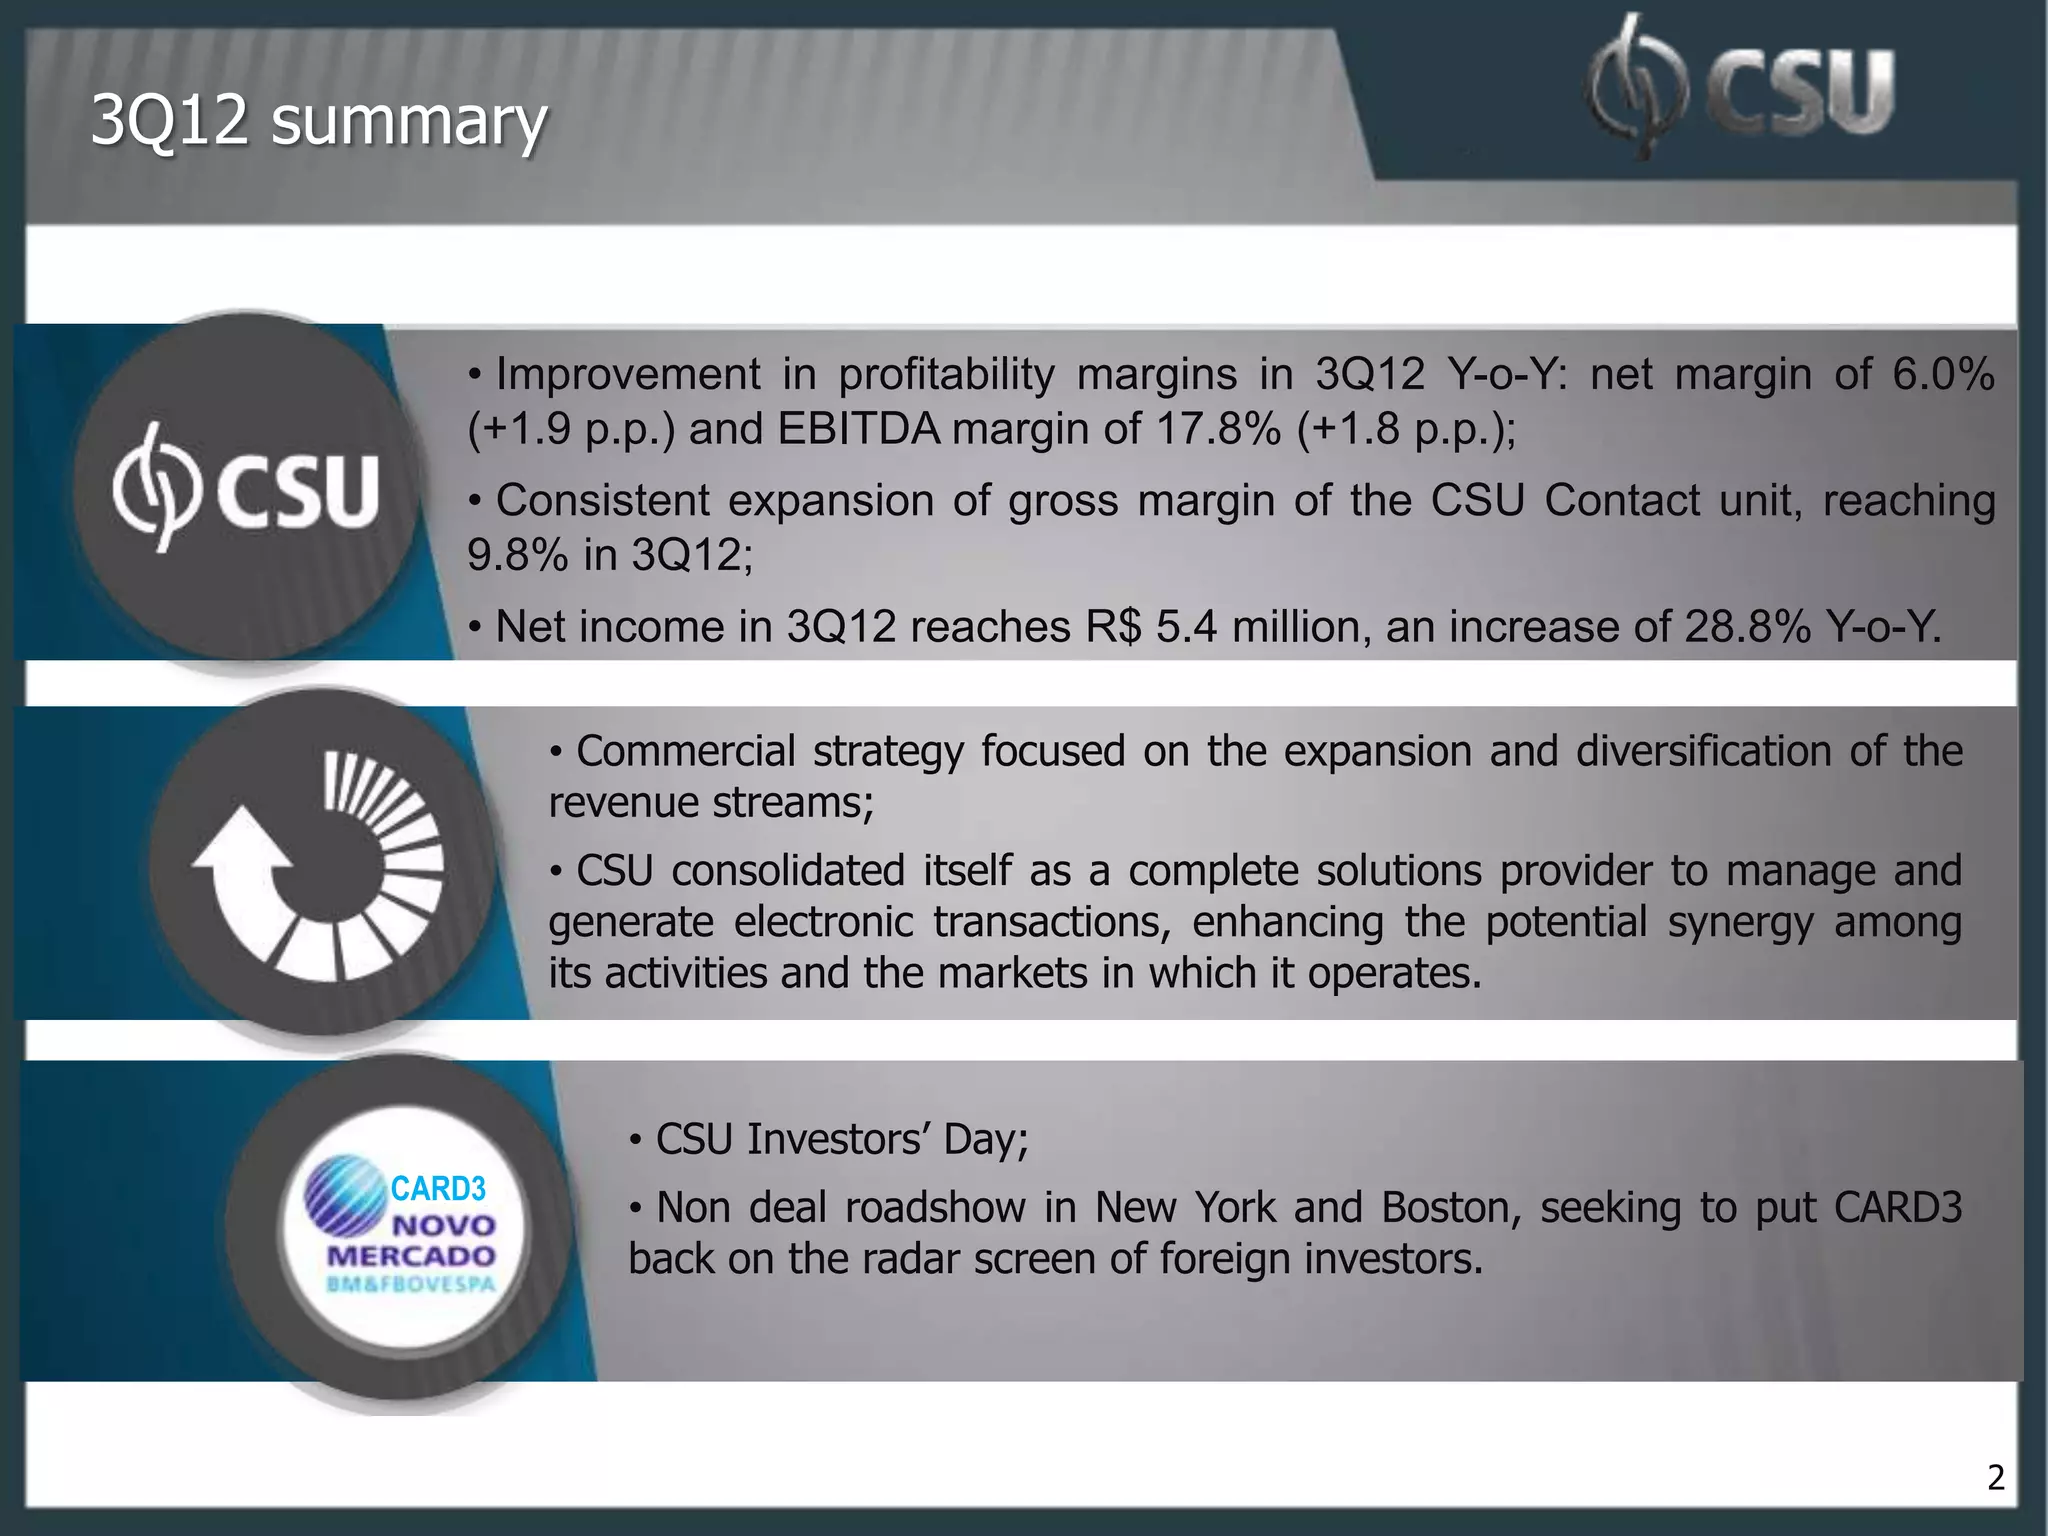
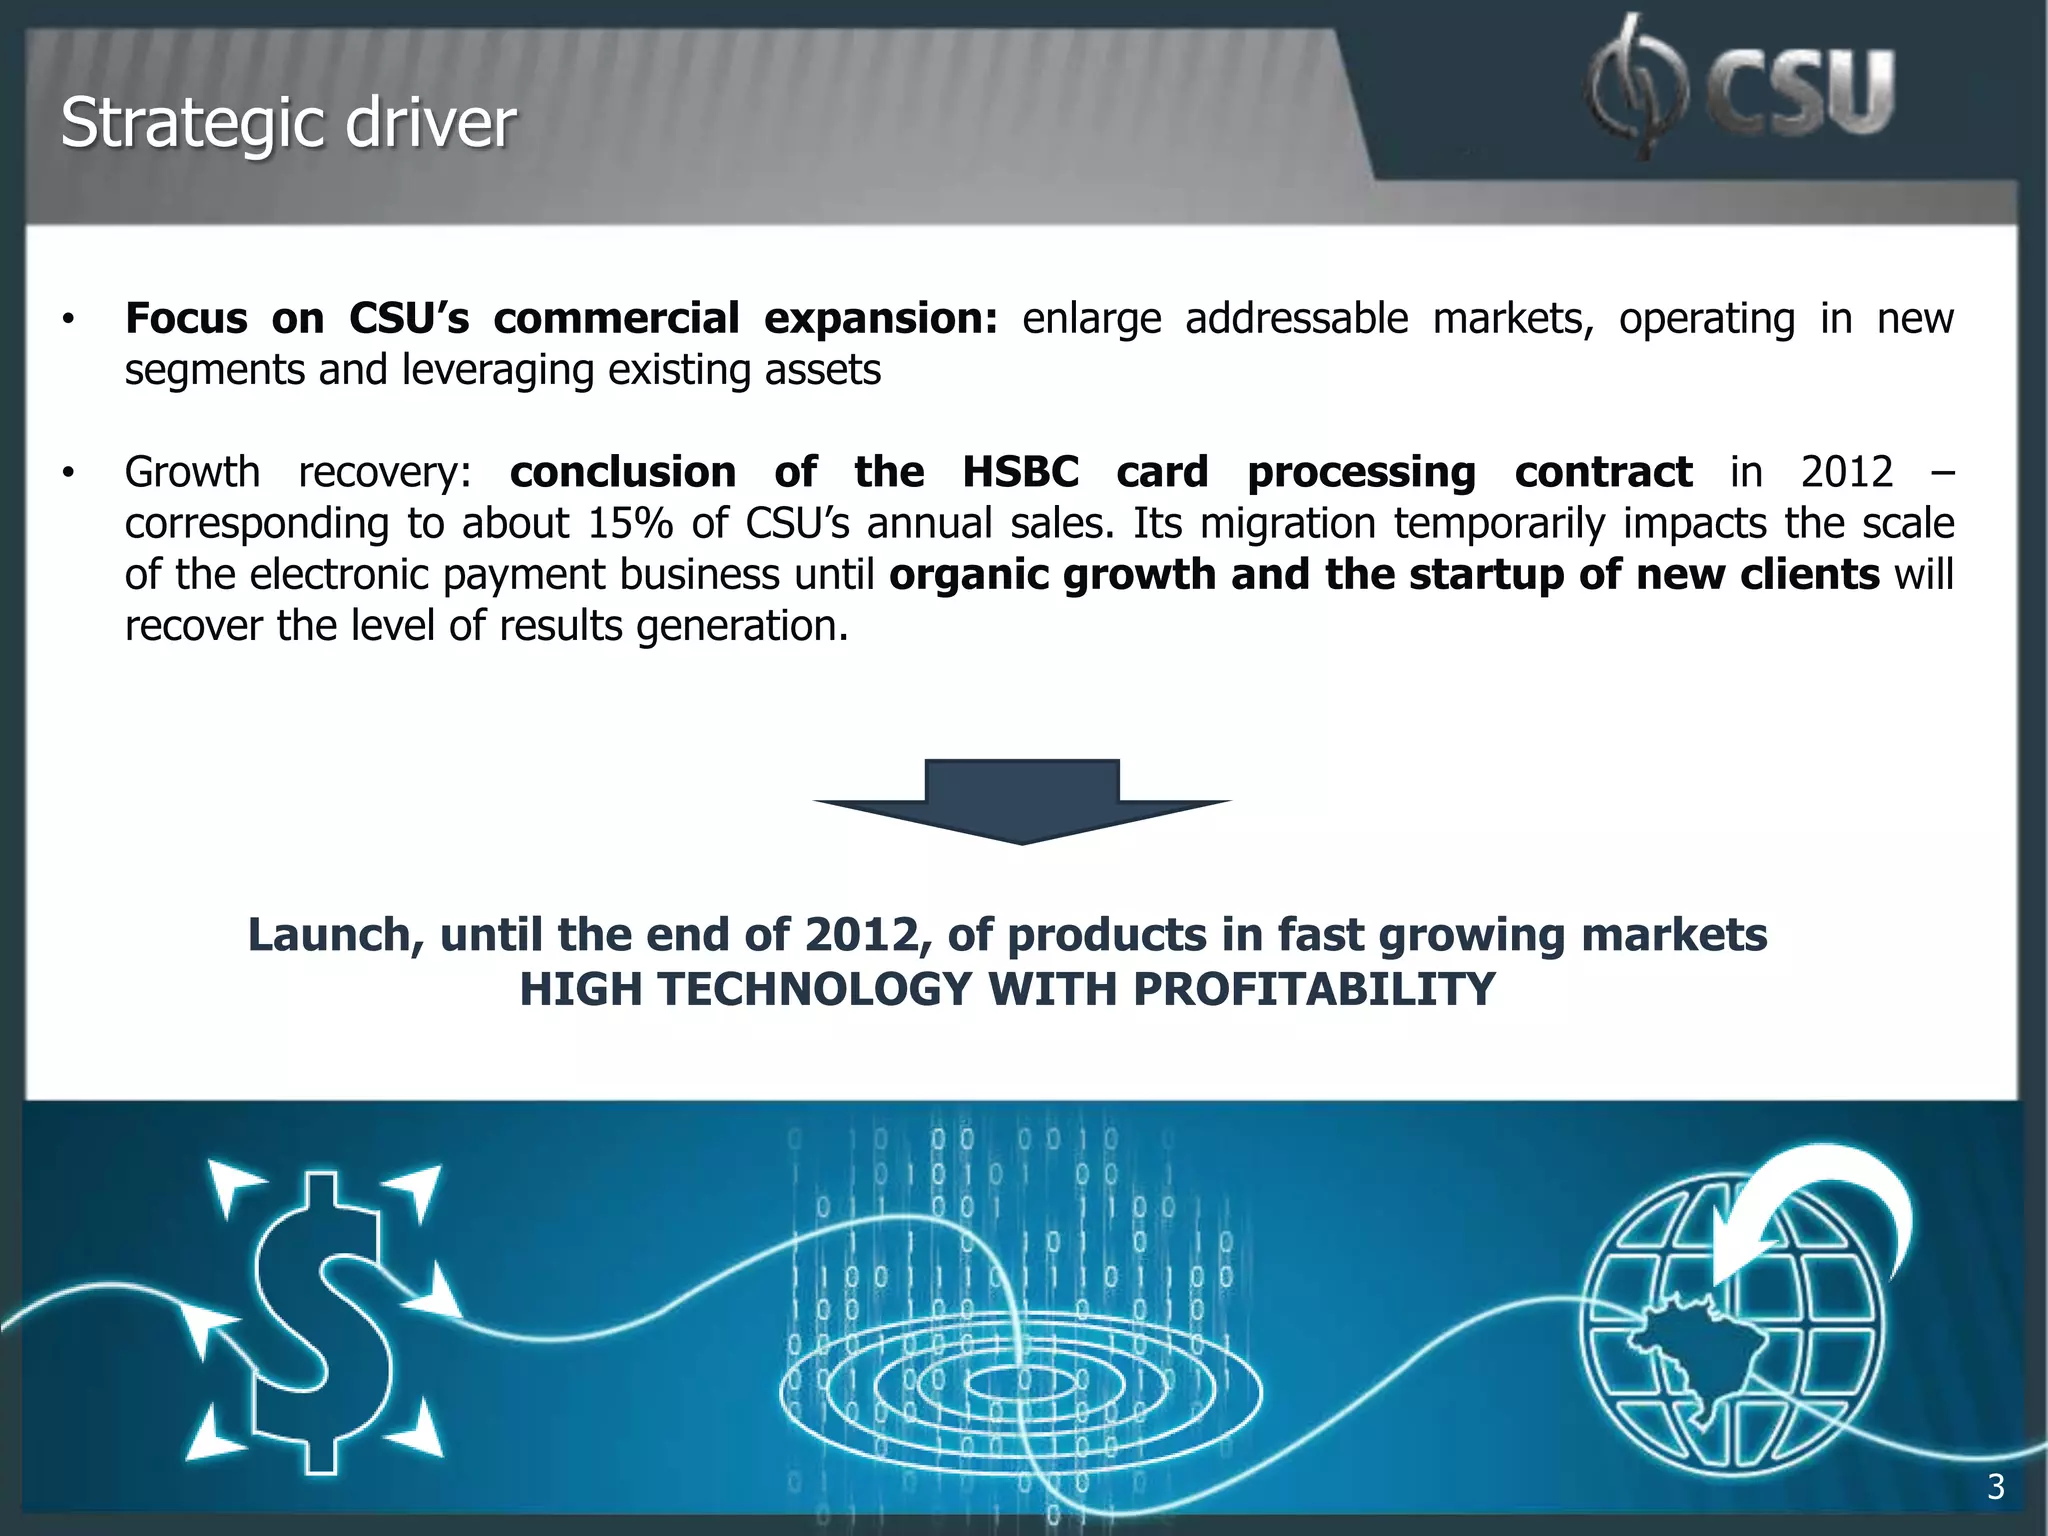
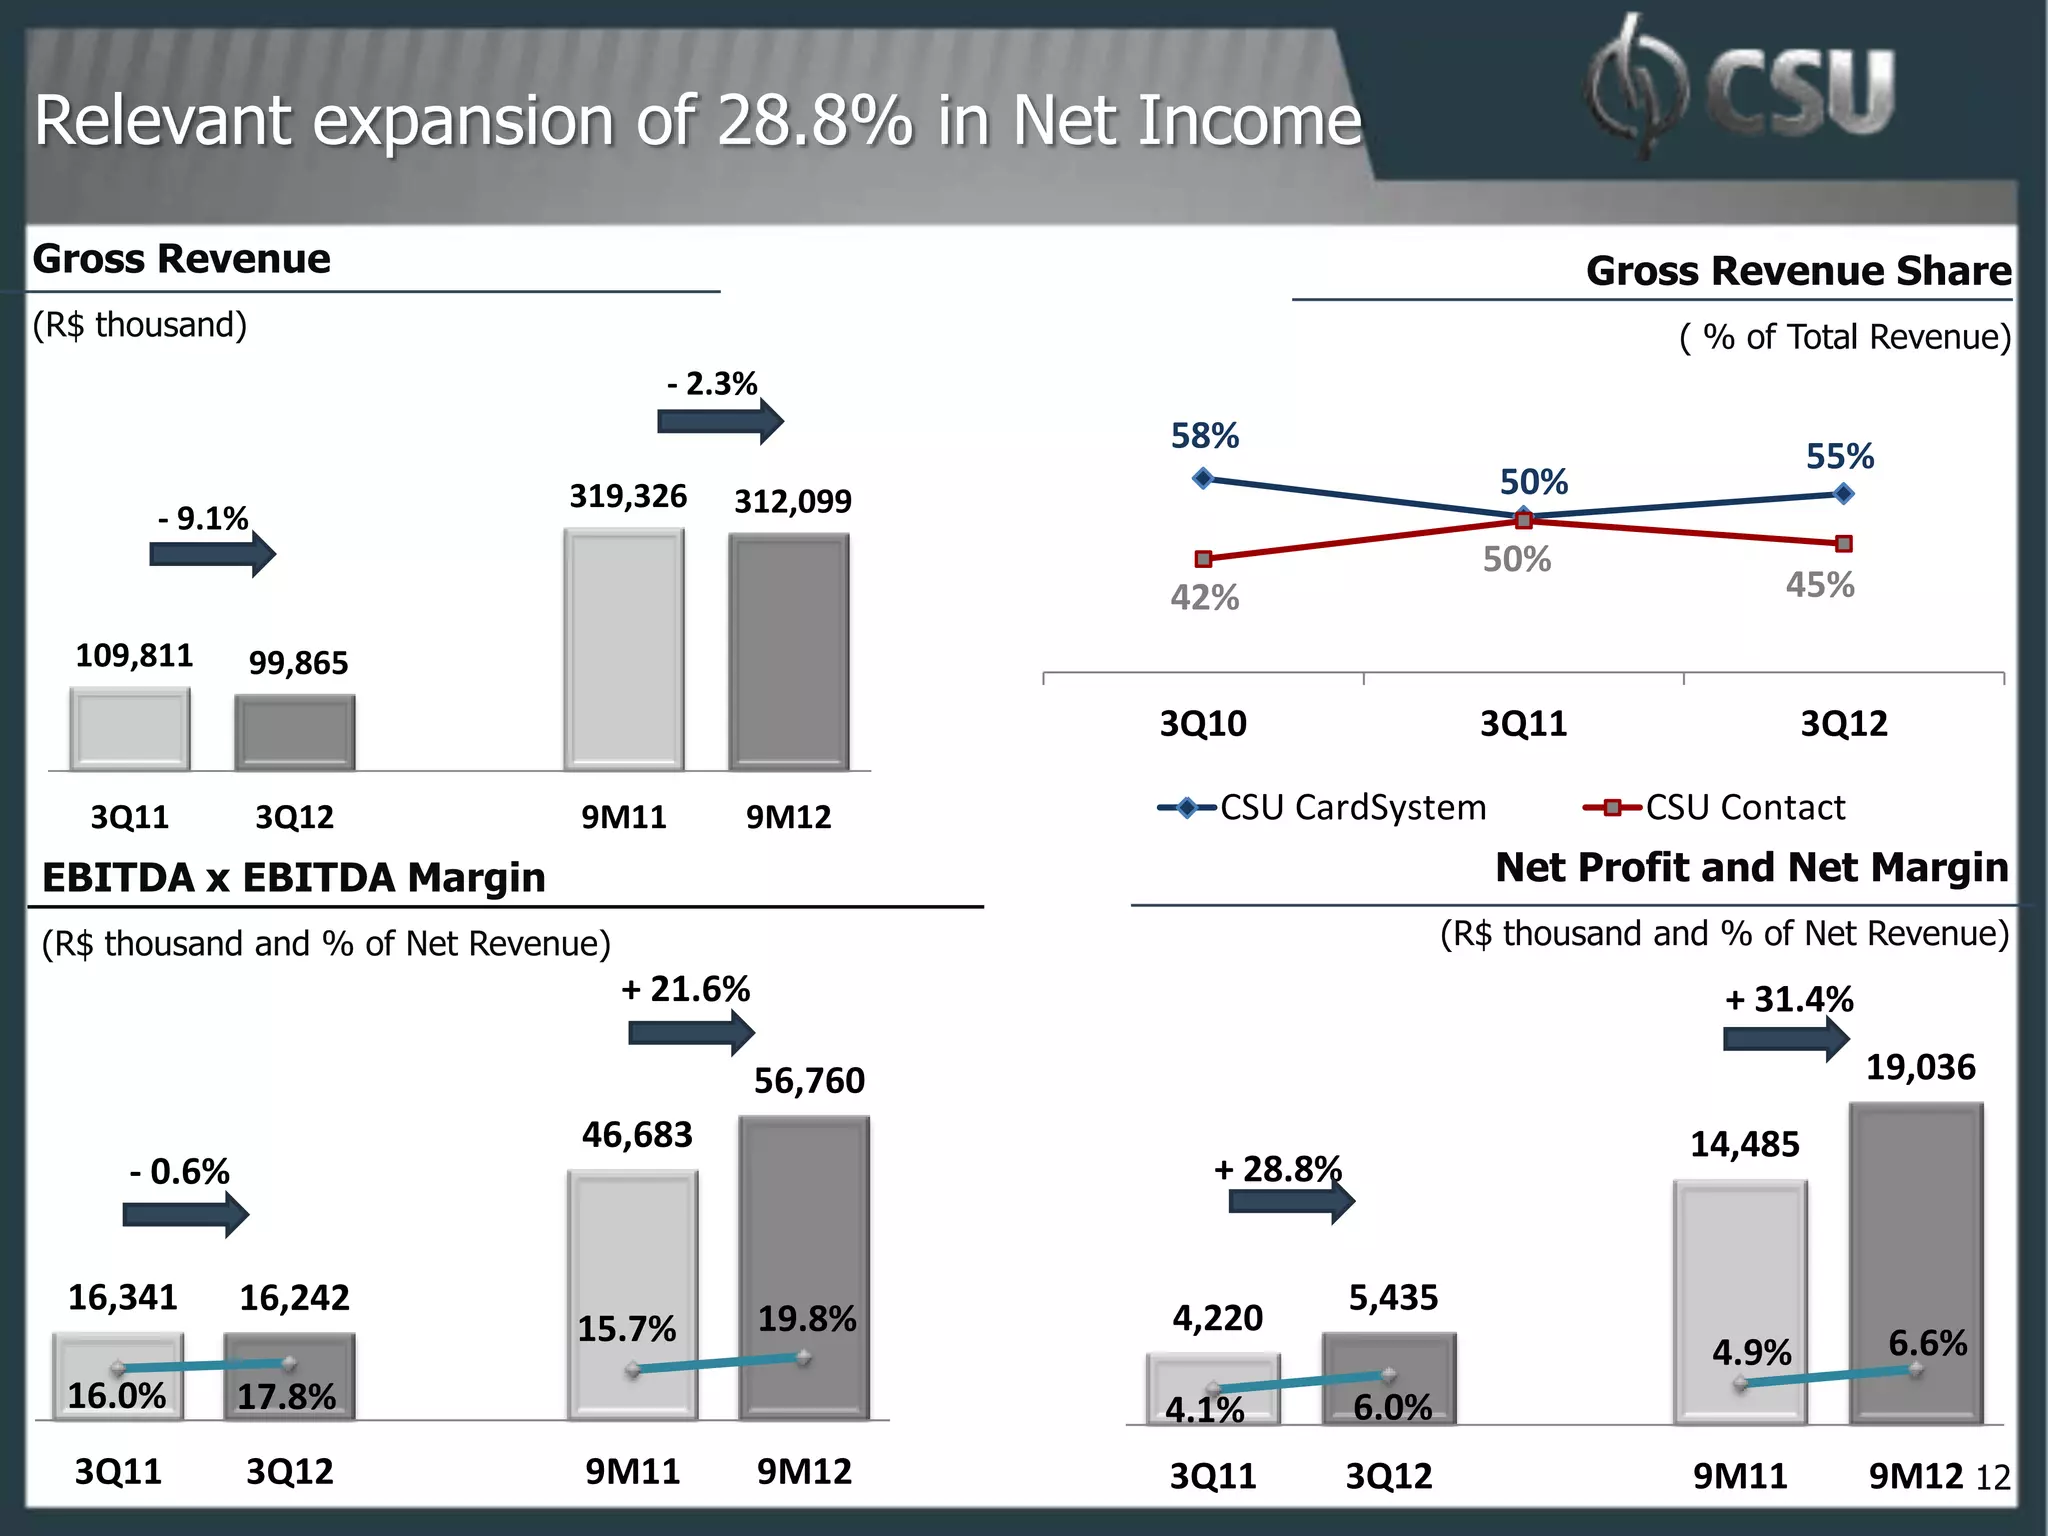
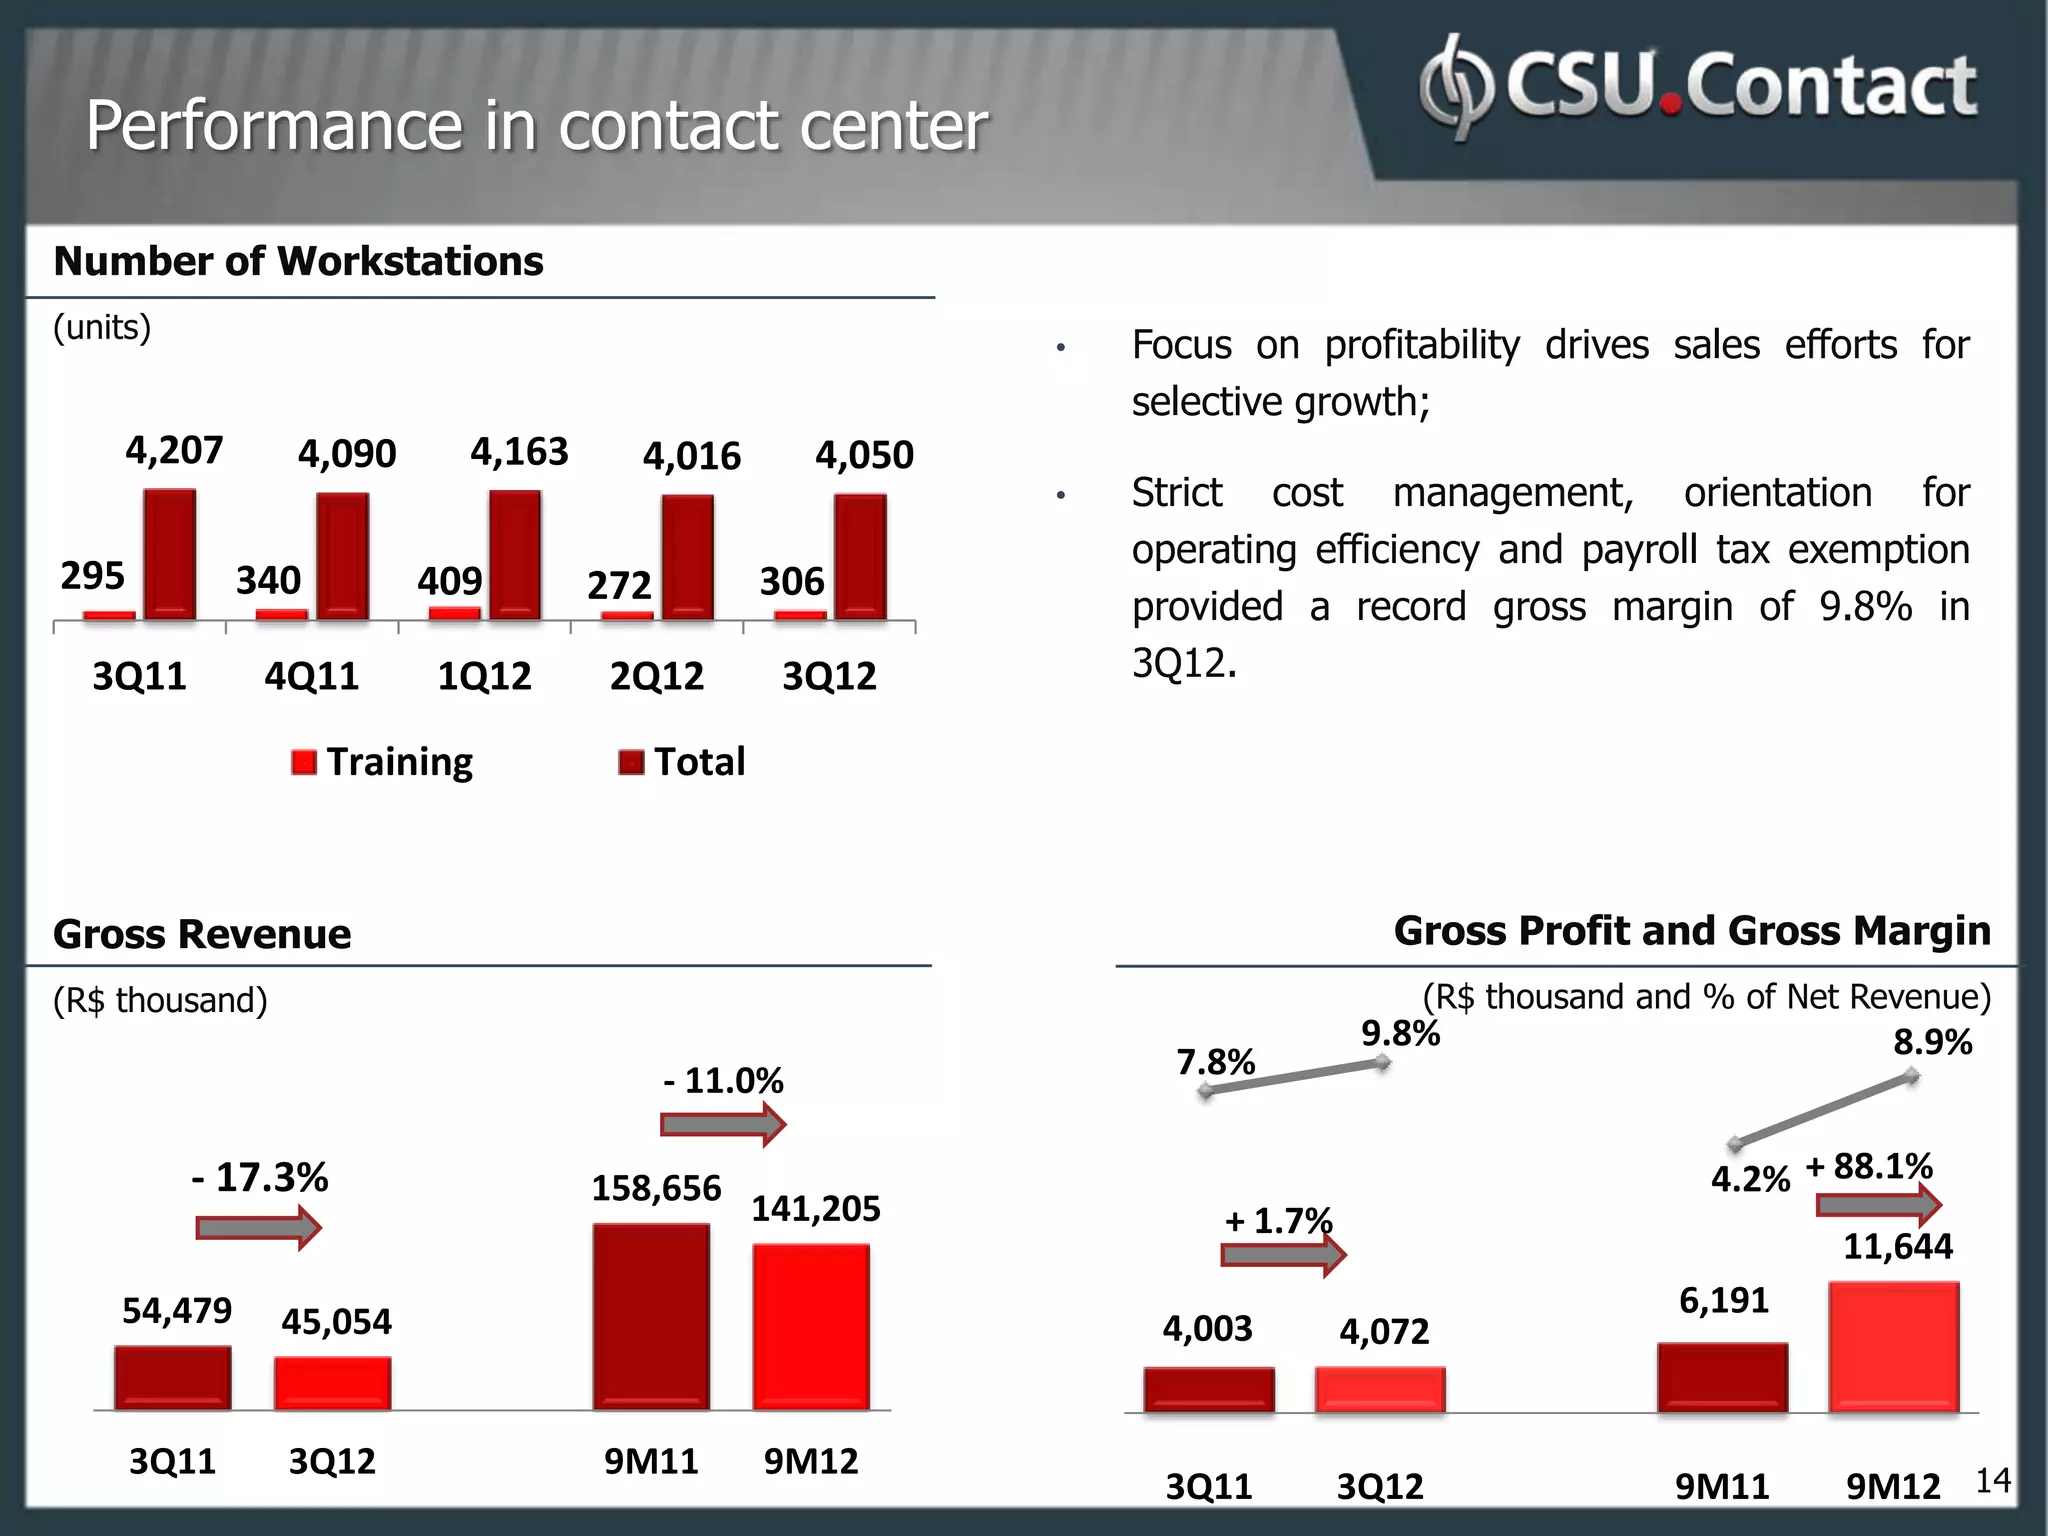
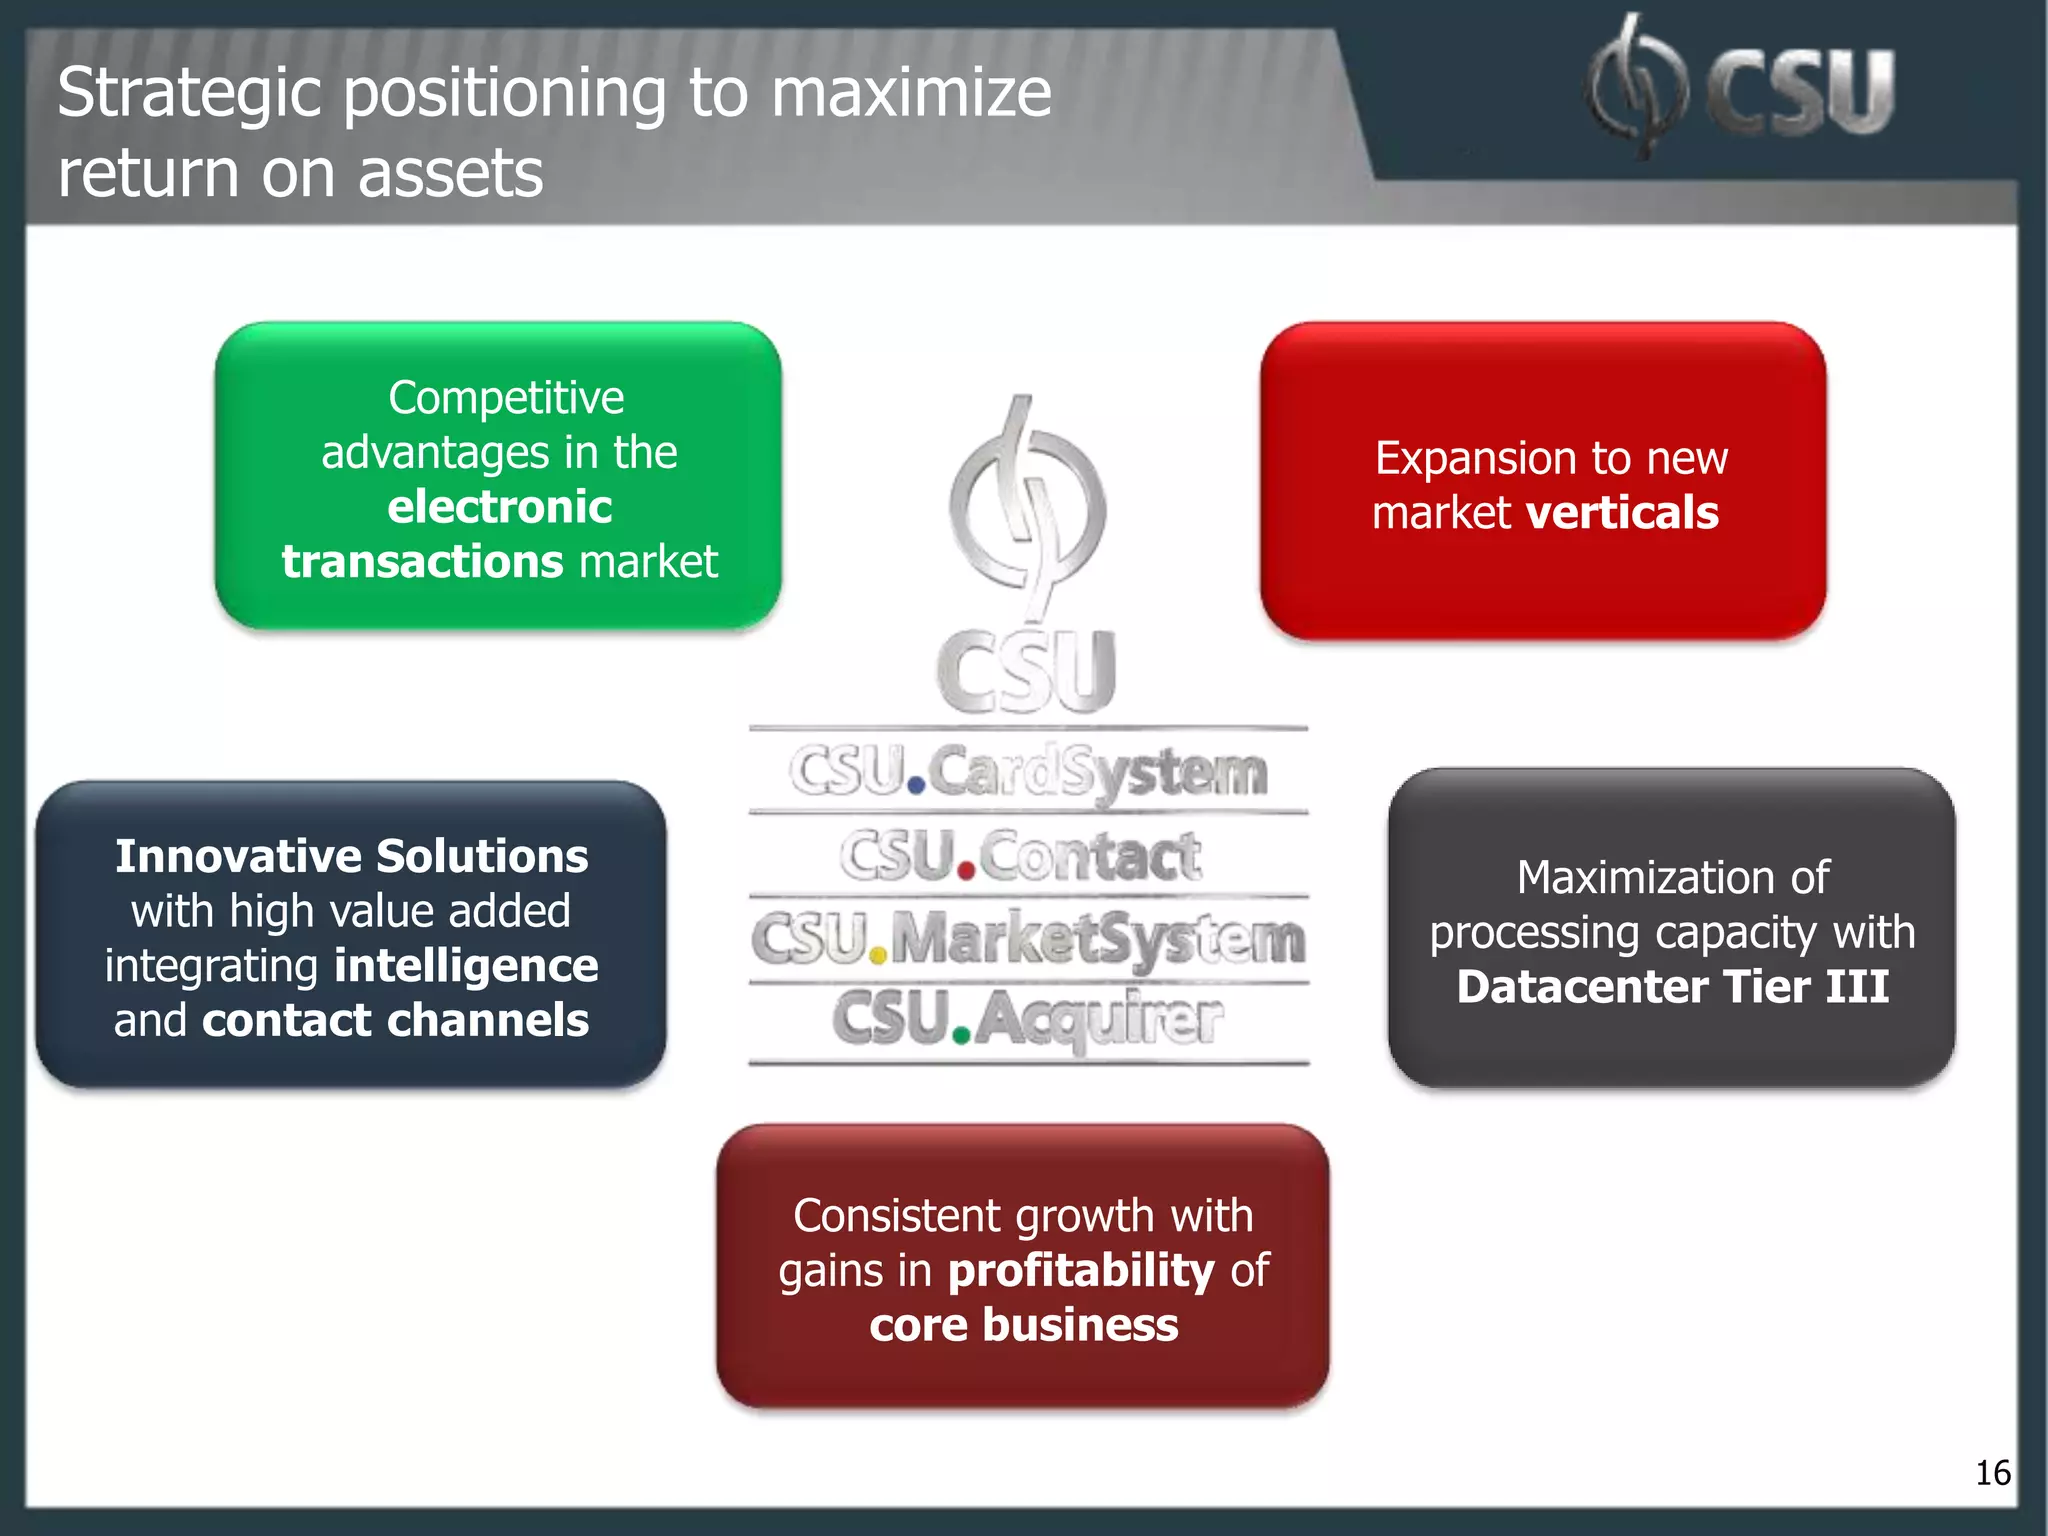

- CSU improved profitability in 3Q12 with net margin of 6.0% and EBITDA margin of 17.8% - CSU is focusing on commercial expansion to leverage existing assets and enter new markets and segments - CSU aims to launch new high-technology products with profitability by the end of 2012 to drive growth


![Channel Success: Is Your Organization Ready? [Global Channel Partners Summit]](https://cdn.slidesharecdn.com/ss_thumbnails/no-6channelsgraphpresov5-121012143148-phpapp02-thumbnail.jpg?width=640&height=640&fit=bounds)


