The document describes a test procedure to determine the asphalt content of asphalt-aggregate mixtures using a centrifuge extraction method. The test involves extracting the asphalt from a sample using solvents and centrifugation, then drying and weighing the extracted aggregate. The asphalt content is calculated based on the weights of the original mixture and dried aggregate. Corrections are made for moisture content and any errors in the extraction process.
The document discusses blending aggregate stockpiles to achieve desirable gradations for concrete. It describes how to plot individual aggregate gradations, identify critical sieves, and estimate initial trial proportions through the numerical blending method. This involves calculating blended percentages passing each sieve based on the proportions of each aggregate used. The process is iterative, adjusting proportions to get closer to specification targets using a trial and error approach. The combined specific gravity of the blended aggregate can also be calculated from the proportions of the individual stockpiles.
This document provides the procedure for determining the plastic limit of a soil sample. It describes preparing a soil sample that has been passed through a 425 micron sieve. The plastic limit is determined by rolling threads of the soil into 3 mm diameters and finding the minimum water content at which it will just begin to crumble. The given soil sample had a plastic limit of 22% and a plasticity index of 16% based on calculations provided. The conclusions state that since the plastic limit is less than 25%, the soil can be used as a fill material according to MoRTH specifications.
The subbase/base thickness of pavement is governed by the CBR value of the subgrade soil along with some other parameters such as traffic intensity, climatic conditions, etc. Dynamic cone penetration test (DCPT) value conducted in the field can be used to estimate the CBR value provided a suitable relationship exists between CBR and DCPT value.
Mix design practice (bituminous mix) ce 463abhay mishra
The document discusses various methods for designing bituminous mixes, including the Marshall, Hveem, and Modified Hubbard-Field methods. The objective of bituminous mix design is to determine an optimal blend of aggregates and bitumen that provides sufficient bitumen for durability while maintaining stability, voids, and other properties to meet traffic and weather demands. Key steps involve preparing trial mixtures, testing stability and voids, and analyzing results to select the design bitumen content.
A sample lab report on Marshall method of mix design for bituminous mixtures with all calculations.
Please request with your mail ID if you want to download this document.
Design mix method of bitumenous materials by Marshall stability methodAmardeep Singh
4.25
4.5
4.75
5
5.25
5.5
Bitumen %
1) The Marshall stability test is used to determine the optimum asphalt content for a given mix design by evaluating stability, flow, density, voids, and voids filled with asphalt at different asphalt contents.
2) Specimens are compacted in molds and tested at 60°C after being submerged in a water bath for 30-40 minutes.
3) Graphs of stability, density, and voids vs. asphalt content are used to identify the optimum asphalt content, which
This document provides information on aggregates used in traditional building materials. It defines aggregates as fillers used with binding materials that are derived from rocks. Aggregates make up 70-80% of concrete's volume and influence its properties. Aggregates are broadly classified into fine aggregates smaller than 4.75mm and coarse aggregates larger than 4.75mm. The document discusses various types of coarse aggregates based on geological origin, size, shape, and unit weight. It also covers properties of aggregates like strength, shape, specific gravity, moisture content and tests conducted on aggregates. Alkali aggregate reaction and measures to prevent it are summarized.
Sieve Analysis of Fine & Coarse Aggregate | Jameel AcademyJameel Academy
This report summarizes the results of a sieve analysis test performed on samples of fine and coarse aggregates. Sieve analysis was used to determine the particle size distribution of each aggregate by separating particles via sieves with decreasing size openings. For the fine aggregate, the average size was found to be 0.6mm. For the coarse aggregate, the maximum size was found to be 13.2mm. While the calculations and procedures appeared to be performed correctly, the results did not fully meet specification limits, indicating the aggregates may not be suitable for the intended construction purpose without further processing or testing.
The report is being made on the experience of 3 weeks office training.
briefly describes the quality tests of Fine and Coarse aggregates .
Complete calculation of concrete mix design is included with solved numerical equations.
Cement, water and admixtures quality test is not performed because the contractor purchase it from other chemical and cement manufacturer company.
Normal Consistency of Hydraulic Cement | Jameel AcademyJameel Academy
This report summarizes a test to determine the normal consistency of hydraulic cement. Four trials were conducted with 500g of cement and varying water-cement (W/C) ratios of 0.25, 0.27, 0.30 and 0.33. These trials resulted in penetrations of 25mm, 9mm, 5mm and 4mm respectively. From the relationship between W/C ratio and penetration, the standard consistency was determined to be 0.2875 at a penetration of 6mm. However, the average penetration of 10.75mm exceeded the standard of 6±1mm, suggesting errors in the test such as insufficient cement quantity and inaccurate penetration measurement timing. The purpose of the test was to find
This document discusses the compressive strength of concrete. It defines compressive strength as the ability of a material to withstand pushing forces. Concrete is strong in compression but weak in tension. The document describes how to test the compressive strength of concrete cube and cylinder specimens. It provides details on specimen size, curing, loading rate, and calculating compressive strength based on applied load divided by cross-sectional area.
The document provides instructions for conducting pull-out tests to determine the compressive strength of concrete. It states that pull-out tests should be confirmed to BS 1881 Part 207 and give a direct tensile strength value. It describes how inserts can be cast into wet concrete or positioned in hardened concrete using an under-reamed groove. When testing, at least four pull-out tests should be performed at each location and a loading rate of 0.5 ± 0.2 kN/s should be used for 25mm diameter inserts. The compressive strength can then be calculated from the direct tensile strength value obtained during testing.
This document discusses the group index method for flexible pavement design. It begins by defining group index as a number from 0-20 assigned to soil based on physical properties like particle size, liquid limit, and plastic limit. Lower values indicate better soil quality. Group index is determined mathematically using a provided equation or graphically. Required data for design includes group index, traffic volume, and flexible pavement structure. Total thickness is selected from a chart based on group index and traffic volume. Thickness of sub-base is also from a chart based only on group index. Remaining thickness is allocated to base and surface courses. An example problem demonstrates calculating group index and designing pavement layers.
The document provides information on different types of bitumen and bitumen modification. It discusses natural bitumen, artificial bitumen including straight run bitumen and blown bitumen. It also describes cut back bitumen, emulsions, and modified bitumens including crumb rubber modified bitumen, natural rubber modified bitumen, and polymer modified bitumen. The document lists the advantages of modified bitumens and guidelines for their use. It provides details on consistency tests, performance tests, and grades of different modified bitumens.
This document describes a penetration test performed on bituminous materials to determine consistency. The test involves vertically penetrating samples of the material with a standard needle under controlled conditions and measuring the penetration distance. Bitumen is characterized based on penetration grades like 30/40 and 40/50, with higher values indicating softer consistency. The document outlines the test apparatus, sample preparation process, testing procedure, and results, noting a mean penetration value of 37.37mm for the tested sample.
The Marshall stability and flow test provides the performance prediction measure for the Marshall mix design method. The stability portion of the test measures the maximum load supported by the test specimen at a loading rate of 50.8 mm/minute. Load is applied to the specimen till failure, and the maximum load is designated as stability. During the loading, an attached dial gauge measures the specimen's plastic flow (deformation) due to the loading. The flow value is recorded in 0.25 mm (0.01 inch) increments at the same time when the maximum load is recorded.
Density, (relative density) specific gravity & absorption of coarse aggre...Muhammad Saleem
1) The document describes a test conducted to determine the density, specific gravity, and absorption of coarse aggregate.
2) The test procedure involves obtaining a sample of coarse aggregate, drying it in an oven, submerging it in water, weighing it at various stages to determine density and absorption values using calculations.
3) The results of the test provide the density, specific gravity when oven dry and saturated surface dry, and absorption percentage of the coarse aggregate sample.
To determine the grade of given bitumen. The penetration test is used as a measure of consistency. Higher values of penetration indicate softer consistency.
This document discusses the shrinkage limit test for soils. It defines shrinkage limit as the moisture content at which a saturated soil stops decreasing in volume as it dries, even though saturation remains near 100%. The test involves drying a soil sample and measuring its volume and weight changes to determine the moisture content at which further drying does not cause additional volume reduction. This limit provides important information for designing structures in expansive soils and assessing soil suitability for construction materials.
1) The document describes the process for Marshall stability test and mix design for bituminous concrete. Key steps include selecting aggregates based on strength and gradation, determining aggregate proportions, preparing specimens, and testing stability and flow.
2) Aggregate proportions are determined using an analytical method solving equations for the required gradation. Specimens are compacted and tested for stability (maximum load) and flow (deformation) at varying bitumen contents to determine the optimum mix.
3) Stability and flow values are measured using a Marshall test machine and calculations are done to determine density, voids, and other properties of the mix. The process is repeated to get the optimum bitumen content for the mix design.
This document provides information on the conventional asphalt mix design process. It discusses the key steps, which include selecting aggregates based on specified properties, determining the aggregate gradation, proportioning aggregates to meet the gradation, selecting a suitable bitumen, preparing specimens, conducting density-void analysis and measuring stability and flow to determine the optimum bitumen content. Specimens are compacted using a Marshall compactor and tested for properties like stability, flow and density at different bitumen contents to establish the job mix formula.
The document discusses concrete mix design, including:
- Concrete is made from cement, aggregates, water, and sometimes admixtures.
- ACI and BIS methods are described for determining mix proportions based on factors like strength, workability, durability, and materials.
- A step-by-step example is provided to design a mix using the ACI method for a specified 30MPa strength, including determining water-cement ratio, volumes, and final proportions.
The document discusses Superpave mix design, which is a performance-based method for designing asphalt concrete mixtures. Some key points:
- Superpave uses the gyratory compactor to simulate field compaction of mixtures, allowing for evaluation of density during the design process.
- The design process involves 4 steps: selecting materials based on traffic and climate conditions, designing the aggregate structure, determining the optimum asphalt binder content, and evaluating moisture susceptibility.
- Key evaluation points on the gyratory compaction curve are Ninitial, Ndesign, and Nmax, which control compactability, expected field density, and maximum allowed density.
- Design traffic level determines the number
Los Angeles Abrasion Test
To determine the Los Angeles abrasion value.
To find the suitability of aggregates for use in road construction. Select the most suitable aggregate for different kinds of works based on the abrasion value. The test is significant to determine the hardness (and toughness) of the material.
The difference between the original and final weights of the sample represents the actual wear. This value is expressed as a percentage of the original weight of the sample and is reported as the percentage of wear.
Astm designation c 136 for coarse aggregatesMuhammad Ahmad
Sieve Analysis for Coarse Aggregate as per ASTM. Slides contain all the relevant data and steps that would be required for the performance of sieve analysis of coarse aggregates.
Quality tests for aggregates and concrete mix designAyaz khan
This document provides information and procedures for testing the quality of aggregates used in concrete. It discusses testing the gradation of coarse and fine aggregates, determining specific gravity, and checking for clay lumps, flat and elongated particles, abrasion resistance, organic impurities, soundness, and stripping. Procedures are outlined for sieve analysis, specific gravity, clay lump, and flaky particle tests. The document also mentions mix design testing for concrete.
Determination of water content-dry density relation using light compaction. (Standard Proctor Test)
1. Maximum dry density (MDD) = 1.72 g/cm³
2. Optimum Moisture Content (OMC) = 18.3 %
3. Max. Saturation = 92.17 %
4. Min. Void Ratio = 0.549
The "acceptable zone" represents the zone of acceptable water content vs dry unit weight combinations based on typical current practice. The designer will usually require that the dry unit weight γd of the compacted soil be greater than or equal to a percentage P of the maximum dry unit weight Γd, max from a laboratory compaction test.
Out of four samples, in Delhi Silt highest value of max. dry density = 1.86 g/cc was achieved at a moisture content of 13% as compared to 1.72 g/cc for Dhanauri clay at 18.3%. It is seen that as the proportion of clay is increased in the soil mix the Optimum Moisture Increases and the Maximum Dry Density Decreases.
Class notes of Geotechnical Engineering course I used to teach at UET Lahore. Feel free to download the slide show.
Anyone looking to modify these files and use them for their own teaching purposes can contact me directly to get hold of editable version.
Road way Condition Of Panthapath-Russell Square IntersectionMd.Abu Raihan Asif
The document summarizes a study of road conditions on the Panthapath-Russell Square road in Dhaka. Various manual and automatic methods were used to collect data on intersection conditions, signals, roadway, roadside features, structures, street lights, dividers and markings. The intersections experience heavy traffic controlled by police. Many issues were found such as poor signals, cracks, potholes and encroachments. Recommendations include improved signs, markings and facilities for pedestrians. Limitations include resource constraints and unreliable manual methods.
This document outlines standards for road markings in India as established by the Indian Roads Congress in 1970 and revised in 1995. It defines road markings as lines, patterns, words or devices used to control, warn and guide traffic. The standards apply uniformly across all categories of roads in rural and urban areas. Road markings are classified into carriageway markings like center lines, traffic lanes and intersection markings as well as object markings and kerb markings. Materials for road markings must conform to specified standards and include paint and glass beads for improved night visibility. Authority for road markings lies with local road authorities in consultation with police where necessary.
ROADS/PAVEMENT & TYPES OF ROAD BY ENGR SAAD ULLAH WECSAAD ULLAH
There are two main types of roads: flexible and rigid. Flexible roads have asphalt surfaces and are composed of several layers including the pavement, base, sub-base, and sub-grade. Rigid roads have concrete surfaces and also have multiple layers providing structural support. Both road types aim to distribute vehicle loads across layers while allowing for drainage. Proper construction and material selection influence how long roads last before needing repair or rehabilitation.
This document provides an overview of geophysical methods used for site investigation and laboratory measurements. It discusses various methods including electrical resistivity, seismic methods, electromagnetic conductivity, gravity geophysical methods, and geothermal methods. For each method, it describes how the technique works and how tests are conducted to collect subsurface data on properties like density, conductivity, and elastic moduli. The document aims to explain different geophysical techniques that can be employed to characterize subsurface conditions.
Road markings function to control and guide traffic. There are different types of road markings including carriageway markings, object markings, and kerbs. Carriageway markings are applied to roadways while object markings are used to mark features like traffic islands, culverts, piers, and abutments. Kerbs define the edge of roads and pathways.
Types of intersection of road and design parameters of road intersectionwaiseee
This document provides information about types of road intersections and design parameters. It discusses two main types of intersections: grade-separated intersections which use bridges or tunnels to separate opposing traffic, and at-grade intersections where traffic crosses at the same level. Several specific intersection designs are described such as diamond, cloverleaf, and roundabout. Key design parameters for pedestrians, bicyclists, vehicles, and traffic control are also outlined.
The document discusses bridge types, components, selection criteria, and design considerations. It begins by defining what a bridge is and its purpose in transportation systems. It then covers typical bridge components and various structural forms for bridges based on material, span length, and other factors. Key criteria for selecting bridge types include span length, site conditions, cost, and aesthetics. The document emphasizes that aesthetic design requires considering function, proportion, harmony, order/rhythm, and contrast/texture to create pleasing structures that blend with their environments.
This document provides information on concrete mix design, including objectives, basic considerations, and the IS (Indian Standards) method for mix design. The objectives of mix design are to achieve the desired workability, strength, durability, and cost. Basic considerations include cost, specifications, workability, strength, durability, and aggregate grading. The IS method is then described in steps, including selecting target strength, water-cement ratio, air content, water and sand contents, cement content, and aggregate contents. An example application of the IS method is also provided.
The document summarizes Martin Odersky's talk at Scala Days 2016 about the road ahead for Scala. The key points are:
1. Scala is maturing with improvements to tools like IDEs and build tools in 2015, while 2016 sees increased activity with the Scala Center, Scala 2.12 release, and rethinking Scala libraries.
2. The Scala Center was formed to undertake projects benefiting the Scala community with support from various companies.
3. Scala 2.12 focuses on optimizing for Java 8 and includes many new features. Future releases will focus on improving Scala libraries and modularization.
4. The DOT calculus provides a formal
ASTM STANDARDS IN PERFORMING LABORATORY TEST FOR AGGREGATESanthonyAnlicao
This document provides information on performing laboratory tests for aggregates, including specific gravity and water absorption tests. It lists the necessary ASTM standards, equipment, and step-by-step procedures for conducting the tests on both coarse and fine aggregates. The tests involve steps such as drying samples, weighing them in various conditions to determine densities, soaking samples in water, and calculating absorption percentages. Proper handling and storage of test weights and equipment is also emphasized to ensure accurate results.
This document provides procedures for preparing soil and soil aggregate samples for various tests, including:
- Drying the sample and breaking up aggregations without reducing grain size
- Separating the sample using sieves into fractions for particle size analysis, physical tests, and moisture-density relations tests
- Obtaining representative portions of each fraction for testing through proportional splitting or quartering
- Specific requirements for sample sizes and preparation for particle size analysis, physical tests, specific gravity tests, and moisture-density relations tests
This document provides guidance on procedures for inspecting and sampling fine and coarse aggregates. It discusses necessary testing equipment for the laboratory, proper sampling techniques, reducing samples to a test size, and methods for various aggregate tests. The document is organized into chapters covering topics like sampling, sample reduction, testing methods, aggregate specifications, and test method verification requirements. Appendices provide details on specific Indiana and AASHTO test methods.
This document discusses the importance of instrument air quality for automation plant control systems. It describes how instrument air is used to operate pneumatic valves, pumps and other devices to keep the plant running properly. The key parameters for instrument air quality are dew point, oil content, particulates and temperature. It then examines different methods for drying instrument air including chemical drying, refrigeration and adsorption. Adsorption is identified as the most common method used, and it details how adsorption driers work using desiccants like activated alumina, silica gel and molecular sieves. The document presents the objectives and plan to design an air drier package to meet industrial specifications for instrument air quality in a plant.
1. This experiment aims to find the properties of plastic viscosity, apparent viscosity and yield point of drilling mud using a Fann V-G viscometer.
2. A Fann viscometer measures the rheology of drilling mud by applying forces between a central bob and outer rotating sleeve to determine viscosity parameters.
3. The experiment involves preparing a bentonite mud sample, loading it into the Fann viscometer, and taking readings at different RPMs to calculate viscosity values.
This document summarizes procedures for conducting Proctor tests (AASHTO T-99 and T-180) and CBR tests (AASHTO T-193). It describes sample preparation, compaction, soaking, and testing methods. Samples are compacted in molds at different moisture contents to determine maximum dry density. For CBR tests, 3 samples are compacted at different densities and soaked prior to penetration testing to evaluate soil strength under wet conditions. Procedures are provided for compaction, mass and moisture measurements, swelling measurement, and loading during soaking.
The document describes procedures for determining nitrogen oxide emissions from stationary sources, including field sampling methods, laboratory procedures, and calculations. A grab sample is collected in an evacuated flask containing an acid solution and analyzed colorimetrically or via ion chromatography to measure nitrogen oxides except nitrous oxide. Field procedures involve collecting samples using a probe and flask, while laboratory procedures specify reagents, equipment, sample recovery, and analysis steps to process the samples collected and calculate results.
This document discusses the various applications of filter paper in laboratory testing based on standard test methods. It provides the recommended grade of filter paper for over 40 different environmental, materials, and wastewater tests covering areas like soils, sludge, water, and air emissions. The tests examine various parameters such as moisture content, strength, permeability, toxicity, solids, nutrients, oils, metals, radioactivity, bacteria, and particulate matter. The recommended grades depend on factors like the sample type, required porosity, absorption properties, and avoidance of contamination.
This document provides information on dedusting filters and their operation. It discusses the key components of a dedusting system including equipment to be dedusted, pipes, filters, fans, and insulation. It explains that the filter cake, not the bag itself, does most of the filtering. Guidelines are provided for filtration velocity, dust concentration, insulation needs, and other design factors. Filter bag selection criteria include the cleaning mechanism, dust properties, temperature, and allowed dust levels in cleaned gas.
Presentation on process control study in spinning dpt.Anchal Aneja
The document provides information about the blow room process in spinning mills. It discusses the objectives and processes that occur in the blow room like pre-opening, pre-cleaning, blending, fine opening and dedusting. It describes the machines used and parameters that need to be considered like beater type, speed, settings and production rate. The goal of the blow room is to supply clean and homogenous fibre tufts to the carding machine without damaging fibres.
The document discusses the basics of dedusting filters used in cement plants. It covers key principles such as the formation of dust cake on filter bags, design guidelines for filtration velocity and air-to-cloth ratios, selection criteria for filter bags, and components of a dust collection system including equipment to be dedusted, dedusting pipes, filters, fans and insulation. Guidelines are provided for hooding, air velocities, dust concentrations and other parameters to ensure trouble-free operation of dedusting plants.
This document describes the process of gravimetric analysis used at Kansanshi Mining PLC to quantify employee exposure to airborne dust. Gravimetric analysis involves collecting dust samples using filters and weighing them before and after to determine dust concentration. The process requires a dedicated weighing room with controlled conditions and specialized equipment to precisely weigh filters. Samples are collected using cassettes that hold filters with or without cyclones, then brought to the weighing room to determine dust mass and calculate concentration.
1) The filter cake that forms on the surface of the filter bags is what does the filtering, not the bags themselves. The cake protects the bags from dust.
2) When designing a dedusting system, the key components to consider are the equipment to be dedusted, dedusting pipes/valves, filter, fan/motor, and insulation. Design guidelines include airflow volumes, pipe sizes, filtration velocities below 1.3 m/s, and dust concentrations of 20-50 g/cubic meter.
3) Important factors for selecting filter bags include the type of filter and cleaning mechanism, moisture/temperature, dust properties, and providing high permeability, strength, and stability. The bag material
Determination of Argon in Ammonia Plant Process Gas Streams by Gas Chromatogr...Gerard B. Hawkins
Determination of Argon in Ammonia Plant Process Gas Streams by Gas Chromatography
SCOPE AND FIELD OF APPLICATION
This document is a method for the determination of argon in process gas streams in the range 0-10% v/v.
1. The document discusses standards for assessing cleanliness of components in automotive fluid systems like lubricants, fuels, and hydraulics. Small particles can cause failures, so cleanliness is important.
2. It describes methods for extracting particles from components for analysis according to ISO standards. These include agitation extraction for hollow components, pressure rinsing extraction, and ultrasonic extraction.
3. Extraction methods are discussed for assessing the cleanliness of the inner surfaces of cylindrical components like pipes and hoses used in hydraulic, lubrication, and fuel systems. Validation of the extraction process is also covered.
Stack sampling is used to determine emission levels from industrial processes to ensure compliance with regulatory emission limits. It involves collecting representative air samples from a stack to determine the amount and characteristics of pollutants emitted. The sampling system diverts a portion of the gas stream through a train that collects particulate and gaseous samples. Isokinetic sampling aims to collect samples at the same velocity as the gas stream for representativeness. The procedure involves determining sampling points and flow rates, collecting samples at each point, and calculating emission rates based on sample weights and collection volumes.
This document discusses air quality sampling and monitoring techniques. It describes different methods for collecting gaseous and particulate air pollutants including grab sampling, absorption in liquids, adsorption in solids, and freeze-out sampling. Particulate collection techniques discussed include sedimentation, high volume filtration, and tape samplers. Site selection criteria and electrostatic precipitators are also covered. The document provides details on various air quality monitoring standards and norms in India.
Analysis of Volatile Organic Compounds (VOCs) in Air Using US EPA Method TO-17PerkinElmer, Inc.
EPA Method TO-171 is used to determine toxic compounds in air after they have been collected onto sorbent tubes. These tubes can either adsorb specific compounds or adsorb a broad range of compounds, quantitatively. Adsorbent tubes have many applications in the investigation of volatile organic compounds (VOCs) found in EPA Method TO-17. Examples include indoor air, fence line, stack, workplace, personal monitoring and soil gas. The type of tube used, and whether the sampling is passive or active, depends upon the need at the particular site being investigated.
This application note demonstrates that the PerkinElmer TurboMatrix™ Thermal Desorber and the PerkinElmer Clarus® SQ 8 GC/MS will meet and exceed the criteria set forth in EPA method TO-17. Detailed instrument method parameters are presented, with precision, recovery, linearity and detection limit results.
Analysis of Volatile Organic Compounds (VOCs) in Air Using US EPA Method TO-17PerkinElmer, Inc.
1) The document evaluates the use of a PerkinElmer TurboMatrix Thermal Desorber and Clarus SQ 8 GC/MS for analyzing volatile organic compounds in air samples collected using EPA Method TO-17.
2) Results showed excellent precision, linearity, and detection limits across 82 compounds, meeting or exceeding TO-17 criteria. Detection limits allowed increasing the sampling volume from 4 to 10 liters.
3) The system provides an accurate, precise, and cost-effective method for air sampling and analysis using sorbent tubes as specified in EPA Method TO-17.
Analysis of Volatile Organic Compounds (VOCs) in Air Using U.S. EPA Method TO-17PerkinElmer, Inc.
EPA Method TO-17 is used to determine toxic compounds in air after they have been collected onto sorbent tubes. These tubes can either adsorb specific compounds or adsorb a broad range of compounds, quantitatively. Adsorbent tubes have many applications in the investigation of volatile organic compounds (VOCs) found in EPA Method TO-17. Examples include indoor air, fence line, stack, workplace, personal monitoring and soil gas. The type of tube used, and whether the sampling is passive or active, depends upon the need at the particular site being investigated. This application note demonstrates that the PerkinElmer TurboMatrix™ Thermal Desorber and the PerkinElmer Clarus® SQ 8 GC/MS will meet and exceed the criteria set forth in EPA method TO-17. Detailed instrument method parameters are presented, with precision, recovery, linearity and detection limit results.
Cover Story - China's Investment Leader - Dr. Alyce SUmsthrill
In World Expo 2010 Shanghai – the most visited Expo in the World History
https://www.britannica.com/event/Expo-Shanghai-2010
China’s official organizer of the Expo, CCPIT (China Council for the Promotion of International Trade https://en.ccpit.org/) has chosen Dr. Alyce Su as the Cover Person with Cover Story, in the Expo’s official magazine distributed throughout the Expo, showcasing China’s New Generation of Leaders to the World.
Unlocking WhatsApp Marketing with HubSpot: Integrating Messaging into Your Ma...Niswey
50 million companies worldwide leverage WhatsApp as a key marketing channel. You may have considered adding it to your marketing mix, or probably already driving impressive conversions with WhatsApp.
But wait. What happens when you fully integrate your WhatsApp campaigns with HubSpot?
That's exactly what we explored in this session.
We take a look at everything that you need to know in order to deploy effective WhatsApp marketing strategies, and integrate it with your buyer journey in HubSpot. From technical requirements to innovative campaign strategies, to advanced campaign reporting - we discuss all that and more, to leverage WhatsApp for maximum impact. Check out more details about the event here https://events.hubspot.com/events/details/hubspot-new-delhi-presents-unlocking-whatsapp-marketing-with-hubspot-integrating-messaging-into-your-marketing-strategy/
SATTA MATKA DPBOSS KALYAN MATKA RESULTS KALYAN CHART KALYAN MATKA MATKA RESULT KALYAN MATKA TIPS SATTA MATKA MATKA COM MATKA PANA JODI TODAY BATTA SATKA MATKA PATTI JODI NUMBER MATKA RESULTS MATKA CHART MATKA JODI SATTA COM INDIA SATTA MATKA MATKA TIPS MATKA WAPKA ALL MATKA RESULT LIVE ONLINE MATKA RESULT KALYAN MATKA RESULT DPBOSS MATKA 143 MAIN MATKA KALYAN MATKA RESULTS KALYAN CHART INDIA MATKA KALYAN SATTA MATKA 420 INDIAN MATKA SATTA KING MATKA FIX JODI FIX FIX FIX SATTA NAMBAR MATKA INDIA SATTA BATTA
SATTA MATKA DPBOSS KALYAN MATKA RESULTS KALYAN CHART KALYAN MATKA MATKA RESULT KALYAN MATKA TIPS SATTA MATKA MATKA COM MATKA PANA JODI TODAY BATTA SATKA MATKA PATTI JODI NUMBER MATKA RESULTS MATKA CHART MATKA JODI SATTA COM INDIA SATTA MATKA MATKA TIPS MATKA WAPKA ALL MATKA RESULT LIVE ONLINE MATKA RESULT KALYAN MATKA RESULT DPBOSS MATKA 143 MAIN MATKA KALYAN MATKA RESULTS KALYAN CHART
Prescriptive analytics BA4206 Anna University PPTFreelance
Business analysis - Prescriptive analytics Introduction to Prescriptive analytics
Prescriptive Modeling
Non Linear Optimization
Demonstrating Business Performance Improvement
Tired of chasing down expiring contracts and drowning in paperwork? Mastering contract management can significantly enhance your business efficiency and productivity. This guide unveils expert secrets to streamline your contract management process. Learn how to save time, minimize risk, and achieve effortless contract management.
SATTA MATKA DPBOSS KALYAN MATKA RESULTS KALYAN CHART KALYAN MATKA MATKA RESULT KALYAN MATKA TIPS SATTA MATKA MATKA COM MATKA PANA JODI TODAY BATTA SATKA MATKA PATTI JODI NUMBER MATKA RESULTS MATKA CHART MATKA JODI SATTA COM INDIA SATTA MATKA MATKA TIPS MATKA WAPKA ALL MATKA RESULT LIVE ONLINE MATKA RESULT KALYAN MATKA RESULT DPBOSS MATKA 143 MAIN MATKA KALYAN MATKA RESULTS KALYAN CHART
The Most Inspiring Entrepreneurs to Follow in 2024.pdfthesiliconleaders
In a world where the potential of youth innovation remains vastly untouched, there emerges a guiding light in the form of Norm Goldstein, the Founder and CEO of EduNetwork Partners. His dedication to this cause has earned him recognition as a Congressional Leadership Award recipient.
NIMA2024 | De toegevoegde waarde van DEI en ESG in campagnes | Nathalie Lam |...BBPMedia1
Nathalie zal delen hoe DEI en ESG een fundamentele rol kunnen spelen in je merkstrategie en je de juiste aansluiting kan creëren met je doelgroep. Door middel van voorbeelden en simpele handvatten toont ze hoe dit in jouw organisatie toegepast kan worden.
SATTA MATKA DPBOSS KALYAN MATKA RESULTS KALYAN MATKA MATKA RESULT KALYAN MATKA TIPS SATTA MATKA MATKA COM MATKA PANA JODI TODAY BATTA SATKA MATKA PATTI JODI NUMBER MATKA RESULTS MATKA CHART MATKA JODI SATTA COM INDIA SATTA MATKA MATKA TIPS MATKA WAPKA ALL MATKA RESULT LIVE ONLINE MATKA RESULT KALYAN MATKA RESULT DPBOSS MATKA 143 MAIN MATKA KALYAN MATKA RESULTS KALYAN CHART KALYAN CHART
❼❷⓿❺❻❷❽❷❼❽ Dpboss Matka Result Satta Matka Guessing Satta Fix jodi Kalyan Final ank Satta Matka Dpbos Final ank Satta Matta Matka 143 Kalyan Matka Guessing Final Matka Final ank Today Matka 420 Satta Batta Satta 143 Kalyan Chart Main Bazar Chart vip Matka Guessing Dpboss 143 Guessing Kalyan night
❼❷⓿❺❻❷❽❷❼❽ Dpboss Matka Result Satta Matka Guessing Satta Fix jodi Kalyan Fin...
Bitumen extraction saskatchewan
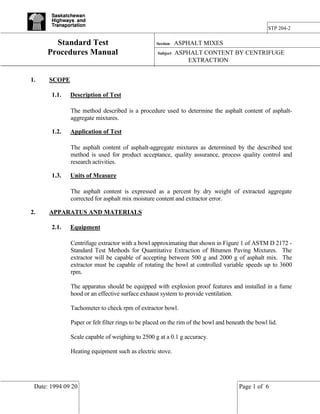
1. STP 204-2
Standard Test Section: ASPHALT MIXES
Procedures Manual Subject: ASPHALT CONTENT BY CENTRIFUGE
EXTRACTION
1. SCOPE
1.1. Description of Test
The method described is a procedure used to determine the asphalt content of asphalt-
aggregate mixtures.
1.2. Application of Test
The asphalt content of asphalt-aggregate mixtures as determined by the described test
method is used for product acceptance, quality assurance, process quality control and
research activities.
1.3. Units of Measure
The asphalt content is expressed as a percent by dry weight of extracted aggregate
corrected for asphalt mix moisture content and extractor error.
2. APPARATUS AND MATERIALS
2.1. Equipment
Centrifuge extractor with a bowl approximating that shown in Figure 1 of ASTM D 2172 -
Standard Test Methods for Quantitative Extraction of Bitumen Paving Mixtures. The
extractor will be capable of accepting between 500 g and 2000 g of asphalt mix. The
extractor must be capable of rotating the bowl at controlled variable speeds up to 3600
rpm.
The apparatus should be equipped with explosion proof features and installed in a fume
hood or an effective surface exhaust system to provide ventilation.
Tachometer to check rpm of extractor bowl.
Paper or felt filter rings to be placed on the rim of the bowl and beneath the bowl lid.
Scale capable of weighing to 2500 g at a 0.1 g accuracy.
Heating equipment such as electric stove.
Date: 1994 09 20 Page 1 of 6
2. Standard Test Procedures Manual STP 204-2
Section: Subject:
ASPHALT MIXES ASPHALT CONTENT BY CENTRIFUGE
EXTRACTION
Thermometer capable of measuring temperature between 50o C and 150o C.
250 ml cup or beaker.
Torque wrench capable of producing 35 N.m of torque.
Hand Tools - spatula, small brush, scoop, large pan for collection of a representative
asphalt mix sample, pan for test sample.
Container for collection of asphalt laden solvent thrown from the bowl during extraction.
2.2. Materials
Solvents - suggested materials are chlorothene or trichloroethylene.
2.3. Sample To Be Tested
Obtain representative samples of the asphalt-aggregate mixture. Asphalt mix samples will
be collected in accordance with STP 103 - SAMPLING ASPHALT MIXES. Asphalt
concrete samples will be collected in accordance with STP 204-5 ASPHALT
CONCRETE SAMPLES OBTAINED BY CORING.
2.4. Data Required
Sample information including date, time, sample number, sampling location, sampled by,
tested by, contract number, control section, contractor, asphalt type, aggregate type,
extractor make, model and serial number.
3. PROCEDURE
3.1. Equipment Preparation
Ensure extractor bowl, hand tools and sample containers are cleaned of all residual asphalt
and aggregate materials and dry before commencing the test.
Check extractor rpm to ensure that a maximum of 3600 rpm is being achieved.
Page: 2 of 6 Date: 1994 09 20
3. Standard Test Procedures Manual STP 204-2
Section: Subject:
ASPHALT MIXES ASPHALT CONTENT BY CENTRIFUGE
EXTRACTION
3.2. Sample Preparation
Collect representative samples as described in section 2.3 above. Sample size will depend
on the extractor bowl size. Larger samples will give more accurate results. Weigh the
asphalt mix and record as "weight of asphalt mix".
A sample of asphalt mix is required to determine the moisture content of the asphalt mix.
Sample size and preparation are described in STP 204-1, MOISTURE CONTENT BY
OVEN DRYING.
3.3. Test Procedure
Turn ventilation equipment on and adjust for maximum suction from the extractor and
enclosure.
Spread the asphalt mix sample evenly in the bowl. Cover the sample with the specified
solvent. Rotate the bowl back and forth gently by hand to distribute solvent and asphalt
mix evenly in the bowl.
Place two filter rings on the bowl rim and secure the bowl cover plate on
top of the filter papers. Tighten the cover using a torque wrench up to a
maximum torque of 17 N*m. Ensure that for all subsequent extractions the
bowl cover plate is tightened with the same torque.
Allow the material to soak for 5 minutes before the first centrifuge is begun.
Begin centrifuging slowly, increasing bowl speed slowly to a maximum of 3600 rpm.
When the asphalt-solvent effluent stops flowing from the extractor, turn off the motor,
slow and stop the bowl using the braking mechanism.
Add approximately 250 ml of solvent to the bowl and repeat the above described
procedure. The procedure should be repeated until the extracted effluent has a light
yellow straw colour. This is usually accomplished in 4 to 6 washings.
After the final wash, remove the filler screw and cover plate. Remove the filters carefully,
clean the extracted aggregate from the filter papers and bowl and place in a clean pan.
The recommended drying procedure is to place the extracted aggregate in an oven at a
controlled temperature of 120o C and dry to a constant weight. Establish the required
drying time by weighing after repeated heating and cooling until the weight is constant.
To prevent burning of the mineral particles, do not heat the aggregate above 120o C.
Date: 1994 09 20 Page: 3 of 6
4. Standard Test Procedures Manual STP 204-2
Section: Subject:
ASPHALT MIXES ASPHALT CONTENT BY CENTRIFUGE
EXTRACTION
In a field quality control setting, the extracted aggregate may be dried on a hot plate or
stove burner element. The method is more subject to burning of the mineral particles and
is a less desirable method.
After cooling, weigh the dried aggregate to the nearest 0.1 g. Dry aggregate may absorb
moisture from the air. Determine the mass of the extracted aggregate immediately upon
cooling to ambient temperature. Record the weight of the dry extracted aggregate to the
nearest 0.1 g.
4. RESULTS AND CALCULATIONS
4.1. Collection of Test Results
The following data is required:
- Weight of asphalt mix before extraction to the nearest 0.1 g
- Weight of dried aggregate after extraction to the nearest 0.1 g
- Moisture content of the asphalt mix as determined by STP 204-1,
MOISTURE CONTENT BY OVEN DRYING
- Extractor correction as determined by STP 204-23, EXTRACTION AND MOISTURE
CORRECTIONS
4.2. Calculations
Uncorrected Asphalt Content = (wt. of asphalt mix - wt. of dry agg.) x 100
(Calculated to the nearest .01%) wt. of dry aggregate
Corrected Asphalt Content = Uncorrected Asphalt Content (%) - Moisture
Content (%) + Extractor Error (%)
NOTE: 1) The corrected asphalt content should be rounded to the nearest 0.1%.
2) Refer to STP 204-23 "Extraction and Moisture Corrections" to determine the
proper type of extractor correction to be used.
Page: 4 of 6 Date: 1994 09 20
5. Standard Test Procedures Manual STP 204-2
Section: Subject:
ASPHALT MIXES ASPHALT CONTENT BY CENTRIFUGE
EXTRACTION
5. CALIBRATIONS AND REPEATABILITY
5.1. Equipment Calibration
Periodical checking of extractor rpm should be conducted.
Each time extractor or operators are changed, a new extraction correction should be done.
The extractor correction test should have the same number of washings as used in the
actual extracted sample.
Extraction corrections should also be done for each asphalt mix design or approved job
mix formula.
5.2. Tolerances and Repeatability
Tolerances for repeatability and reproducibility are specified below:
Single Operator: two tests on the same sample should not vary by more than
+ .1%
Multiple Operator: two tests on the same sample shall not vary by more than
+ .2%
5.3. Sources of Error
Incomplete washing of the asphalt from the mix.
Non-consistent torques applied to the bowl cover plate.
Loss of mineral aggregate particles when transferring from extractor bowl and filter papers
to pan.
Not doing moisture and extraction corrections.
Not meeting the specified rpm requirements on the extractor.
Overheating the aggregate during drying.
Date: 1994 09 20 Page: 5 of 6
6. Standard Test Procedures Manual STP 204-2
Section: Subject:
ASPHALT MIXES ASPHALT CONTENT BY CENTRIFUGE
EXTRACTION
6. ADDITIONAL INFORMATION
6.1. Sample Retention
The extracted aggregate may be retained for gradation analysis using STP 204-4, SIEVE
ANALYSIS.
6.2. Safety
Provide good ventilation as solvent fumes may be injurious to your health. Propane stoves
should not be used in laboratories where chlorothene and trichloroethylene solvents are
being used.
Page: 6 of 6 Date: 1994 09 20
7. Standard Test Procedures Manual STP 204-2
Section: Subject:
ASPHALT MIXES ASPHALT CONTENT BY CENTRIFUGE
EXTRACTION
APPROVAL SHEET
New Revision X Date of Previous Document 92-12-10
Effective Date: 94-12-21
Description of Revision (Reason for Revision):
Removed requirement of applying 17 N*m torgue to the extractor lid. Referred to it as a maximum torgue.
Added note to ensure that the same torque be applied for all extractions
Review/Implementation Process:
Reviewed by the End Product Specification Committee and Technical
Standards and Policies Branch.
Other Manuals/Policies Affected:
Nil
Follow Up/Training Required:
Nil
Comments/Concerns/Implications (Budget/Environment/Stakeholders):
Prepared by D. MacLeod 94-09-20
Date
Recommended by D. MacLeod 94-09-20
Materials Standards Engineer Date
Approval Recommended by R.A. Widger 94-12-20
Senior Materials Engineer Date
Approved by A.R. Gerbrandt 94-12-21
Dir., Technical Standards & Policies Br. Date
Electronic File Updated 95-01-31
Update Mailed - -
Date: 1994 09 20 Page: 7 of 6