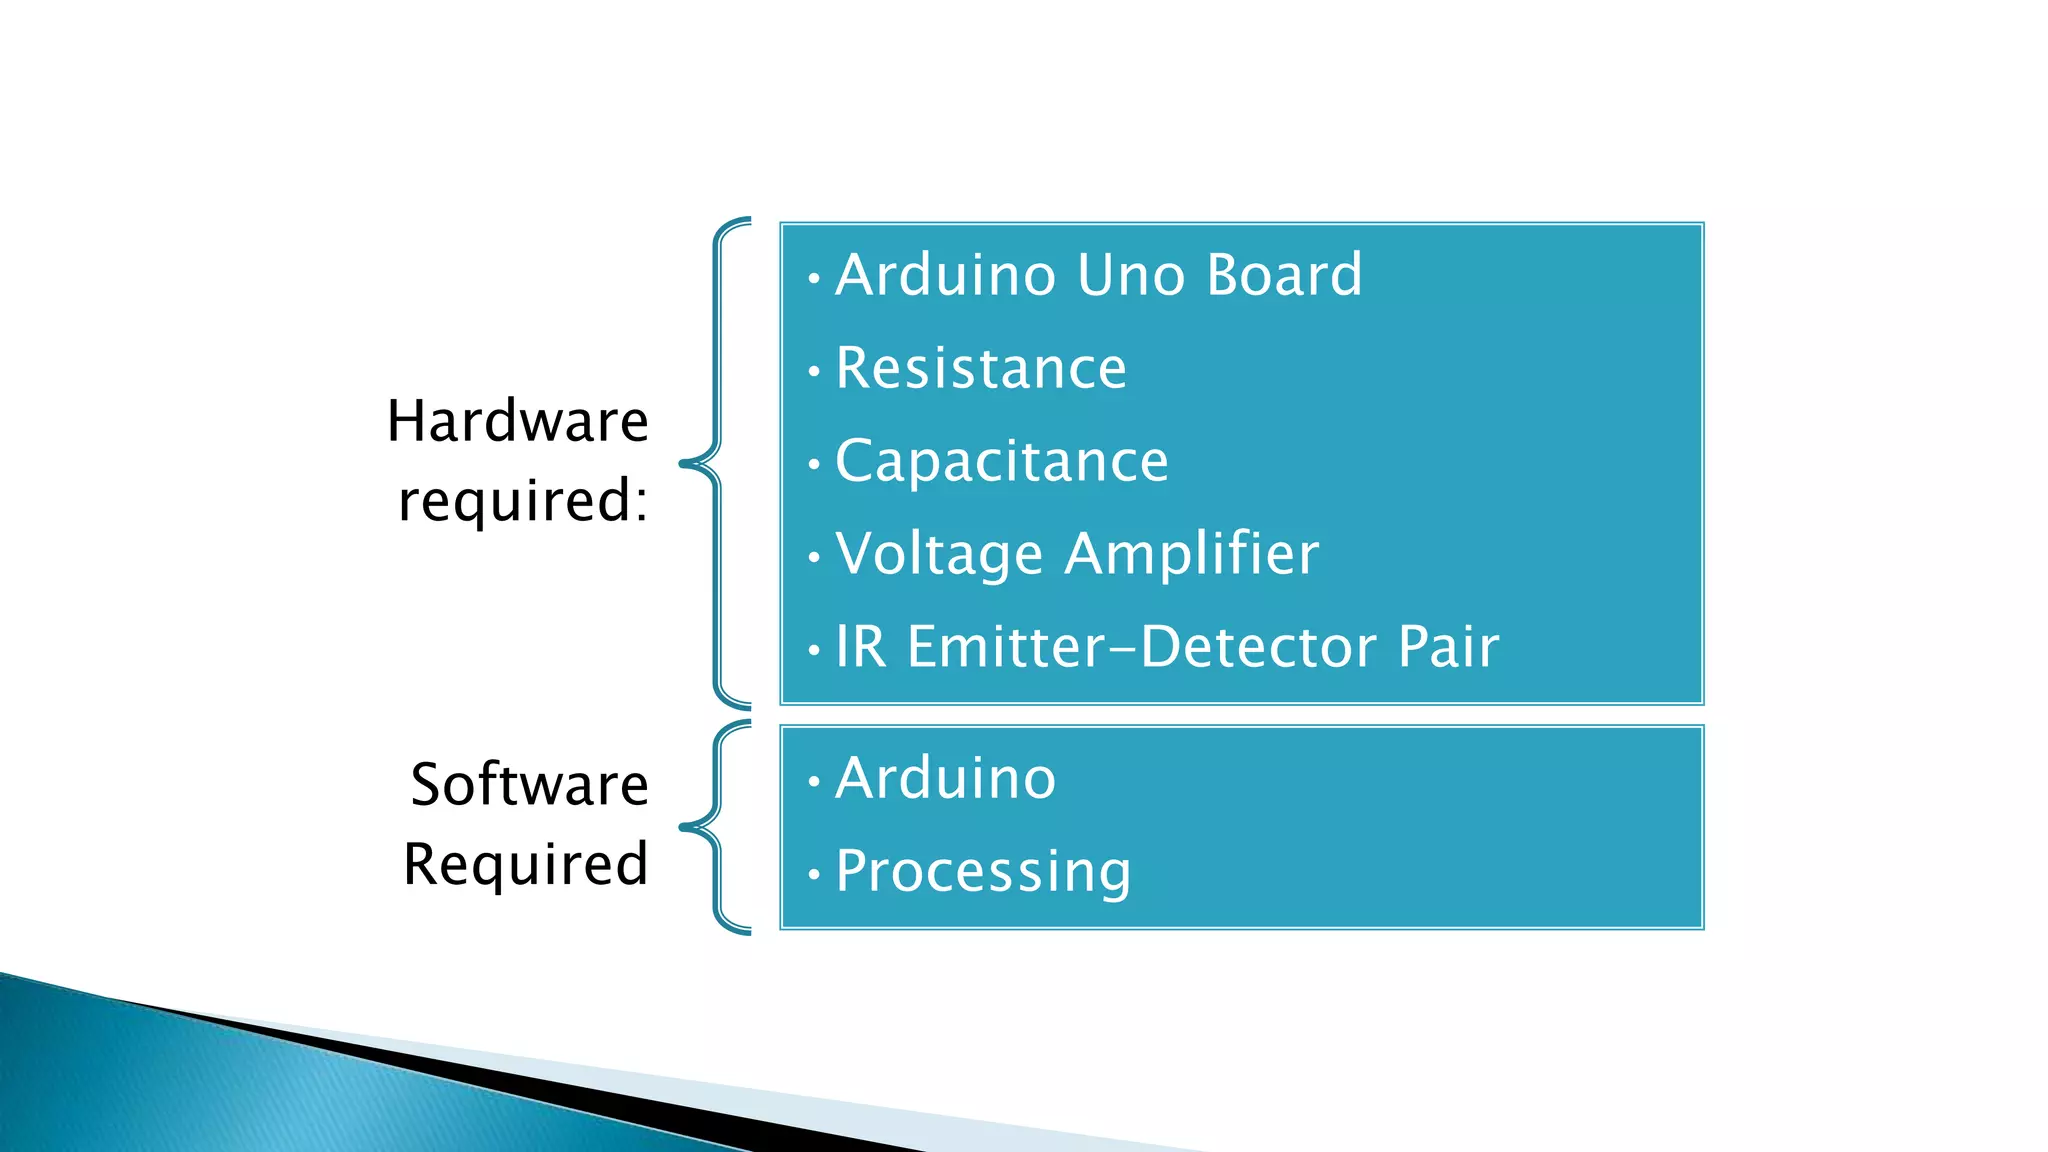
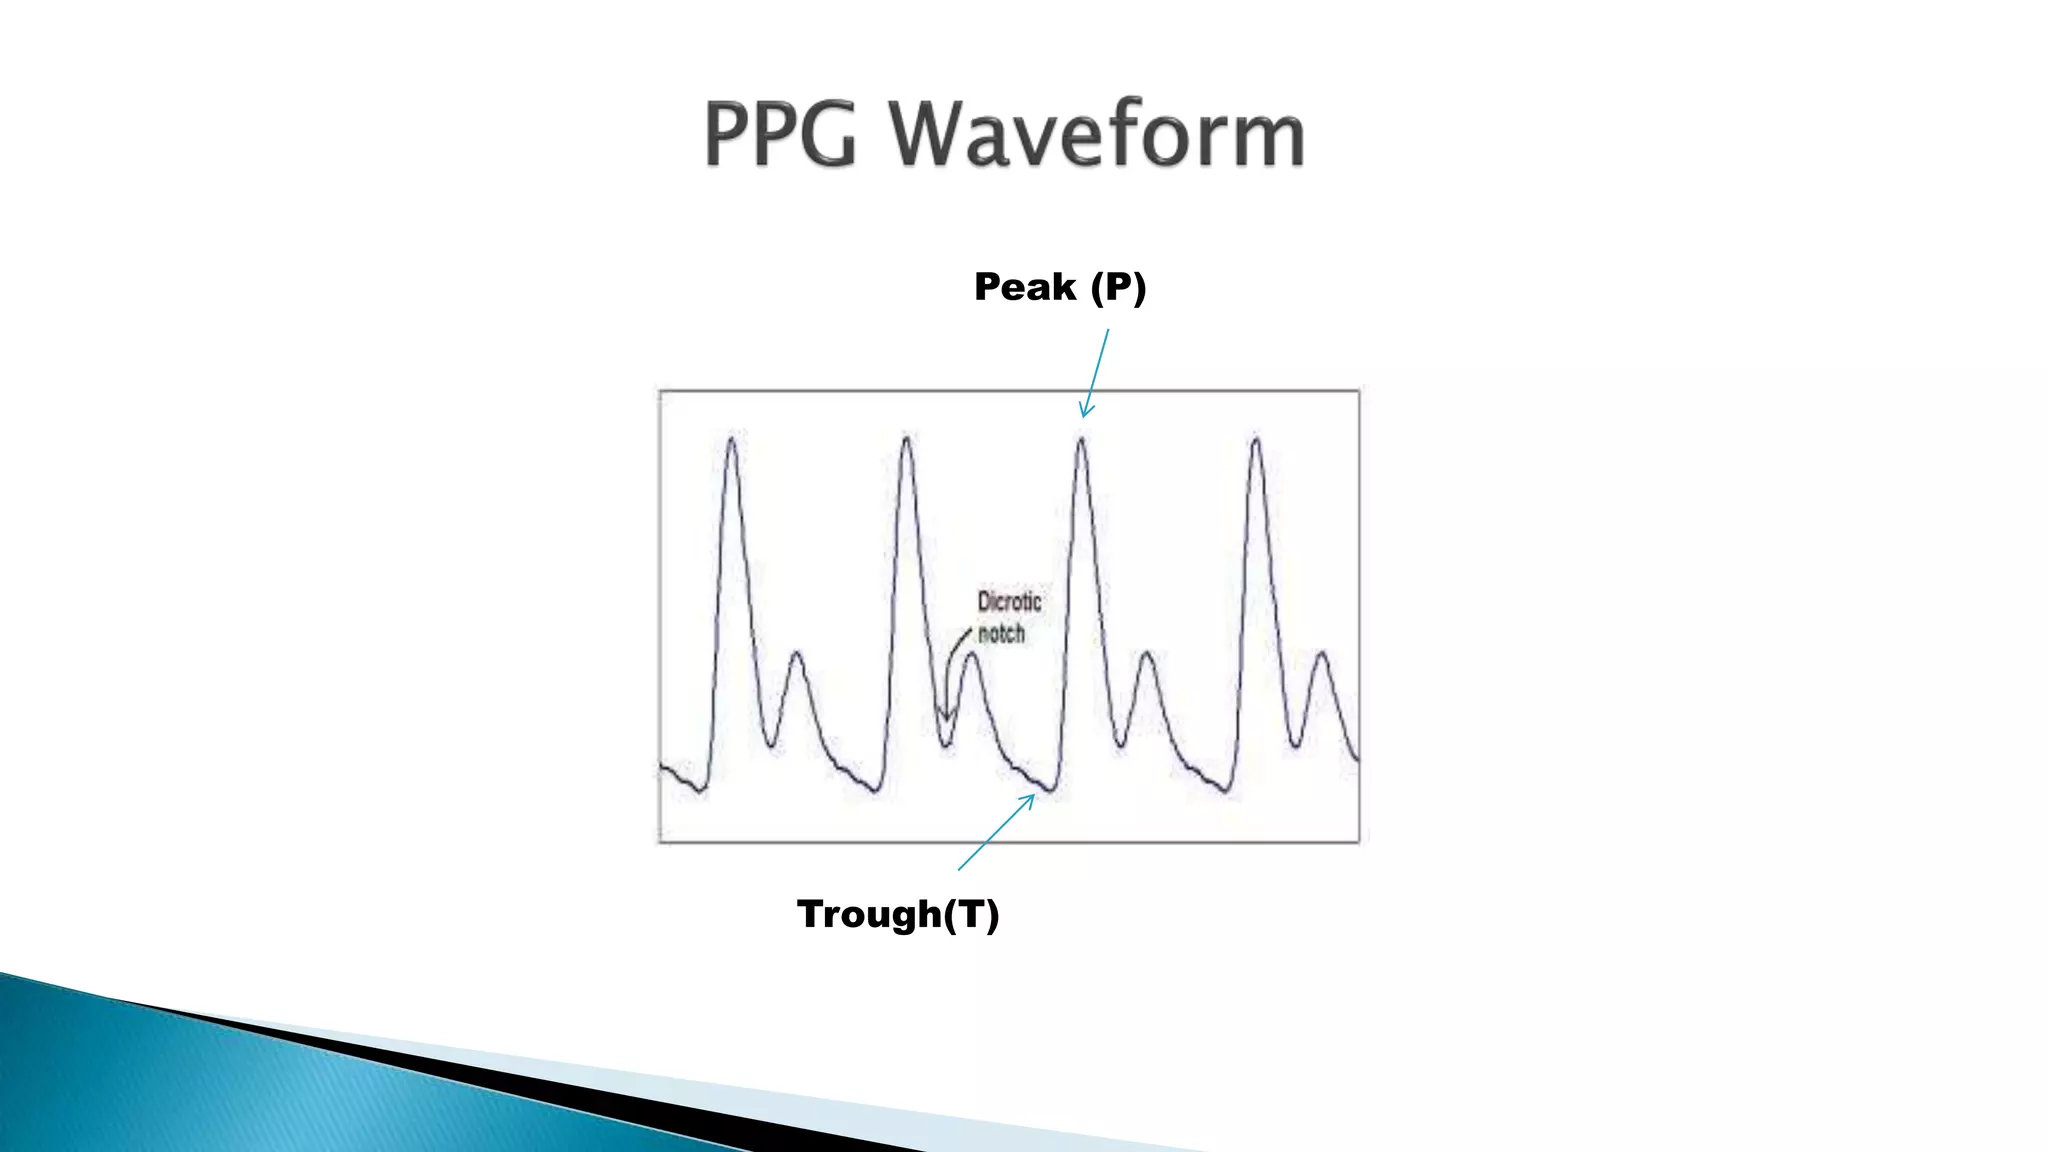
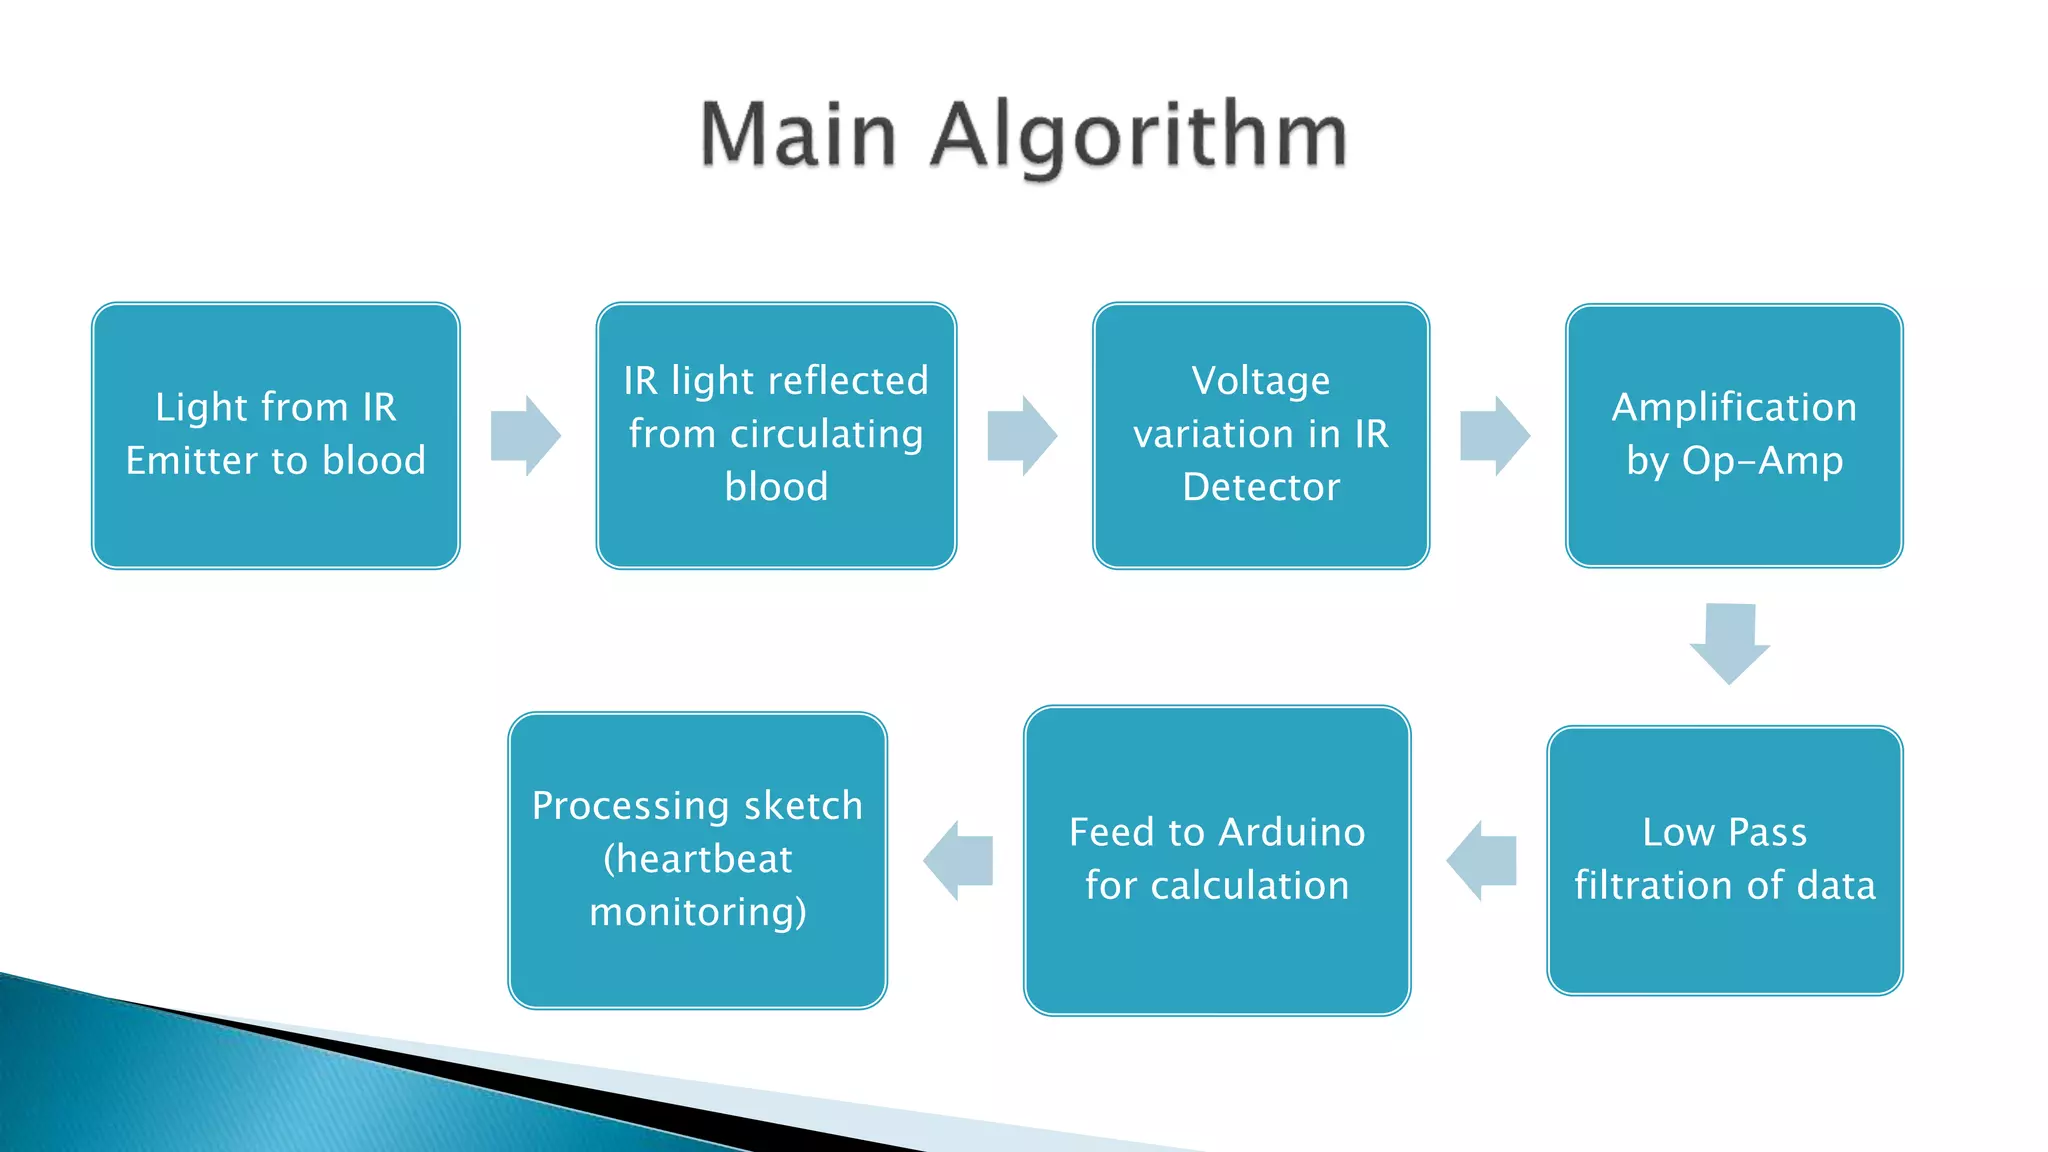
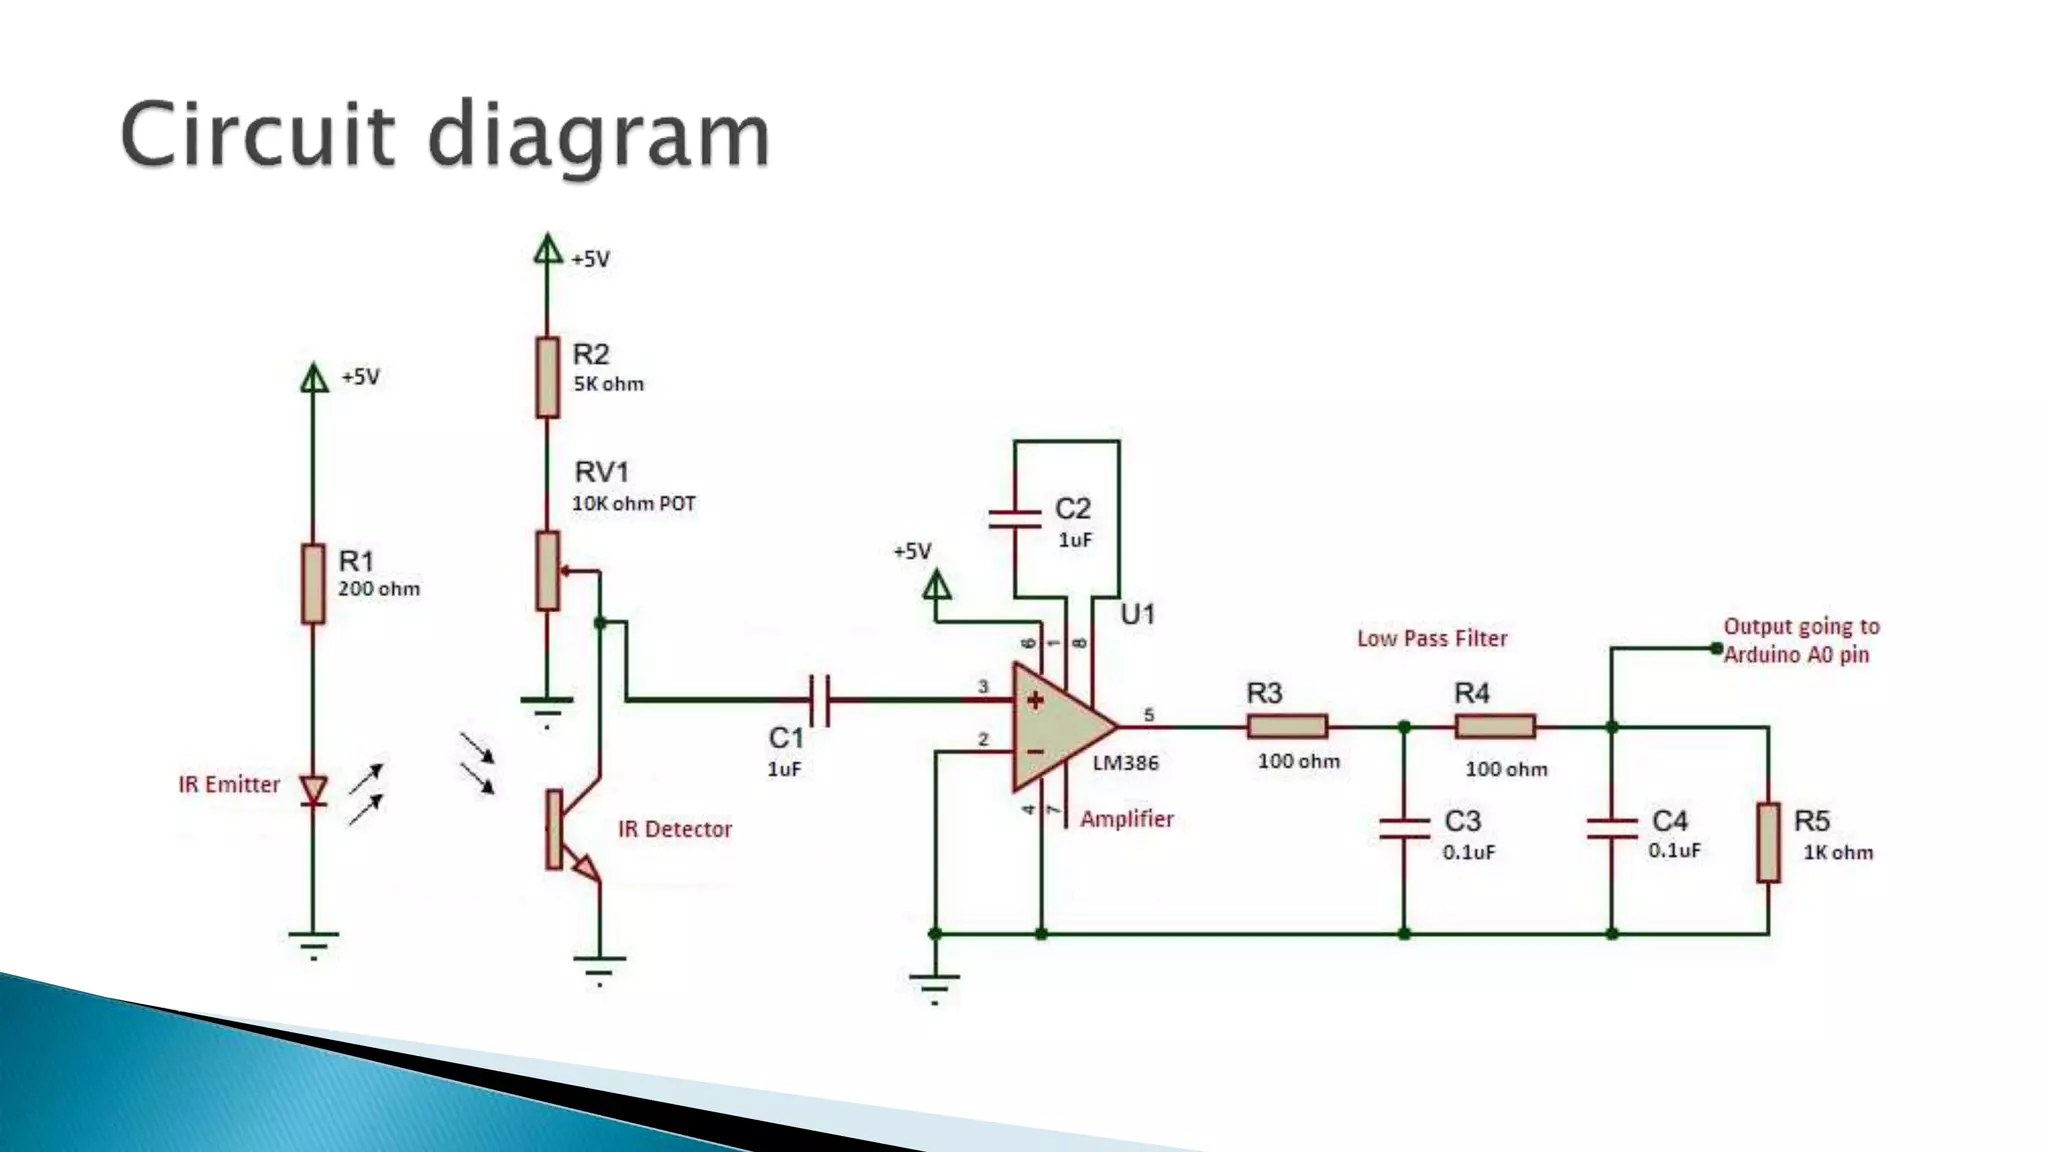
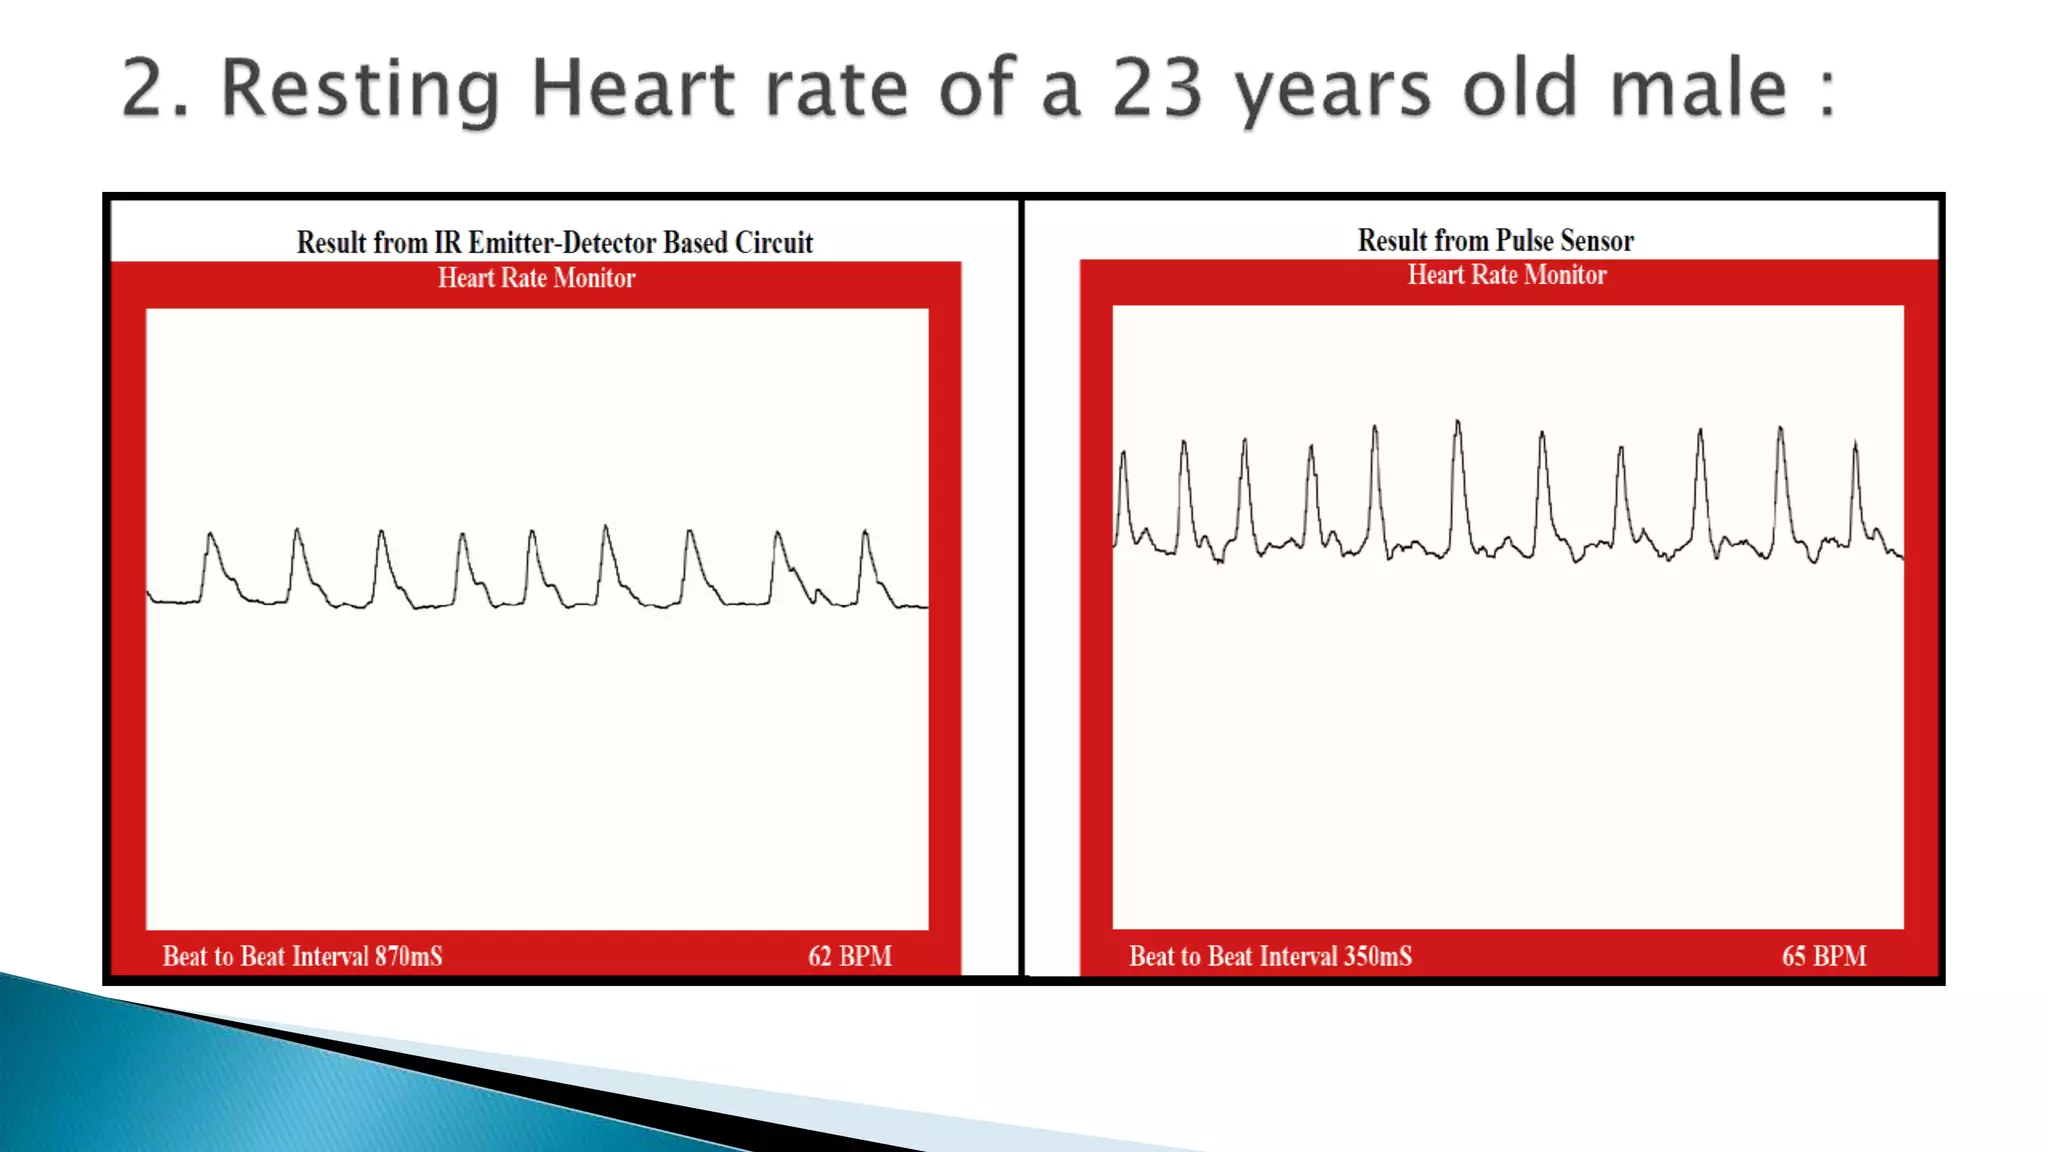
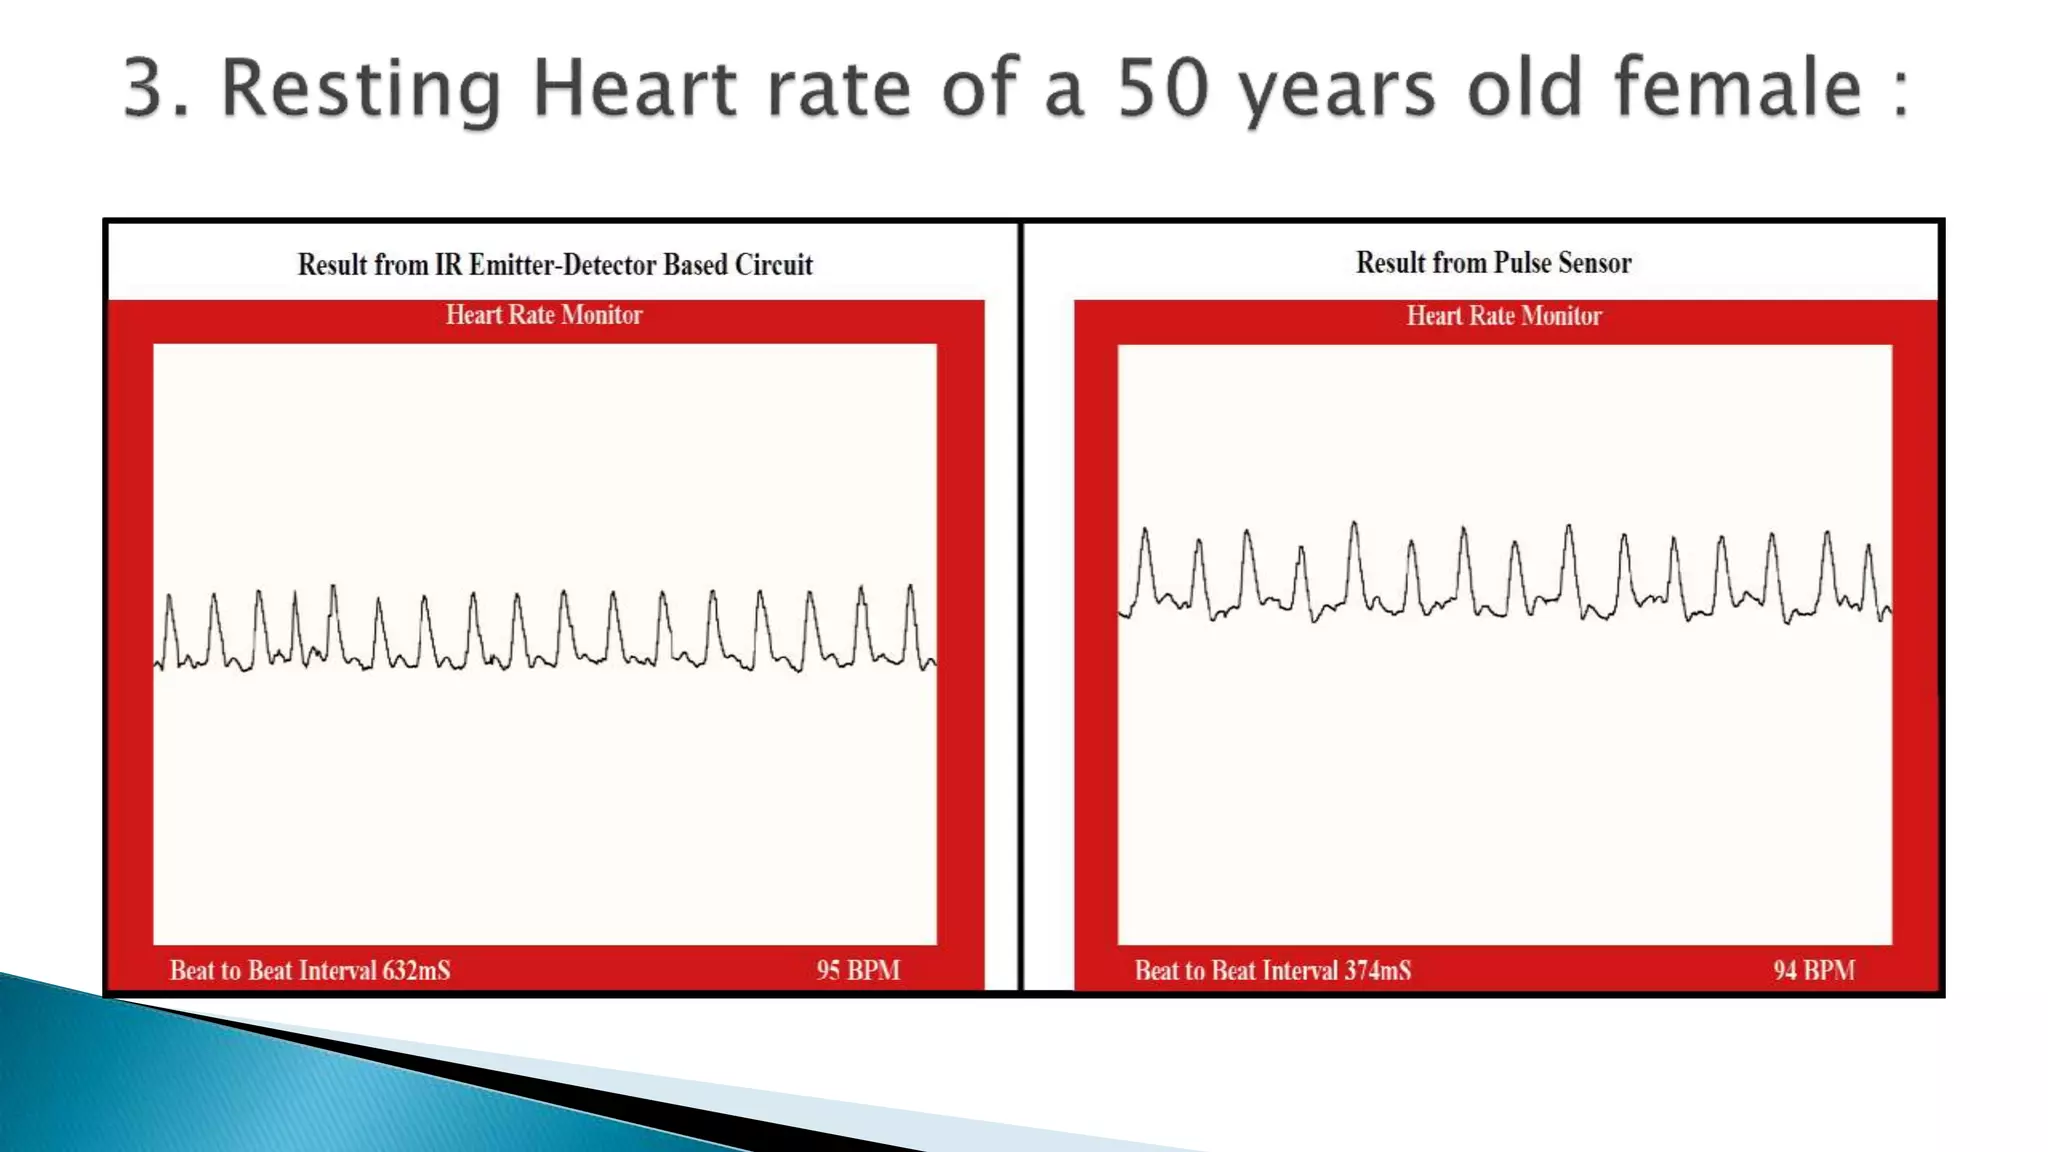
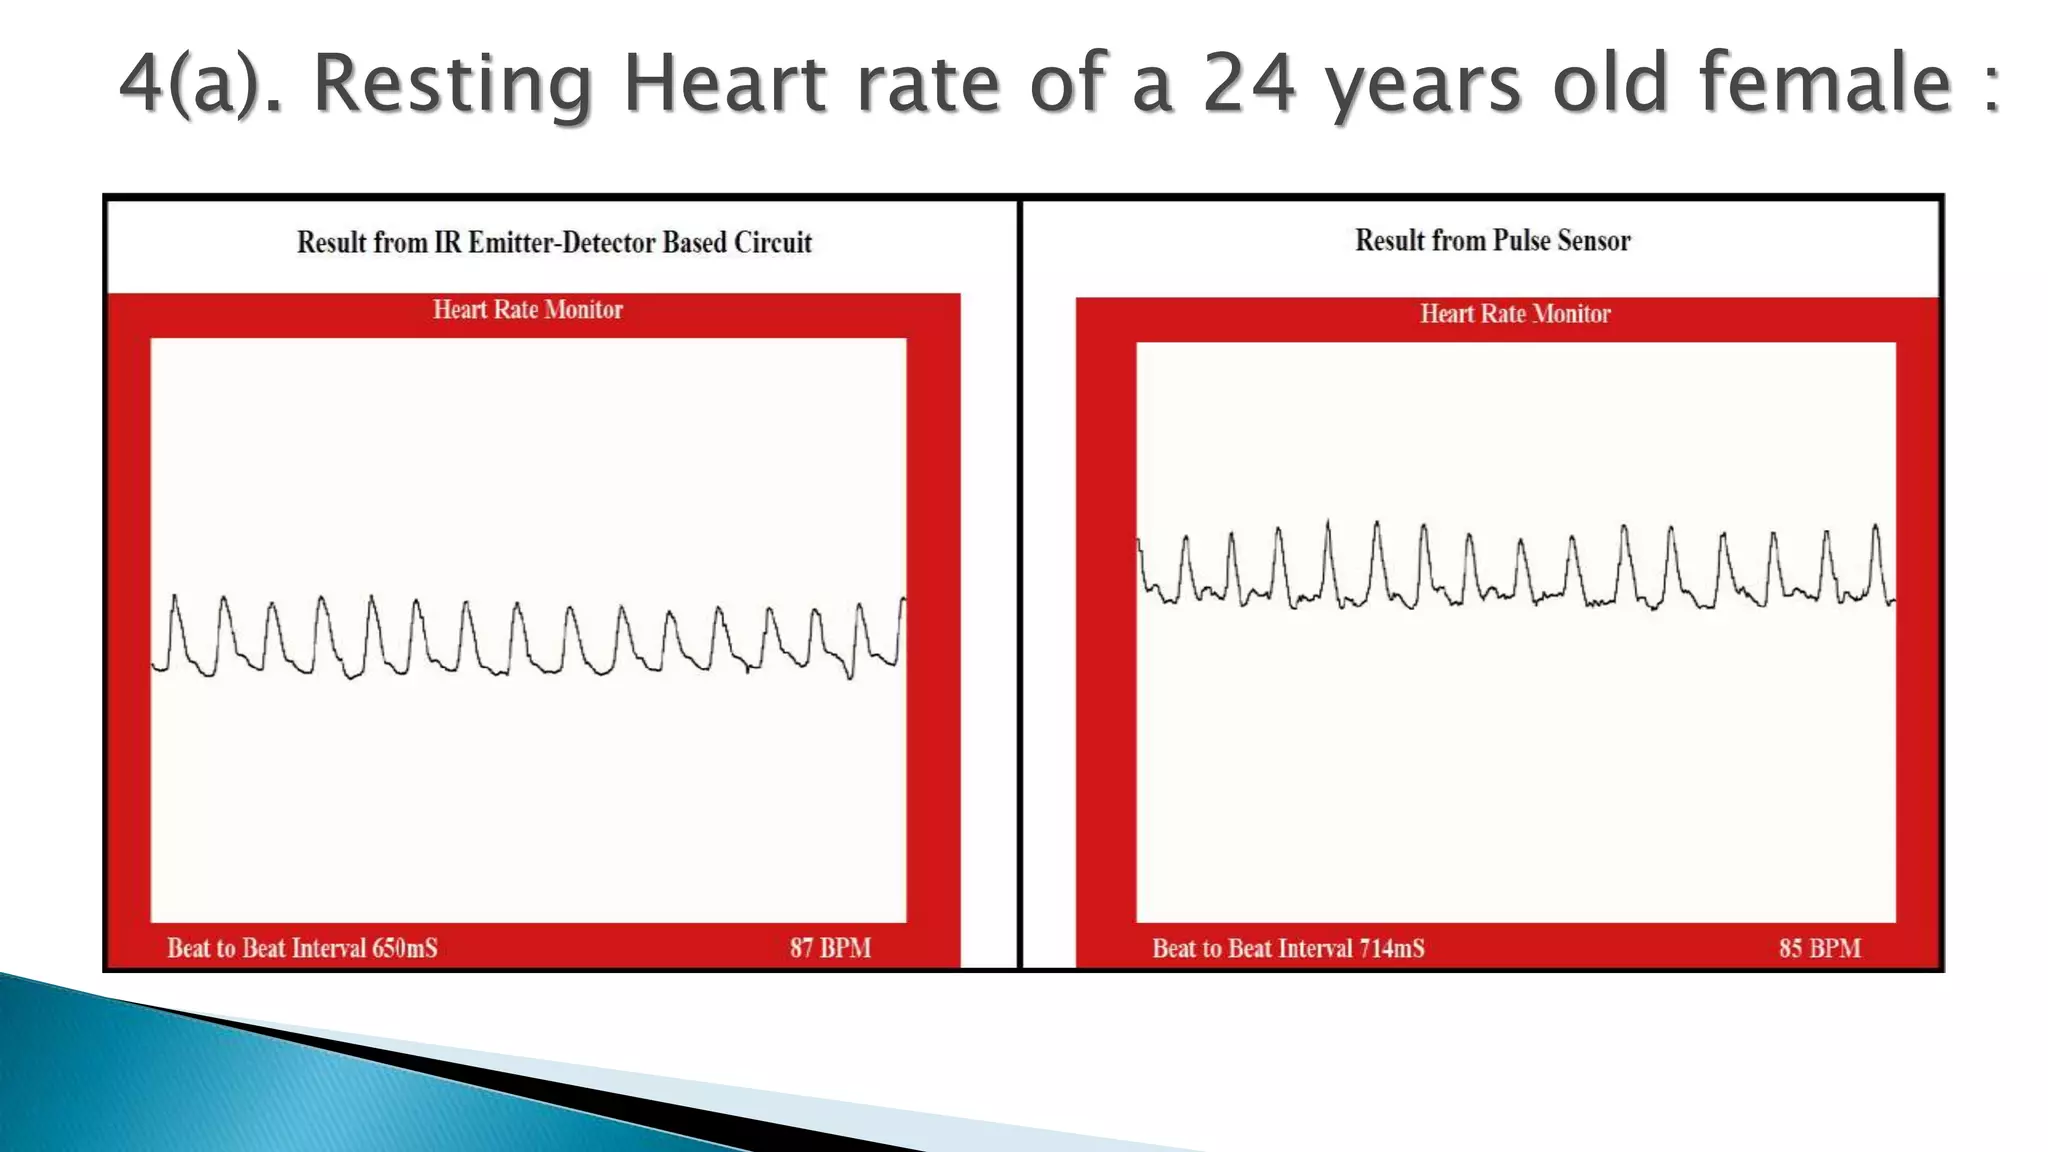
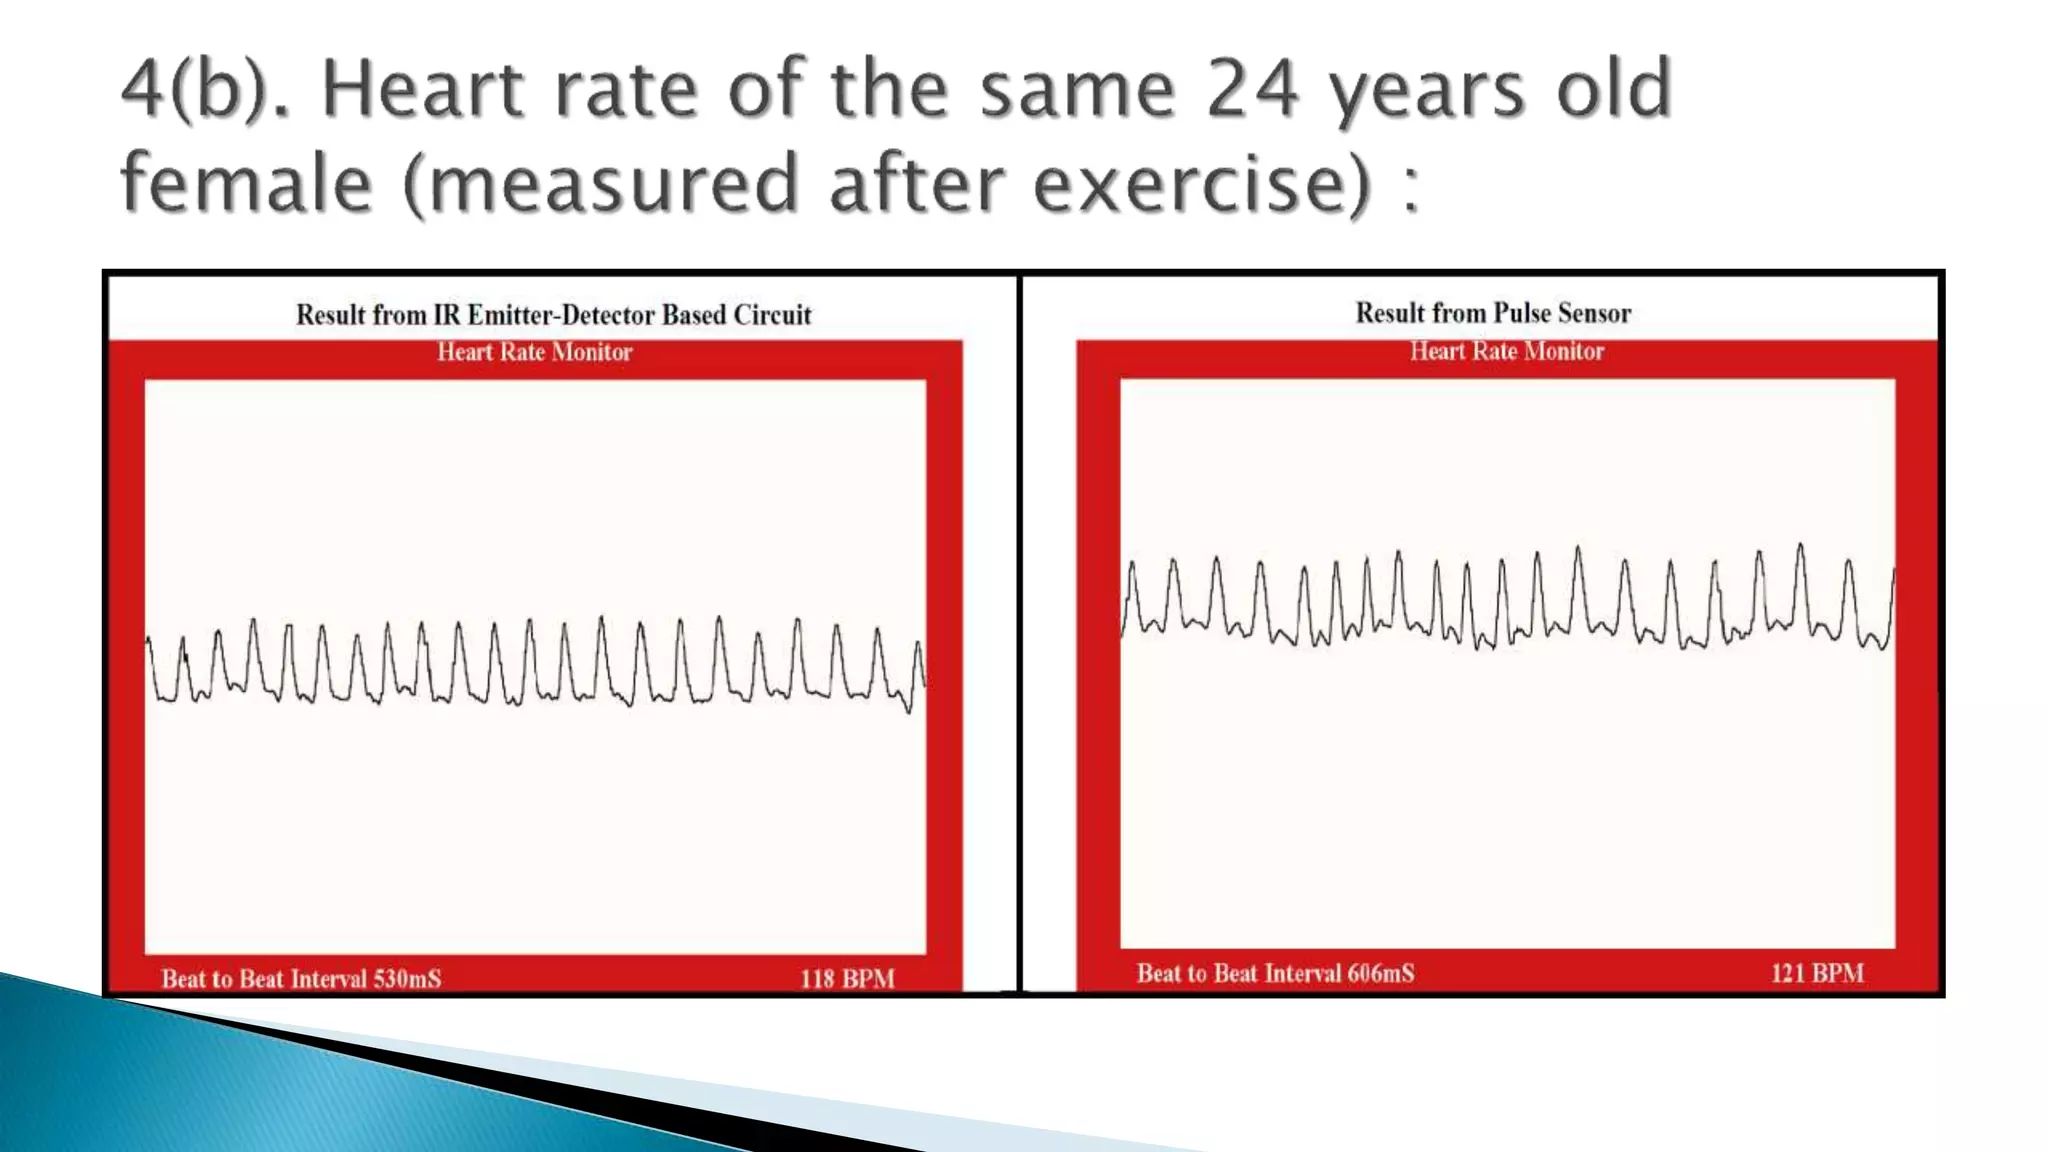
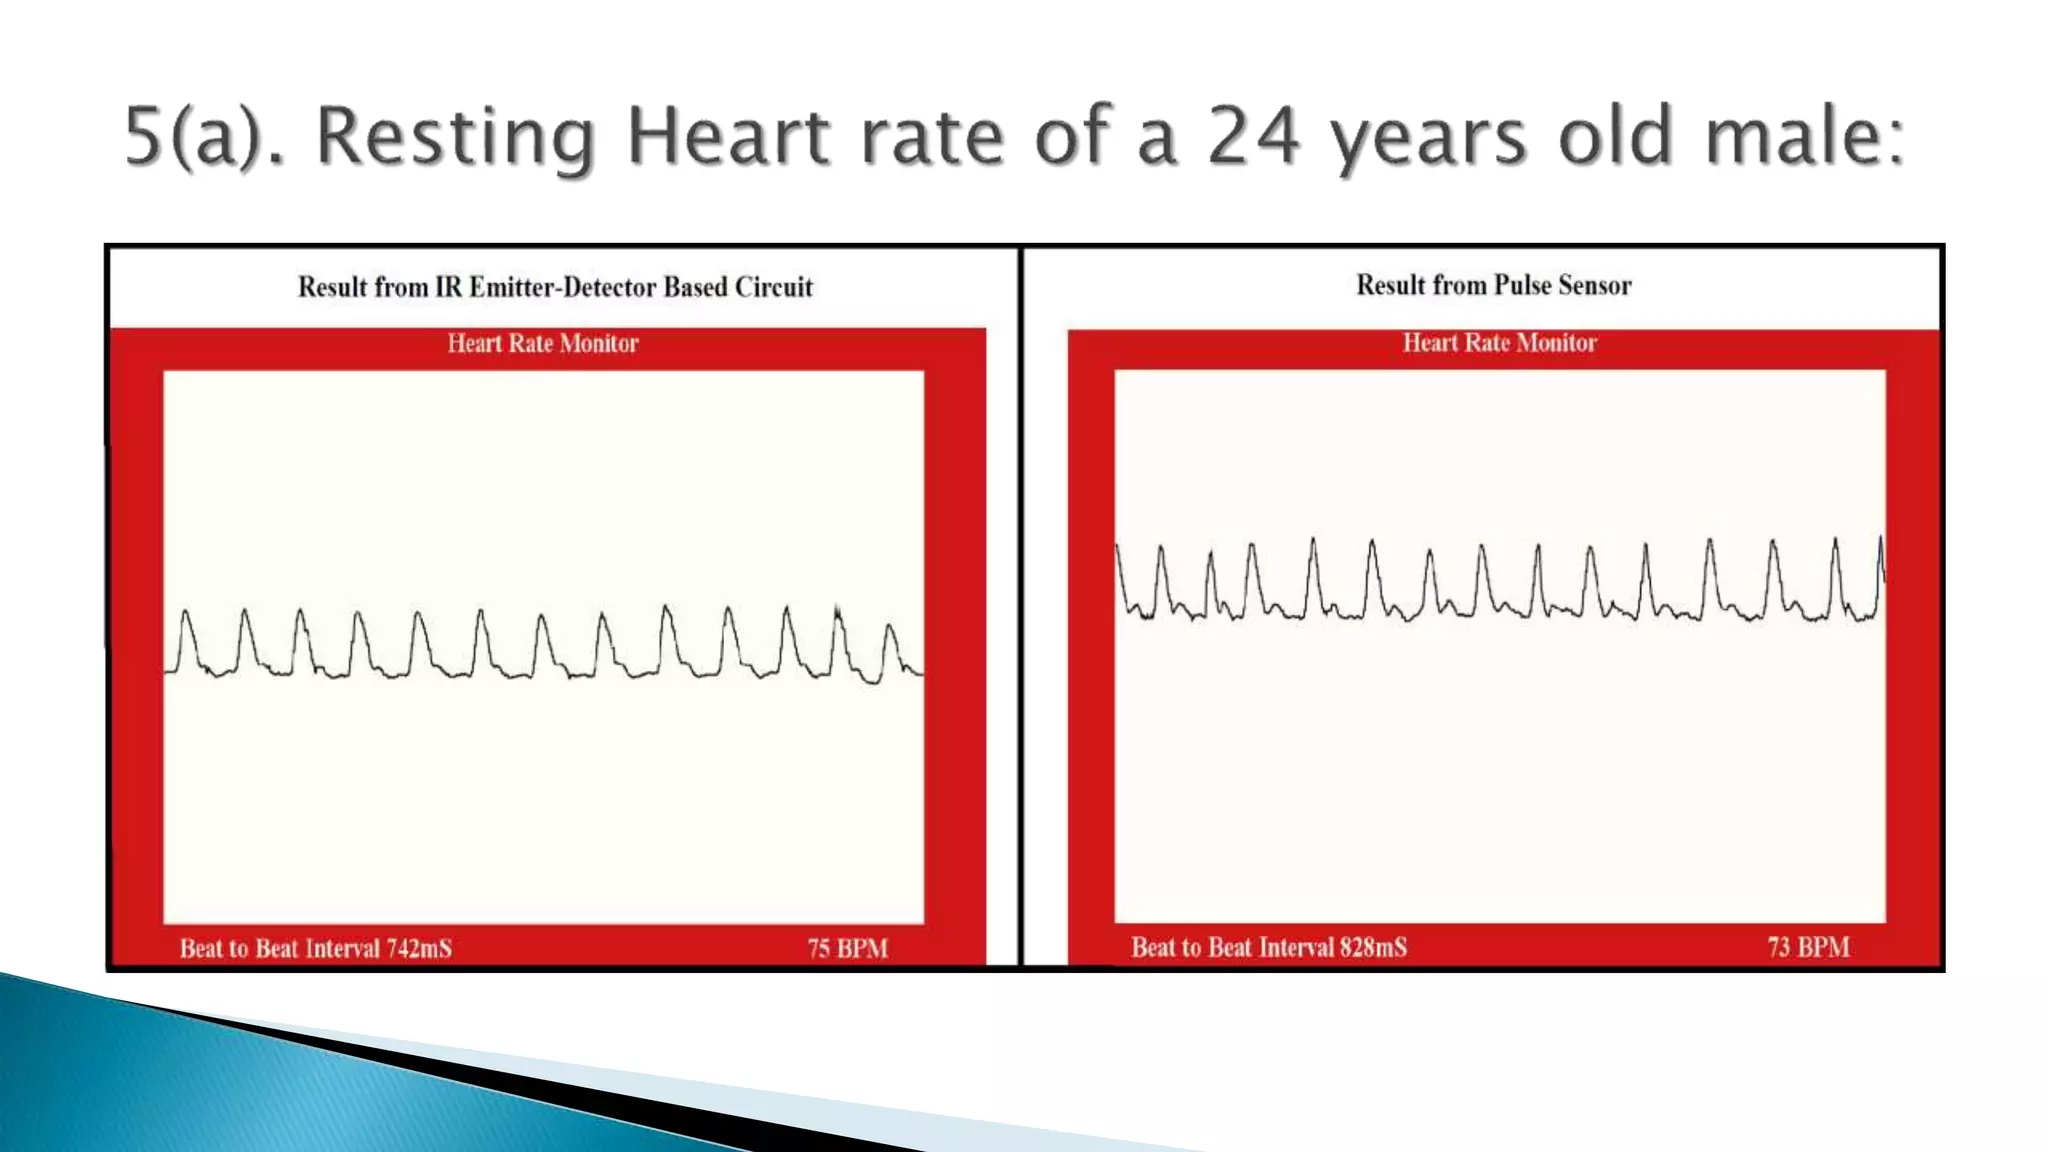
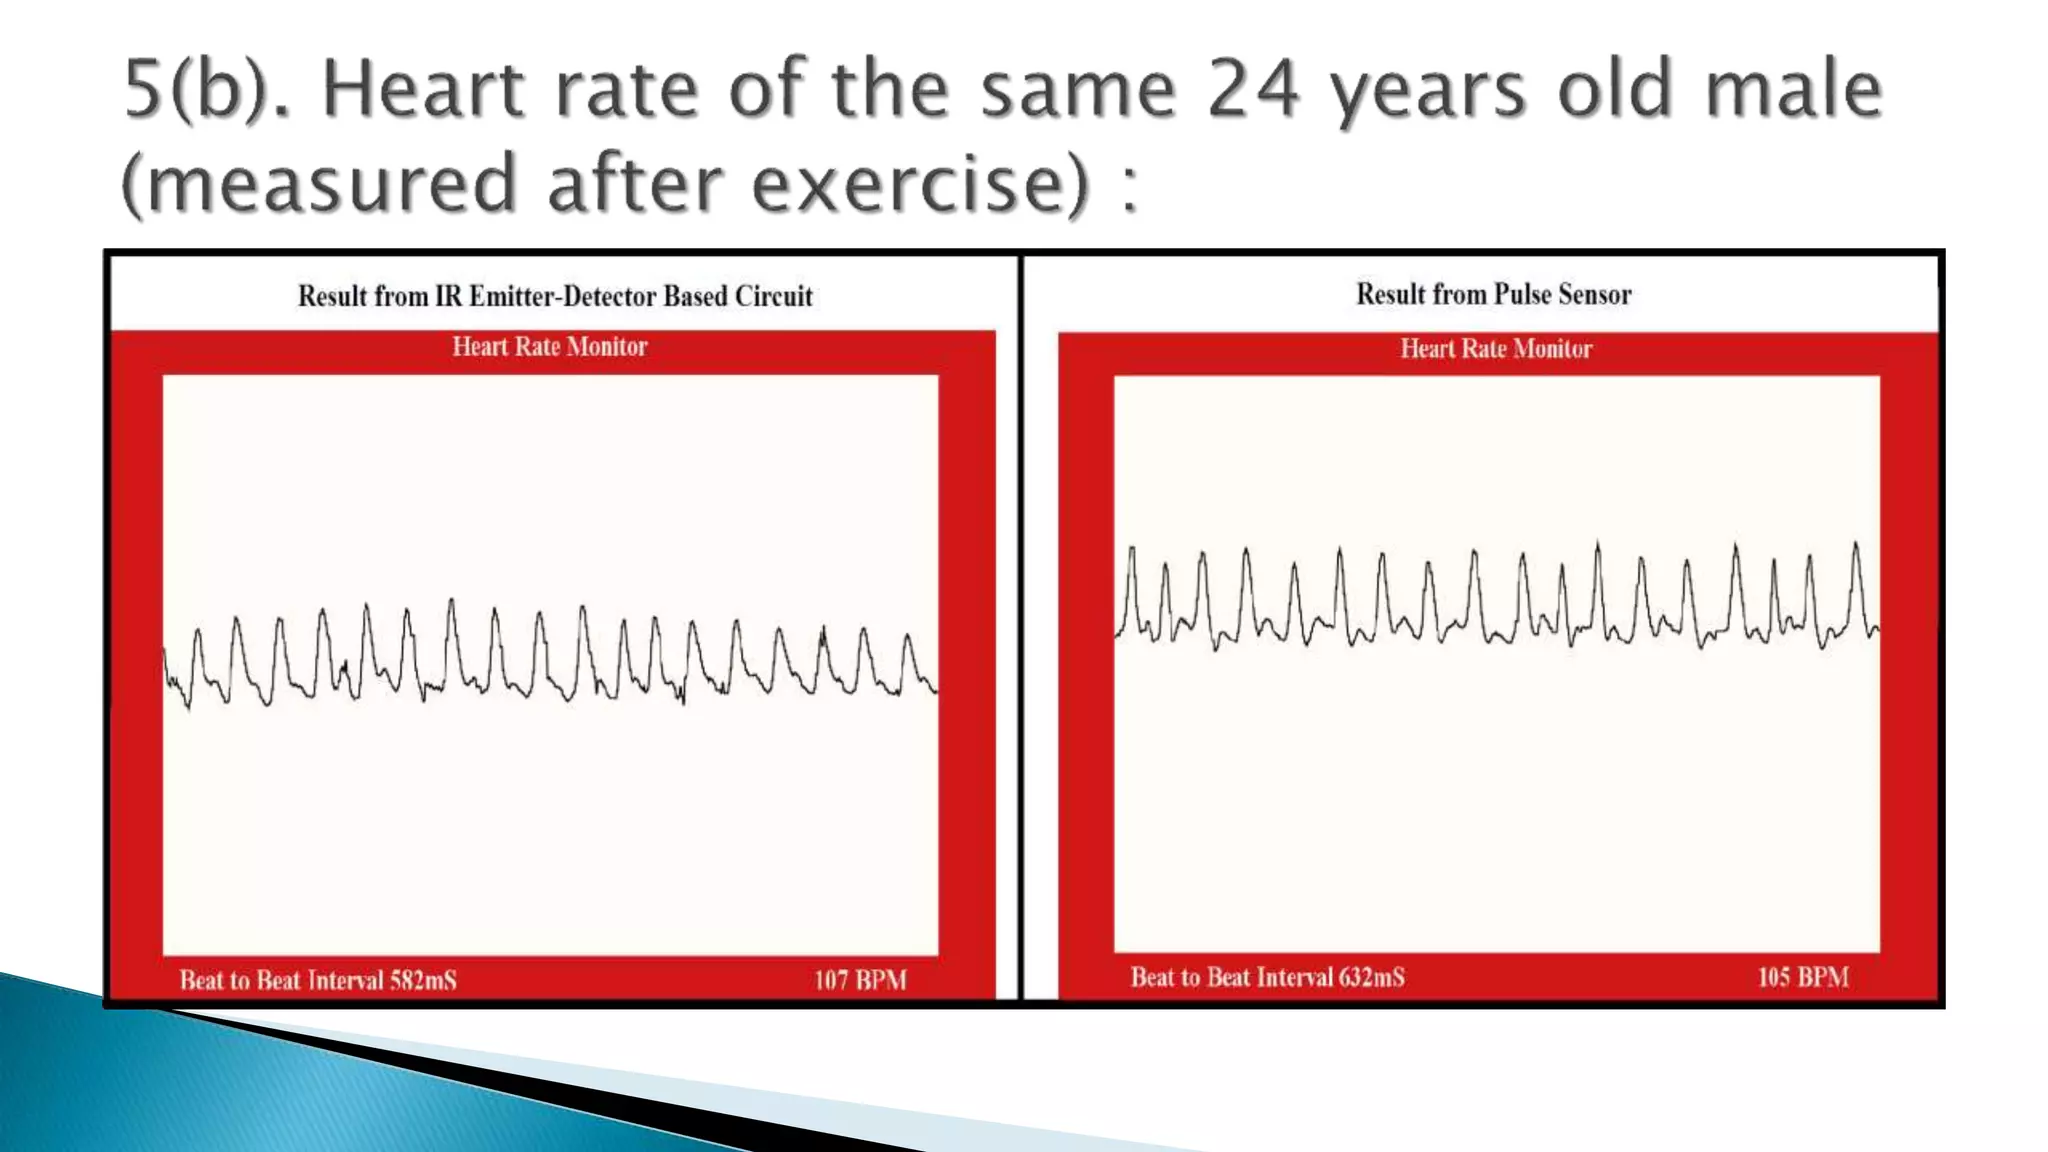
Presented by:
Md. Redwan Islam (1006066)
Md. Rayhan Khan (1006067)
Nujhat Tasneem (1006078)
Nishith Nirjhar Chakrabarty (1006088)
Rubayet Binte Nazmul (10060129)
Tahsin Adnan (0806110)
Measure the heart rate of human
being using low cost devices such as
IR transmitter receiver, Arduino and
some other cheap hardware.
Hardware
required:
•Arduino Uno Board
•Resistance
•Capacitance
•Voltage Amplifier
•IR Emitter-Detector Pair
Software
Required
•Arduino
•Processing
 Photoplethysmography (PPG) is a simple and low-
cost optical technique that can be used to detect
blood volume changes in the microvascular bed of
tissue. PPG sensors use a light-based technology
to sense the rate of blood flow as controlled by the
heart's pumping action.
 It is often used non-invasively to make
measurements at the skin surface.
 It can provide valuable information about the
cardiovascular system.
Peak (P)
Trough(T)
Light from IR
Emitter to blood
IR light reflected
from circulating
blood
Voltage
variation in IR
Detector
Amplification
by Op-Amp
Low Pass
filtration of data
Feed to Arduino
for calculation
Processing sketch
(heartbeat
monitoring)
 The intensity of IR reflected back from the skin is
proportional to the blood volume passed through
the vein.
 The voltage created at the output of the receiver is
proportional to the intensity of the IR reflected
back to the receiver.
 The voltage output of the IR receiver is relatively low.
 The voltage is needed to be amplified in order for the Arduino
to understand.
 The output of the Amplifier has both the main cardiac signal
and the noise amplified.
 The output is fed to the low pass filter for removal of noise.
 Two first order RC filter of corner frequency of around 16Hz is
cascaded in our project.
 The first order RC filter corner frequency is given by the
following equation :
 With R= 100 Ω and C = 100µF , The corner frequency
becomes –
f=
1
2∗π∗100 ∗100∗10−6=16Hz
 The corner frequency chosen such that sufficient
amount of noise is removed and at the same time
the actual characteristic wave shape of the cardiac
cycle can be observed.
 By trail and error, it was observed that two filters
were sufficient for the reduction of high frequency
components and observation of the smooth wave
shape. Therefore, only two RC filters were used.
variable initialization
and calling the
interrupt function
Setup Arduino timer
counter
Initiate Heart Rate
Counter interrupt
service routine
Detect whether a
heart beat is present
Determine the peak
and trough
Determine the event
of threshold
value(50% of the
total amplitude)
At every 250
millisecond, check if
there is a heart beat
Determine Beat to
Beat Interval
Take average of last
10 Beat to Beat
Interval values
Calculate BPM from
Beat to Beat interval
Send data to Serial
Port
Let Processing plot
the shape of Cardiac
cycle and show Heart
rate
 In order to get a reliable measurement of beat to beat interval,
it is important to have a regular sample rate
 We can do this by taking data from the pulse-sensing circuit
at every 2 millisecond
 This can be done simply by using Timer 2 of the Arduino Uno
board and setting it up such that it will throw an interrupt at
every 2 milisecond(sample rate = 500 Hz)
 We derive a frequency from the CPU clock(16 MHz) to run the
Timer2 clock by dividing it by prescaler 256 (
16MHz
256
= 62.5KHz)
 We need to throw interupt at every 2 millisecond. To get a
delay of 2 ms we need to set the Top count accordingly, which
can be determined by –
𝑇𝑜𝑝 𝐶𝑜𝑢𝑛𝑡 =
𝐶𝑙𝑜𝑐𝑘 𝑆𝑝𝑒𝑒𝑑
𝑃𝑟𝑒𝑠𝑐𝑎𝑙𝑒𝑟 𝑉𝑎𝑙𝑢𝑒
× 𝑅𝑒𝑞𝑢𝑖𝑟𝑒𝑑 𝑑𝑒𝑙𝑎𝑦 − 1 = 124
 The ISR (Interrupt Service Routine) keeps track of whether a
beat is present or not and calculates the BPM.
 We consider a threshold value which is 50% of the total PPG
signal Amplitude range.
 If after a certain time, the output is greater than the threshold
value, then we can say there is a heartbeat and the Beat to
Beat interval counting procedure is started.
 The maximum and minimum PPG values are constantly
updated from which we get the PPG signal amplitude range
and hence the threshold value.
 Initially, the threshold value is considered arbitrarily to be at
the midpoint of the ADC range.
 BPM is counted with respect to the average of several Beat to
Beat intervals.
 Formula for BPM:
 We consider the beat interval values from the second beat and
store the value in a 10 element array.
 We also use another array to hold the beat interval values.
 After getting a pulse, the first array is shifted over so that the
oldest beat interval value falls out of position 0 and newer one
gets put into position 9.
 These interval values are added to the second array.
 We take an average of the last 10 beat to beat interval values
and calculate BPM.
 Before sending data to the Arduino Serial port but we use
some letter as prefixes to these values in order to
differentiate them (so that Processing can understand which
data is of what) .
 ‘O’ denotes the data currently in the serial port is the signal
output. Similarly the letters ‘B’ and ‘D’ denote BPM and beat to
beat interval respectively.
 The flag “h_beat” gets set when there is a heart beat.
 Circuit output, BPM value and beat interval values are sent to
serial port of Arduino and the “h_beat” flag is reset for next
time.
 Processing software is a sketching software.
 Has a language similar to Arduino.
 Shows everything that the Arduino “sees”.
 It can read the serial port of Arduino and visualize the data it
receives.
 The Processing code is set up such that it reads the incoming
Serial data from the available serial port and plots the relevant
value one by one in the drawing window.
 A GUI built by Processing also shows the Heart Rate and the
Inter Beat Interval.
 Arduino sends a character before every data is sent. Tracking
that character, the processing code recognizes where the
number should be dealt in, in the GUI.
 Normal resting heart rates for children 10 years and older,
and adults (including seniors) range anywhere from 60 beats
per minute up to 100 beats per minute.
 Ideally we want to have a resting heart rate between 70-90
beats per minute.
 For well-trained athletes the average heart rate is 40 - 60
beats per minute.
4(a). Resting Heart rate of a 24 years old female :
 PPG signal and BPM that we get from IR Emitter-Detector and
Arduino based circuit are pretty similar to those resulting
from the pulse sensor.
 If the user puts his/her index finger on the IR emitter-
Detector pair, we get better result.
 Cost of pulse sensor is 900 tk.
 Total cost of our circuit ( Heart rate monitor with IR emitter -
detector pair) is 266 tk.
 Cost has reduced almost 3 times.
 Output becomes unstable if the user bounces finger or apply
varying pressure. So, we should use clip to avoid this variation
and get stable output.
 Bit noisier output.
 The dichroic notch of the PPG signal often cannot be
distinguished in the circuit’s output waveform
Biomedical Instrumentation Presentation on Infrared Emitter-Detector and Arduino based low cost Heart Rate Monitor

Biomedical Instrumentation Presentation on Infrared Emitter-Detector and Arduino based low cost Heart Rate Monitor

  • 1.
    Presented by: Md. RedwanIslam (1006066) Md. Rayhan Khan (1006067) Nujhat Tasneem (1006078) Nishith Nirjhar Chakrabarty (1006088) Rubayet Binte Nazmul (10060129) Tahsin Adnan (0806110)
  • 2.
    Measure the heartrate of human being using low cost devices such as IR transmitter receiver, Arduino and some other cheap hardware.
  • 3.
    Hardware required: •Arduino Uno Board •Resistance •Capacitance •VoltageAmplifier •IR Emitter-Detector Pair Software Required •Arduino •Processing
  • 4.
     Photoplethysmography (PPG)is a simple and low- cost optical technique that can be used to detect blood volume changes in the microvascular bed of tissue. PPG sensors use a light-based technology to sense the rate of blood flow as controlled by the heart's pumping action.  It is often used non-invasively to make measurements at the skin surface.  It can provide valuable information about the cardiovascular system.
  • 5.
  • 6.
    Light from IR Emitterto blood IR light reflected from circulating blood Voltage variation in IR Detector Amplification by Op-Amp Low Pass filtration of data Feed to Arduino for calculation Processing sketch (heartbeat monitoring)
  • 8.
     The intensityof IR reflected back from the skin is proportional to the blood volume passed through the vein.  The voltage created at the output of the receiver is proportional to the intensity of the IR reflected back to the receiver.
  • 9.
     The voltageoutput of the IR receiver is relatively low.  The voltage is needed to be amplified in order for the Arduino to understand.  The output of the Amplifier has both the main cardiac signal and the noise amplified.  The output is fed to the low pass filter for removal of noise.
  • 10.
     Two firstorder RC filter of corner frequency of around 16Hz is cascaded in our project.  The first order RC filter corner frequency is given by the following equation :  With R= 100 Ω and C = 100µF , The corner frequency becomes – f= 1 2∗π∗100 ∗100∗10−6=16Hz
  • 11.
     The cornerfrequency chosen such that sufficient amount of noise is removed and at the same time the actual characteristic wave shape of the cardiac cycle can be observed.  By trail and error, it was observed that two filters were sufficient for the reduction of high frequency components and observation of the smooth wave shape. Therefore, only two RC filters were used.
  • 12.
    variable initialization and callingthe interrupt function Setup Arduino timer counter Initiate Heart Rate Counter interrupt service routine Detect whether a heart beat is present Determine the peak and trough Determine the event of threshold value(50% of the total amplitude) At every 250 millisecond, check if there is a heart beat Determine Beat to Beat Interval Take average of last 10 Beat to Beat Interval values Calculate BPM from Beat to Beat interval Send data to Serial Port Let Processing plot the shape of Cardiac cycle and show Heart rate
  • 13.
     In orderto get a reliable measurement of beat to beat interval, it is important to have a regular sample rate  We can do this by taking data from the pulse-sensing circuit at every 2 millisecond  This can be done simply by using Timer 2 of the Arduino Uno board and setting it up such that it will throw an interrupt at every 2 milisecond(sample rate = 500 Hz)
  • 14.
     We derivea frequency from the CPU clock(16 MHz) to run the Timer2 clock by dividing it by prescaler 256 ( 16MHz 256 = 62.5KHz)  We need to throw interupt at every 2 millisecond. To get a delay of 2 ms we need to set the Top count accordingly, which can be determined by – 𝑇𝑜𝑝 𝐶𝑜𝑢𝑛𝑡 = 𝐶𝑙𝑜𝑐𝑘 𝑆𝑝𝑒𝑒𝑑 𝑃𝑟𝑒𝑠𝑐𝑎𝑙𝑒𝑟 𝑉𝑎𝑙𝑢𝑒 × 𝑅𝑒𝑞𝑢𝑖𝑟𝑒𝑑 𝑑𝑒𝑙𝑎𝑦 − 1 = 124
  • 15.
     The ISR(Interrupt Service Routine) keeps track of whether a beat is present or not and calculates the BPM.  We consider a threshold value which is 50% of the total PPG signal Amplitude range.  If after a certain time, the output is greater than the threshold value, then we can say there is a heartbeat and the Beat to Beat interval counting procedure is started.
  • 16.
     The maximumand minimum PPG values are constantly updated from which we get the PPG signal amplitude range and hence the threshold value.  Initially, the threshold value is considered arbitrarily to be at the midpoint of the ADC range.
  • 17.
     BPM iscounted with respect to the average of several Beat to Beat intervals.  Formula for BPM:
  • 18.
     We considerthe beat interval values from the second beat and store the value in a 10 element array.  We also use another array to hold the beat interval values.  After getting a pulse, the first array is shifted over so that the oldest beat interval value falls out of position 0 and newer one gets put into position 9.  These interval values are added to the second array.  We take an average of the last 10 beat to beat interval values and calculate BPM.
  • 19.
     Before sendingdata to the Arduino Serial port but we use some letter as prefixes to these values in order to differentiate them (so that Processing can understand which data is of what) .  ‘O’ denotes the data currently in the serial port is the signal output. Similarly the letters ‘B’ and ‘D’ denote BPM and beat to beat interval respectively.  The flag “h_beat” gets set when there is a heart beat.  Circuit output, BPM value and beat interval values are sent to serial port of Arduino and the “h_beat” flag is reset for next time.
  • 20.
     Processing softwareis a sketching software.  Has a language similar to Arduino.  Shows everything that the Arduino “sees”.  It can read the serial port of Arduino and visualize the data it receives.
  • 21.
     The Processingcode is set up such that it reads the incoming Serial data from the available serial port and plots the relevant value one by one in the drawing window.  A GUI built by Processing also shows the Heart Rate and the Inter Beat Interval.  Arduino sends a character before every data is sent. Tracking that character, the processing code recognizes where the number should be dealt in, in the GUI.
  • 22.
     Normal restingheart rates for children 10 years and older, and adults (including seniors) range anywhere from 60 beats per minute up to 100 beats per minute.  Ideally we want to have a resting heart rate between 70-90 beats per minute.  For well-trained athletes the average heart rate is 40 - 60 beats per minute.
  • 26.
    4(a). Resting Heartrate of a 24 years old female :
  • 30.
     PPG signaland BPM that we get from IR Emitter-Detector and Arduino based circuit are pretty similar to those resulting from the pulse sensor.  If the user puts his/her index finger on the IR emitter- Detector pair, we get better result.
  • 31.
     Cost ofpulse sensor is 900 tk.  Total cost of our circuit ( Heart rate monitor with IR emitter - detector pair) is 266 tk.  Cost has reduced almost 3 times.
  • 32.
     Output becomesunstable if the user bounces finger or apply varying pressure. So, we should use clip to avoid this variation and get stable output.  Bit noisier output.  The dichroic notch of the PPG signal often cannot be distinguished in the circuit’s output waveform