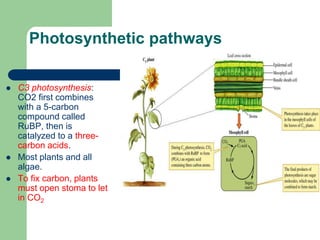
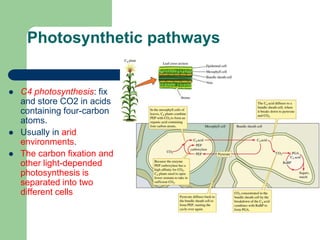
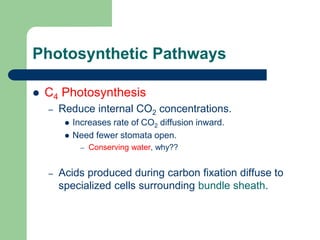
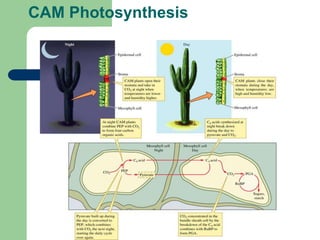
Biology 205
Ecology and Adaptation
Energy and
nutrient relations
Dr. Erik D. Davenport
Outline
 Review of the lecture 6: water relations
 What are the energy sources?
 Plants take in energy: Photosynthesis in
Ecology!!!
 What environmental factors regulate the
intakes of energy and nutrients for plants
and animals?
 Animals take in energy: Optimal Foraging
Water Concentration
 Water is not pure in
the environments.
 There are many
substrates could
dissolve into water.
 Which could dilute
water (less water
concentration)
Water availability
 What determine whether an organism tends
to lose water or gain water from the
environment?
The tendency of water to move down water
concentrations, Water will move from high water
concentration place to low water concentration
place.
How is the water content of air
measured?
 The quantity of water vapor in the air is expressed conveniently in
relative terms:
Relative humidity = (x 100)
 Water vapor density is measured as the amount of water vapor per
unit volume of air (how much water in the air).
 Saturation water vapor density is measured as the quantity of water
vapor air can potentially hold (how much water the air can hold).
 Temperature strongly influence the relative humidity -- Warm
air hold more water vapor than cold air!!!!
densityorwater vapSaturation
densityrwater vapo
Relative Humidity
 Which color
represents water
vapor density
 Which color
represents
saturation water
vapor density?
True or False?
 If the water content (water vapor density) in the air is
constant. Increasing the air temperature will cause
an increase of relative humidity.
 This statement is True or False?
Water and salt balance in aquatic
environments
Marine and freshwater organisms use complementary
mechanisms for water and salt regulation.
 Most marine invertebrates maintain an internal concentration of
solute equivalent to that in the seawater around them.
(isosmotic organisms)
 Sharks, skates generally elevate the concentration of solutes in
their blood to levels slight hyperosmotic to seawater. So they
slowly gain water through osmosis, and had to excrete excess
water through urine.
 In contrast to most marine invertebrates and
sharks, marine bony fish have body fluids that
are strongly hypoosmotic (less salts) to the
surrounding medium.
 They will lose the water to the environments.
 Marine bony fish make up this by drinking.
 However, they have the specialized cell at the
gill to excrete the excess salts to the surrounding
seawater.
Other Marine fishes -- Marine
bony fish
How is energy and nutrients acquired
??
Energy sources
Organisms use one of the three main energy sources:
light, organic molecules, and inorganic molecules.
We can group organisms by how they obtain energy
(trophic biology):
– Autotrophs (use inorganic sources of both carbon and
energy)
 Photosynthetic: use CO2 and light. (plants)
 Chemosynthetic: use inorganic molecules as sources of
carbon and energy. (some bacteria)
– Heterotrophs: use organic molecules as a source of carbon
and energy.
Copyright © The McGraw-Hill Companies, Inc. Permission required for reproduction or display.
Trophic diversity across biological kingdoms
Figure 6.2
6-1
Using light and CO2
 The solar powered biosphere:
 Light travel through space as a wave, so it has the
frequency and wavelength.
 The visible light (the light we can see by eye), is
called photosynthetically active radiation (PAR), with
the wavelength between about 400nm to 700nm.
 Ecologists measure PAR as photon flux density (is
the number of photons striking a square meter
surface each second).
Solar - Powered Biosphere
 Photon: Particle of light bears energy.
– Infrared (IR) Long-wavelength, low energy.
 Interacts with matter, increasing motion.
– Ultraviolet (UV) Short wavelength, high energy.
 Can destroy biological machinery.
Copyright © The McGraw-Hill Companies, Inc. Permission required for reproduction or display.
Photosynthetically active radiation
Figure 6.3
6-2 Source: Larcher 1995, after Kairiukstis 1967
Landscapes, water, and organisms can all change the amount and
quality of light reaching an area.
Photosynthetic pathways
 C3 photosynthesis:
CO2 first combines
with a 5-carbon
compound called
RuBP, then is
catalyzed to a three-
carbon acids.
 Most plants and all
algae.
 To fix carbon, plants
must open stoma to let
in CO2
Photosynthetic pathways
 C4 photosynthesis: fix
and store CO2 in acids
containing four-carbon
atoms.
 Usually in arid
environments.
 The carbon fixation and
other light-depended
photosynthesis is
separated into two
different cells
Photosynthetic Pathways
 C4 Photosynthesis
– Reduce internal CO2 concentrations.
 Increases rate of CO2 diffusion inward.
 Need fewer stomata open.
– Conserving water, why??
– Acids produced during carbon fixation diffuse to
specialized cells surrounding bundle sheath.
Photosynthetic Pathways
 CAM Photosynthesis
– (Crassulacean Acid Metabolism)
– Limited to succulent plants in arid and semi-arid
environments.
 Carbon fixation takes place at night.
– Reduced water loss.
 Low rates of photosynthesis.
 Extremely high rates of water use efficiency.
CAM Photosynthesis
Using organic molecules
 Hetertophic organisms use organic
molecules both as source of carbon and an
energy, which ultimately, on the carbon and
energy fixed by autotroph.
– Herbivores: eat plants
– Carnivores: eat meats
– Detritivores: feed on nonliving organic matter
Chemical composition and
Nutrient Requirements
 Chemical composition of organisms is very similar:
 Five important elements: carbon, oxygen, hydrogen, nitrogen,
and phosphorus, these element consist up to 93% to 97% of
total biomass.
 C:N ratio could be an important indicator of protein contents
 A high C:N ration indicate a low nitrogen content, also a low
protein content.
 Trace metals are also essential for plant and animal nutrition,
such as calcium, sulfur, zinc, copper, etc…
Copyright © The McGraw-Hill Companies, Inc. Permission required for reproduction or display.
Ratio of carbon to nitrogen
Figure 6.7
6-6 Source: Spector 1956
herbivores
 Herbivores had to overcome the physical and
chemical defense of plants.
 Physical defense:
– thorns
 Chemical defense:
– tough tissue with large amount of cellulose and
lignin.
– higher C:N ratio for low nutrition value
– Some toxin or digest-reducing substrates
Copyright © The McGraw-Hill Companies, Inc. Permission required for reproduction or display.
Variation in C:N ratios in pine forest
Figure 6.9
6-7 Source: Klemmedson 1975
Detritivores
 Consume food rich in carbon and energy, but
poor in nitrogen.
– Dead leaves may have half nitrogen content of
living leaves.
 Fresh detritus may still have considerable
chemical defenses present.
Carnivores
 Most of the preys developed defense
mechanisms:
– Camouflage.
– Defensive spines, shell, repellents, and poisons.
– Run fast.
– Take refuge in burrows.
Copyright © The McGraw-Hill Companies, Inc. Permission required for reproduction or display.
Predators as agents of natural selection
Figure 6.14
6-11
Copyright © The McGraw-Hill Companies, Inc. Permission required for reproduction or display.
Size of pumas and
their prey
6-13 Source: Iriate et al. 1990
Size-selective predation:
predator select the prey based on its own size.
Energy limitation
The rate at which organisms can take in energy is
limited.
– The external energy could be limited to organisms.
– Even the external energy sources is not limited in the
environments, organisms energy intake is limited by internal
constrains.
– Limits on potential rate of energy intake by plants have
been demonstrated by studying response of photosynthetic
rate to photon flux density. Limits on potential rate of energy
intake by animals have been demonstrated by studying
relationship between feeding rate and food availability
Photo influx and photosynthesis
curves
Pmax and Isat
Photon Flux and Photosynthetic
Response Curves
 Rate of photosynthesis increases linearly
with photon flux density at low light
intensities, rises more slowly with
intermediate light intensities, and tends to
level off at high light intensities.
 Response curves for different species
generally level off at different maximum
photosynthesis rates.
“sun” and “shade” plants
 “Shade” plants:
– Low Pmax, the rates of photosynthesis level off at low
levels.
– Low Isat, photosynthesis saturate at low light intensity, use
light more efficiency.
– High light will damage the plants.
 “Sun” plants:
– High Pmax at high light intensity.
– High Isat, photosynthesis saturate at high light intensity.
– However, the photosynthesis rates are lower than “shade”
plant at very low light environments.
Copyright © The McGraw-Hill Companies, Inc. Permission required for reproduction or display.
Contrasting photosynthetic response curves
Figure 6.20
6-17 Source: Ehleringer, Björkman, and Mooney 1976, after Nobel 1977
Response curves
for different
species generally
level off at
different maximum
photosynthesis
rates.
Food density and animal functional
response
 Functional response: when you gradually
increase the amount of food availability to a
hungry animal, its rate of feeding increases
and then levels off at certain food density.
 Three types of functional response.
Copyright © The McGraw-Hill Companies, Inc. Permission required for reproduction or display.
Theoretical functional response curves
Figure 6.21
6-18
Type 1: feeding increases
linearly as food density
increases - levels off at
maximum
Type 2:Feeding rate rises
in proportion to food
density.
Type 3: Feeding rate
increases most rapidly at
intermediate densities
(S-shaped).
Type 2 functional responses are most popular
Optimal foraging theory
 Optimal foraging theory attempts to model how
organisms feed as an optimizing process
 When organisms have limited access to energy, the
natural selection is likely to favor individuals within a
population that are more effective at acquiring
energy.
 Organisms can not simultaneously maximize all of
their life functions, for example, allocation of energy
to one function, such as growth or reproduction, will
reduce the energy to other functions, such as
defense.
 A compromise of energy demands.
Attributes that affect intake of energy
 The number of the prey (abundance of a
potential food items), it is expressed as the
number of prey encountered by the predator
per unit of time: Ne
 The amount of energy, or costs, expended
by the predator while search for prey: Cs
 The time spent processing prey in activities
such as cracking, shells, fighting, and is
expressed as handling time: H
Model for prey choice
 Rate of energy intake of
a predator is
represented as: E/T, E
is intake energy, and T
is time:
(intake rate 1)
111
11
HNe
CsENe
T
E



Ne1 is the number of prey 1 encountered per unit of time
E1 is the energy gained by feeding on one prey 1 minus
the cost of handling.
Cs is the cost of searching prey.
H1 is the time required for “handling” one prey 1.
How about selection of prey?
 When predator feed on two prey:
(intake rate 2)
22111
)22()11(
HNeHNe
CsENeCsENe
T
E



22111
)22()11(
HNeHNe
CsENeCsENe
T
E



If intake rate 1> intake rate 2,
predator will feed on prey 1.
otherwise, will feed on prey 2
Copyright © The McGraw-Hill Companies, Inc. Permission required for reproduction or display.
Optimal foraging theory
Figure 6.24
6-21 Source: Werner and Mittelbach 1981
Bluegill Sunfish
Optimal Foraging By Plants
 Limited supplies of energy for allocation to
leaves, stems and roots.
 Bloom suggested plants adjust allocation in
such a manner that all resources are equally
limited.
– Appear to allocate growth in a manner that
increases rate of acquisition of resources in
shortest supply.
Copyright © The McGraw-Hill Companies, Inc. Permission required for reproduction or display.
Soil fertility and ratio of root:shoot biomass
Figure 6.25
6-22 Source: Setälä and Huhta 1991
Copyright © The McGraw-Hill Companies, Inc. Permission required for reproduction or display.
Root:shoot ratios along nitrogen availability gradient
Figure 6.26
6-23 Source: Tilman and Cowan 1989

Biology 205 7

  • 1.
    Biology 205 Ecology andAdaptation Energy and nutrient relations Dr. Erik D. Davenport
  • 2.
    Outline  Review ofthe lecture 6: water relations  What are the energy sources?  Plants take in energy: Photosynthesis in Ecology!!!  What environmental factors regulate the intakes of energy and nutrients for plants and animals?  Animals take in energy: Optimal Foraging
  • 3.
    Water Concentration  Wateris not pure in the environments.  There are many substrates could dissolve into water.  Which could dilute water (less water concentration)
  • 4.
    Water availability  Whatdetermine whether an organism tends to lose water or gain water from the environment? The tendency of water to move down water concentrations, Water will move from high water concentration place to low water concentration place.
  • 5.
    How is thewater content of air measured?  The quantity of water vapor in the air is expressed conveniently in relative terms: Relative humidity = (x 100)  Water vapor density is measured as the amount of water vapor per unit volume of air (how much water in the air).  Saturation water vapor density is measured as the quantity of water vapor air can potentially hold (how much water the air can hold).  Temperature strongly influence the relative humidity -- Warm air hold more water vapor than cold air!!!! densityorwater vapSaturation densityrwater vapo
  • 6.
    Relative Humidity  Whichcolor represents water vapor density  Which color represents saturation water vapor density?
  • 7.
    True or False? If the water content (water vapor density) in the air is constant. Increasing the air temperature will cause an increase of relative humidity.  This statement is True or False?
  • 8.
    Water and saltbalance in aquatic environments Marine and freshwater organisms use complementary mechanisms for water and salt regulation.  Most marine invertebrates maintain an internal concentration of solute equivalent to that in the seawater around them. (isosmotic organisms)  Sharks, skates generally elevate the concentration of solutes in their blood to levels slight hyperosmotic to seawater. So they slowly gain water through osmosis, and had to excrete excess water through urine.
  • 9.
     In contrastto most marine invertebrates and sharks, marine bony fish have body fluids that are strongly hypoosmotic (less salts) to the surrounding medium.  They will lose the water to the environments.  Marine bony fish make up this by drinking.  However, they have the specialized cell at the gill to excrete the excess salts to the surrounding seawater. Other Marine fishes -- Marine bony fish
  • 10.
    How is energyand nutrients acquired ??
  • 11.
    Energy sources Organisms useone of the three main energy sources: light, organic molecules, and inorganic molecules. We can group organisms by how they obtain energy (trophic biology): – Autotrophs (use inorganic sources of both carbon and energy)  Photosynthetic: use CO2 and light. (plants)  Chemosynthetic: use inorganic molecules as sources of carbon and energy. (some bacteria) – Heterotrophs: use organic molecules as a source of carbon and energy.
  • 12.
    Copyright © TheMcGraw-Hill Companies, Inc. Permission required for reproduction or display. Trophic diversity across biological kingdoms Figure 6.2 6-1
  • 13.
    Using light andCO2  The solar powered biosphere:  Light travel through space as a wave, so it has the frequency and wavelength.  The visible light (the light we can see by eye), is called photosynthetically active radiation (PAR), with the wavelength between about 400nm to 700nm.  Ecologists measure PAR as photon flux density (is the number of photons striking a square meter surface each second).
  • 14.
    Solar - PoweredBiosphere  Photon: Particle of light bears energy. – Infrared (IR) Long-wavelength, low energy.  Interacts with matter, increasing motion. – Ultraviolet (UV) Short wavelength, high energy.  Can destroy biological machinery.
  • 15.
    Copyright © TheMcGraw-Hill Companies, Inc. Permission required for reproduction or display. Photosynthetically active radiation Figure 6.3 6-2 Source: Larcher 1995, after Kairiukstis 1967 Landscapes, water, and organisms can all change the amount and quality of light reaching an area.
  • 16.
    Photosynthetic pathways  C3photosynthesis: CO2 first combines with a 5-carbon compound called RuBP, then is catalyzed to a three- carbon acids.  Most plants and all algae.  To fix carbon, plants must open stoma to let in CO2
  • 17.
    Photosynthetic pathways  C4photosynthesis: fix and store CO2 in acids containing four-carbon atoms.  Usually in arid environments.  The carbon fixation and other light-depended photosynthesis is separated into two different cells
  • 18.
    Photosynthetic Pathways  C4Photosynthesis – Reduce internal CO2 concentrations.  Increases rate of CO2 diffusion inward.  Need fewer stomata open. – Conserving water, why?? – Acids produced during carbon fixation diffuse to specialized cells surrounding bundle sheath.
  • 19.
    Photosynthetic Pathways  CAMPhotosynthesis – (Crassulacean Acid Metabolism) – Limited to succulent plants in arid and semi-arid environments.  Carbon fixation takes place at night. – Reduced water loss.  Low rates of photosynthesis.  Extremely high rates of water use efficiency.
  • 20.
  • 21.
    Using organic molecules Hetertophic organisms use organic molecules both as source of carbon and an energy, which ultimately, on the carbon and energy fixed by autotroph. – Herbivores: eat plants – Carnivores: eat meats – Detritivores: feed on nonliving organic matter
  • 22.
    Chemical composition and NutrientRequirements  Chemical composition of organisms is very similar:  Five important elements: carbon, oxygen, hydrogen, nitrogen, and phosphorus, these element consist up to 93% to 97% of total biomass.  C:N ratio could be an important indicator of protein contents  A high C:N ration indicate a low nitrogen content, also a low protein content.  Trace metals are also essential for plant and animal nutrition, such as calcium, sulfur, zinc, copper, etc…
  • 23.
    Copyright © TheMcGraw-Hill Companies, Inc. Permission required for reproduction or display. Ratio of carbon to nitrogen Figure 6.7 6-6 Source: Spector 1956
  • 24.
    herbivores  Herbivores hadto overcome the physical and chemical defense of plants.  Physical defense: – thorns  Chemical defense: – tough tissue with large amount of cellulose and lignin. – higher C:N ratio for low nutrition value – Some toxin or digest-reducing substrates
  • 25.
    Copyright © TheMcGraw-Hill Companies, Inc. Permission required for reproduction or display. Variation in C:N ratios in pine forest Figure 6.9 6-7 Source: Klemmedson 1975
  • 26.
    Detritivores  Consume foodrich in carbon and energy, but poor in nitrogen. – Dead leaves may have half nitrogen content of living leaves.  Fresh detritus may still have considerable chemical defenses present.
  • 27.
    Carnivores  Most ofthe preys developed defense mechanisms: – Camouflage. – Defensive spines, shell, repellents, and poisons. – Run fast. – Take refuge in burrows.
  • 28.
    Copyright © TheMcGraw-Hill Companies, Inc. Permission required for reproduction or display. Predators as agents of natural selection Figure 6.14 6-11
  • 29.
    Copyright © TheMcGraw-Hill Companies, Inc. Permission required for reproduction or display. Size of pumas and their prey 6-13 Source: Iriate et al. 1990 Size-selective predation: predator select the prey based on its own size.
  • 30.
    Energy limitation The rateat which organisms can take in energy is limited. – The external energy could be limited to organisms. – Even the external energy sources is not limited in the environments, organisms energy intake is limited by internal constrains. – Limits on potential rate of energy intake by plants have been demonstrated by studying response of photosynthetic rate to photon flux density. Limits on potential rate of energy intake by animals have been demonstrated by studying relationship between feeding rate and food availability
  • 31.
    Photo influx andphotosynthesis curves Pmax and Isat
  • 32.
    Photon Flux andPhotosynthetic Response Curves  Rate of photosynthesis increases linearly with photon flux density at low light intensities, rises more slowly with intermediate light intensities, and tends to level off at high light intensities.  Response curves for different species generally level off at different maximum photosynthesis rates.
  • 33.
    “sun” and “shade”plants  “Shade” plants: – Low Pmax, the rates of photosynthesis level off at low levels. – Low Isat, photosynthesis saturate at low light intensity, use light more efficiency. – High light will damage the plants.  “Sun” plants: – High Pmax at high light intensity. – High Isat, photosynthesis saturate at high light intensity. – However, the photosynthesis rates are lower than “shade” plant at very low light environments.
  • 34.
    Copyright © TheMcGraw-Hill Companies, Inc. Permission required for reproduction or display. Contrasting photosynthetic response curves Figure 6.20 6-17 Source: Ehleringer, Björkman, and Mooney 1976, after Nobel 1977 Response curves for different species generally level off at different maximum photosynthesis rates.
  • 35.
    Food density andanimal functional response  Functional response: when you gradually increase the amount of food availability to a hungry animal, its rate of feeding increases and then levels off at certain food density.  Three types of functional response.
  • 36.
    Copyright © TheMcGraw-Hill Companies, Inc. Permission required for reproduction or display. Theoretical functional response curves Figure 6.21 6-18 Type 1: feeding increases linearly as food density increases - levels off at maximum Type 2:Feeding rate rises in proportion to food density. Type 3: Feeding rate increases most rapidly at intermediate densities (S-shaped).
  • 37.
    Type 2 functionalresponses are most popular
  • 38.
    Optimal foraging theory Optimal foraging theory attempts to model how organisms feed as an optimizing process  When organisms have limited access to energy, the natural selection is likely to favor individuals within a population that are more effective at acquiring energy.  Organisms can not simultaneously maximize all of their life functions, for example, allocation of energy to one function, such as growth or reproduction, will reduce the energy to other functions, such as defense.  A compromise of energy demands.
  • 39.
    Attributes that affectintake of energy  The number of the prey (abundance of a potential food items), it is expressed as the number of prey encountered by the predator per unit of time: Ne  The amount of energy, or costs, expended by the predator while search for prey: Cs  The time spent processing prey in activities such as cracking, shells, fighting, and is expressed as handling time: H
  • 40.
    Model for preychoice  Rate of energy intake of a predator is represented as: E/T, E is intake energy, and T is time: (intake rate 1) 111 11 HNe CsENe T E    Ne1 is the number of prey 1 encountered per unit of time E1 is the energy gained by feeding on one prey 1 minus the cost of handling. Cs is the cost of searching prey. H1 is the time required for “handling” one prey 1.
  • 41.
    How about selectionof prey?  When predator feed on two prey: (intake rate 2) 22111 )22()11( HNeHNe CsENeCsENe T E    22111 )22()11( HNeHNe CsENeCsENe T E    If intake rate 1> intake rate 2, predator will feed on prey 1. otherwise, will feed on prey 2
  • 42.
    Copyright © TheMcGraw-Hill Companies, Inc. Permission required for reproduction or display. Optimal foraging theory Figure 6.24 6-21 Source: Werner and Mittelbach 1981 Bluegill Sunfish
  • 43.
    Optimal Foraging ByPlants  Limited supplies of energy for allocation to leaves, stems and roots.  Bloom suggested plants adjust allocation in such a manner that all resources are equally limited. – Appear to allocate growth in a manner that increases rate of acquisition of resources in shortest supply.
  • 44.
    Copyright © TheMcGraw-Hill Companies, Inc. Permission required for reproduction or display. Soil fertility and ratio of root:shoot biomass Figure 6.25 6-22 Source: Setälä and Huhta 1991
  • 45.
    Copyright © TheMcGraw-Hill Companies, Inc. Permission required for reproduction or display. Root:shoot ratios along nitrogen availability gradient Figure 6.26 6-23 Source: Tilman and Cowan 1989