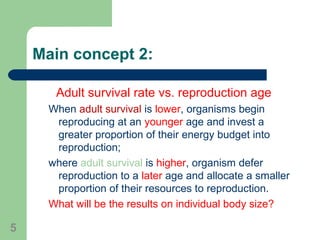
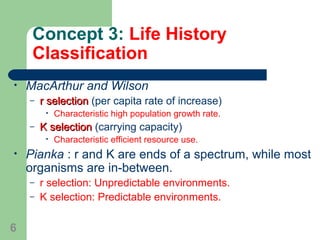
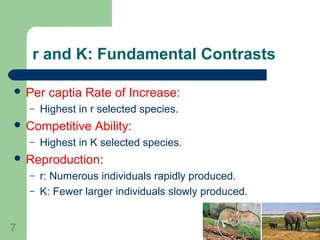
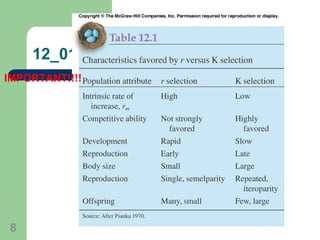
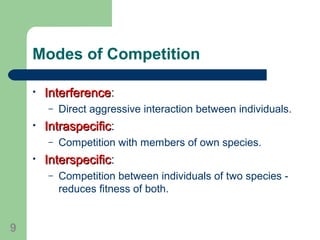
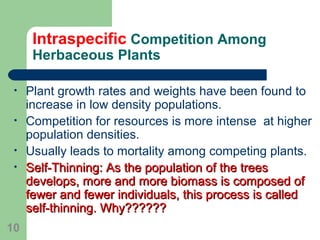
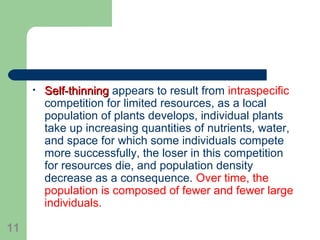
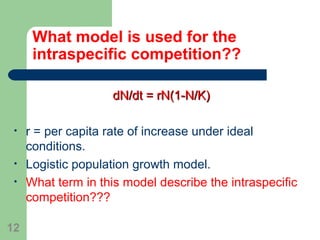
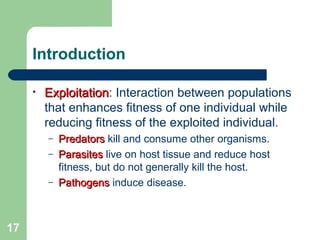
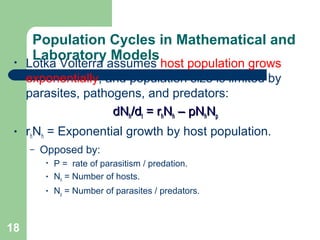
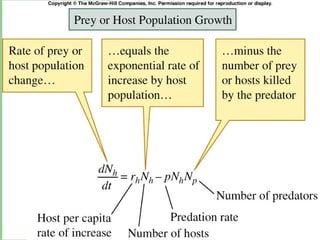
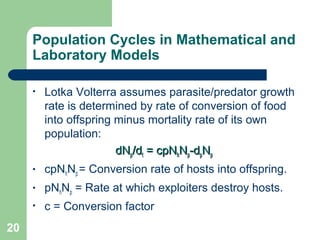
Biology 205Biology 205
Ecology and AdaptationEcology and Adaptation
Exam 3:Exam 3:
ReviewReview
Fall 2015Fall 2015
Dr. Erik D. DavenportDr. Erik D. Davenport
• Principle of AllocationPrinciple of Allocation: Only certain amount of
energy is available to a living organism. If
organisms use energy for one function such as
growth, the amount of energy available for other
functions is reduced.
2
Main concept 1:
Offspring Number Versus Size
Because all organisms have access to limitedlimited
energy and other resources, there is a trade-
off between the number and size of offspring;
those that produce larger offspring arethose that produce larger offspring are
constrained to produce fewer; while thoseconstrained to produce fewer; while those
that produce smaller offspring may producethat produce smaller offspring may produce
larger numberslarger numbers.
3
Egg Size and Number in Fish
• Fish show more variation in life-history than any
other group of animals.
• Darter fishDarter fish as an example….
4
Main concept 2:
Adult survival rate vs. reproduction age
When adult survival is lower, organisms begin
reproducing at an younger age and invest a
greater proportion of their energy budget into
reproduction;
where adult survival is higher, organism defer
reproduction to a later age and allocate a smaller
proportion of their resources to reproduction.
What will be the results on individual body size?
5
Concept 3: Life History
Classification
• MacArthur and Wilson
– r selectionr selection (per capita rate of increase)
• Characteristic high population growth rate.
– K selectionK selection (carrying capacity)
• Characteristic efficient resource use.
• Pianka : r and K are ends of a spectrum, while most
organisms are in-between.
– r selection: Unpredictable environments.
– K selection: Predictable environments.
6
r and K: Fundamental Contrasts
 Per captia Rate of Increase:
– Highest in r selected species.
 Competitive Ability:
– Highest in K selected species.
 Reproduction:
– r: Numerous individuals rapidly produced.
– K: Fewer larger individuals slowly produced.
7
12_01.jpg
8
IMPORTANT!!!!
Modes of Competition
• InterferenceInterference:
– Direct aggressive interaction between individuals.
• IntraspecificIntraspecific:
– Competition with members of own species.
• InterspecificInterspecific:
– Competition between individuals of two species -
reduces fitness of both.
9
Intraspecific Competition Among
Herbaceous Plants
• Plant growth rates and weights have been found to
increase in low density populations.
• Competition for resources is more intense at higher
population densities.
• Usually leads to mortality among competing plants.
• Self-Thinning: As the population of the treesSelf-Thinning: As the population of the trees
develops, more and more biomass is composed ofdevelops, more and more biomass is composed of
fewer and fewer individuals, this process is calledfewer and fewer individuals, this process is called
self-thinning. Why??????self-thinning. Why??????
10
• Self-thinningSelf-thinning appears to result from intraspecific
competition for limited resources, as a local
population of plants develops, individual plants
take up increasing quantities of nutrients, water,
and space for which some individuals compete
more successfully, the loser in this competition
for resources die, and population density
decrease as a consequence. Over time, the
population is composed of fewer and fewer large
individuals.
11
What model is used for the
intraspecific competition??
dN/dt = rN(1-N/K)dN/dt = rN(1-N/K)
• r = per capita rate of increase under ideal
conditions.
• Logistic population growth model.
• What term in this model describe the intraspecific
competition???
12
Lotka Volterra
 Effect of interspecific competition on population
growth of each species:
– dNdN11 / d/ dtt = r= rm1m1NN11 ((K((K11-N-N11-- αα 1212NN22) / K) / K11))
– dNdN22 / d/ dtt = r= rm2m2NN22 ((K((K22-N-N22-- αα 2121NN11) / K) / K22))
 α12: Effect of individual of species 2 on rate of pop. growth of
species 1.
 α21: Effect of individual of species 1 on rate of pop. growth of
species 2.
13
Lotka-Volterra
 The Lotka-Volterra model incorporates
interspecific competition by using a
parameter called α.
 α is the coefficient of competition (or
competition coefficient) and measures the
competitive effect of one species on another.
(IMPORTANT!!!!)
 For example: α12 is the effect of species 2
on species 1, α21 is the effect of species 1
on species 2.14
Predicting the outcome of
competition
 The outcome of competition, according to the
Lotka-Volterra model, is ultimately
determined by
 carrying capacity (Ki) and
 the competition coefficient (aij) of the two
species
15
examples
 Green sunfish Bluegill
 K1 = 600 K2 = 600
 r1 = 0.10 r2 = 0.10
 α12 = 1.50 α21 = 0.90
 What is the results of this completion?
16
Introduction
• ExploitationExploitation: Interaction between populations
that enhances fitness of one individual while
reducing fitness of the exploited individual.
– PredatorsPredators kill and consume other organisms.
– ParasitesParasites live on host tissue and reduce host
fitness, but do not generally kill the host.
– PathogensPathogens induce disease.
17
Population Cycles in Mathematical and
Laboratory Models• Lotka Volterra assumes host population grows
exponentially, and population size is limited by
parasites, pathogens, and predators:
dNdNhh/d/dtt = r= rhhNNhh – pN– pNhhNNpp
• rhNh = Exponential growth by host population.
– Opposed by:
• P = rate of parasitism / predation.
• Nh = Number of hosts.
• Np = Number of parasites / predators.
18
19
Population Cycles in Mathematical and
Laboratory Models
• Lotka Volterra assumes parasite/predator growth
rate is determined by rate of conversion of food
into offspring minus mortality rate of its own
population:
dNdNpp/d/dtt = cpN= cpNhhNNpp-d-dppNNpp
• cpNhNp = Conversion rate of hosts into offspring.
• pNhNp = Rate at which exploiters destroy hosts.
• c = Conversion factor
20
21
Predator vs. Prey
Without predator, Prey population will
grow exponentially.
Without prey, predator population will
decrease (die)
22
Model Behavior
 Host exponential growth often opposed by
exploitation.
– Host reproduction immediately translated into
destruction by predator.
– Increased predation = more predators.
– More predators = higher exploitation rate.
– Larger predator population eventually reduces
host population, in turn reducing predator
population.
23
Model Behavior
 Reciprocal effects produce oscillations in two
populations.
 Although the assumptions of eternal
oscillations and that neither host nor exploiter
populations are subject to carrying capacities
are unrealistic, L-V models made valuable
contributions to the field.
24
25
Refuges
26
27
Introduction
 Mutualism: Interactions between individuals of
different species that benefit both partners.
– Facultative Mutualism occurs when a species can live
without its mutualistic partner.
– Obligate Mutualism occurs when a species is
dependent on a mutualistic relationship.
28
Introduction
 Community: Association of interacting
species (population) inhabiting some defined
area.
 Community Structure includes attributes
such as number of species, relative species
abundance, and species diversity.
29
Pattern of Species Abundance
 There are regularities in the
relative abundance of species
in communities that hold
irregardless of the ecosystem.
 Most species are moderately
abundant; few are very
abundant, or extremely rare.
30
Environmental Complexity
 In general, species diversity increases with
environmental complexity or heterogeneity. why???
– Higher environmental complexity will introduce a more
diversified environments -- more niches
– More niches  higher species diversity
 Many studies have shown positive relationship
between environmental complexity and species
diversity.
31
Environmental Complexity
32
Disturbance and Diversity
 Disturbance difficult to define as it involves
departure from “average conditions.”
– Average conditions may involve substantial
variation.
 Sousa defined disturbance:
– Discrete, punctuated, killing, displacement, or
damaging of one or more individuals that directly
or indirectly creates an opportunity for new
individuals to be established.
33
Disturbance and Diversity
 White and Pickett defined disturbance:
– Any relatively discrete event in time that disrupts
ecosystem, community, or population structure
and changes resources, substrate availability, or
the physical environment.
– Two major characteristics:
 Frequency
 Intensity
34
Intermediate Disturbance Hypothesis
 Connell proposed disturbance is a prevalent
feature that significantly influences community
diversity.
– Proposed both high and low levels of disturbance
would reduce diversity.
– Intermediate levels promote higher diversity.
– Sufficient time between disturbances allows wide
variety of species to colonize, but not long enough to
allow competitive exclusion.
35
Disturbance and Diversity in the Intertidal
Zone
Species interactions and
community structure
• The most important interactions in a
community are:
• Feeding relationships provide some of the
most easily documented examples of
interactions within community.
• Food webFood web: a summary of the most the
feeding interactions within a community, is
one of the most basic and revealing
descriptions of a community structure.
36
Community Webs
• AA food webfood web summarizes the feeding relationshipsummarizes the feeding relationship
in a communityin a community..
• Summerhayes and Elton studied feeding
relations on Bear Island in High Arctic.
– Primary producers were terrestrial plants and aquatic
algae.
– Fed on by several kinds of terrestrial and aquatic
invertebrates.
– Consumed by birds.
– Attacked by arctic foxes.
37
Arctic Food Web
38
Food Web Complexity
 The level of food web complexity increases
dramatically with more diverse communities.
 Winemiller described feeding relations
among tropical freshwater fish.
 Represented food webs in various ways:
– Only included common species.
– Top-predator sink.
– Excluded weakest trophic links.
39
40
Strong Interactions and Food Web
Structure
• Paine suggested feeding activities of a few
species may have a dominant influence on
community structure. He called these important
trophic relations strong interactions.strong interactions.
• Suggested criterion for strong interaction is
based on the degree of influence on community
structure.
41
Keystone Species
• Keystone speciesKeystone species: the species has the most
significant influence on community structure.
• The feeing activities of few keystone species
may control the structure of communities.
• If keystone species reduce likelihood of
competitive exclusion, their activities would
increase the number of species that could
coexist in communities.( some predator may
increase species diversity).
42
Exotic Predators
 Exotic predator can collapse and simplify the
structure of food web.
 Exotic species have dramatic impacts on
communities because they were outside the
evolutionary experience of local prey
populations.
– Nile Perch (Lates nilotica) exotic fish predator in
Lake Victoria.
– Fish fauna dramatically reduced.
43

Biology205 exam3 review

  • 1.
    Biology 205Biology 205 Ecologyand AdaptationEcology and Adaptation Exam 3:Exam 3: ReviewReview Fall 2015Fall 2015 Dr. Erik D. DavenportDr. Erik D. Davenport
  • 2.
    • Principle ofAllocationPrinciple of Allocation: Only certain amount of energy is available to a living organism. If organisms use energy for one function such as growth, the amount of energy available for other functions is reduced. 2
  • 3.
    Main concept 1: OffspringNumber Versus Size Because all organisms have access to limitedlimited energy and other resources, there is a trade- off between the number and size of offspring; those that produce larger offspring arethose that produce larger offspring are constrained to produce fewer; while thoseconstrained to produce fewer; while those that produce smaller offspring may producethat produce smaller offspring may produce larger numberslarger numbers. 3
  • 4.
    Egg Size andNumber in Fish • Fish show more variation in life-history than any other group of animals. • Darter fishDarter fish as an example…. 4
  • 5.
    Main concept 2: Adultsurvival rate vs. reproduction age When adult survival is lower, organisms begin reproducing at an younger age and invest a greater proportion of their energy budget into reproduction; where adult survival is higher, organism defer reproduction to a later age and allocate a smaller proportion of their resources to reproduction. What will be the results on individual body size? 5
  • 6.
    Concept 3: LifeHistory Classification • MacArthur and Wilson – r selectionr selection (per capita rate of increase) • Characteristic high population growth rate. – K selectionK selection (carrying capacity) • Characteristic efficient resource use. • Pianka : r and K are ends of a spectrum, while most organisms are in-between. – r selection: Unpredictable environments. – K selection: Predictable environments. 6
  • 7.
    r and K:Fundamental Contrasts  Per captia Rate of Increase: – Highest in r selected species.  Competitive Ability: – Highest in K selected species.  Reproduction: – r: Numerous individuals rapidly produced. – K: Fewer larger individuals slowly produced. 7
  • 8.
  • 9.
    Modes of Competition •InterferenceInterference: – Direct aggressive interaction between individuals. • IntraspecificIntraspecific: – Competition with members of own species. • InterspecificInterspecific: – Competition between individuals of two species - reduces fitness of both. 9
  • 10.
    Intraspecific Competition Among HerbaceousPlants • Plant growth rates and weights have been found to increase in low density populations. • Competition for resources is more intense at higher population densities. • Usually leads to mortality among competing plants. • Self-Thinning: As the population of the treesSelf-Thinning: As the population of the trees develops, more and more biomass is composed ofdevelops, more and more biomass is composed of fewer and fewer individuals, this process is calledfewer and fewer individuals, this process is called self-thinning. Why??????self-thinning. Why?????? 10
  • 11.
    • Self-thinningSelf-thinning appearsto result from intraspecific competition for limited resources, as a local population of plants develops, individual plants take up increasing quantities of nutrients, water, and space for which some individuals compete more successfully, the loser in this competition for resources die, and population density decrease as a consequence. Over time, the population is composed of fewer and fewer large individuals. 11
  • 12.
    What model isused for the intraspecific competition?? dN/dt = rN(1-N/K)dN/dt = rN(1-N/K) • r = per capita rate of increase under ideal conditions. • Logistic population growth model. • What term in this model describe the intraspecific competition??? 12
  • 13.
    Lotka Volterra  Effectof interspecific competition on population growth of each species: – dNdN11 / d/ dtt = r= rm1m1NN11 ((K((K11-N-N11-- αα 1212NN22) / K) / K11)) – dNdN22 / d/ dtt = r= rm2m2NN22 ((K((K22-N-N22-- αα 2121NN11) / K) / K22))  α12: Effect of individual of species 2 on rate of pop. growth of species 1.  α21: Effect of individual of species 1 on rate of pop. growth of species 2. 13
  • 14.
    Lotka-Volterra  The Lotka-Volterramodel incorporates interspecific competition by using a parameter called α.  α is the coefficient of competition (or competition coefficient) and measures the competitive effect of one species on another. (IMPORTANT!!!!)  For example: α12 is the effect of species 2 on species 1, α21 is the effect of species 1 on species 2.14
  • 15.
    Predicting the outcomeof competition  The outcome of competition, according to the Lotka-Volterra model, is ultimately determined by  carrying capacity (Ki) and  the competition coefficient (aij) of the two species 15
  • 16.
    examples  Green sunfishBluegill  K1 = 600 K2 = 600  r1 = 0.10 r2 = 0.10  α12 = 1.50 α21 = 0.90  What is the results of this completion? 16
  • 17.
    Introduction • ExploitationExploitation: Interactionbetween populations that enhances fitness of one individual while reducing fitness of the exploited individual. – PredatorsPredators kill and consume other organisms. – ParasitesParasites live on host tissue and reduce host fitness, but do not generally kill the host. – PathogensPathogens induce disease. 17
  • 18.
    Population Cycles inMathematical and Laboratory Models• Lotka Volterra assumes host population grows exponentially, and population size is limited by parasites, pathogens, and predators: dNdNhh/d/dtt = r= rhhNNhh – pN– pNhhNNpp • rhNh = Exponential growth by host population. – Opposed by: • P = rate of parasitism / predation. • Nh = Number of hosts. • Np = Number of parasites / predators. 18
  • 19.
  • 20.
    Population Cycles inMathematical and Laboratory Models • Lotka Volterra assumes parasite/predator growth rate is determined by rate of conversion of food into offspring minus mortality rate of its own population: dNdNpp/d/dtt = cpN= cpNhhNNpp-d-dppNNpp • cpNhNp = Conversion rate of hosts into offspring. • pNhNp = Rate at which exploiters destroy hosts. • c = Conversion factor 20
  • 21.
  • 22.
    Predator vs. Prey Withoutpredator, Prey population will grow exponentially. Without prey, predator population will decrease (die) 22
  • 23.
    Model Behavior  Hostexponential growth often opposed by exploitation. – Host reproduction immediately translated into destruction by predator. – Increased predation = more predators. – More predators = higher exploitation rate. – Larger predator population eventually reduces host population, in turn reducing predator population. 23
  • 24.
    Model Behavior  Reciprocaleffects produce oscillations in two populations.  Although the assumptions of eternal oscillations and that neither host nor exploiter populations are subject to carrying capacities are unrealistic, L-V models made valuable contributions to the field. 24
  • 25.
  • 26.
  • 27.
    27 Introduction  Mutualism: Interactionsbetween individuals of different species that benefit both partners. – Facultative Mutualism occurs when a species can live without its mutualistic partner. – Obligate Mutualism occurs when a species is dependent on a mutualistic relationship.
  • 28.
    28 Introduction  Community: Associationof interacting species (population) inhabiting some defined area.  Community Structure includes attributes such as number of species, relative species abundance, and species diversity.
  • 29.
    29 Pattern of SpeciesAbundance  There are regularities in the relative abundance of species in communities that hold irregardless of the ecosystem.  Most species are moderately abundant; few are very abundant, or extremely rare.
  • 30.
    30 Environmental Complexity  Ingeneral, species diversity increases with environmental complexity or heterogeneity. why??? – Higher environmental complexity will introduce a more diversified environments -- more niches – More niches  higher species diversity  Many studies have shown positive relationship between environmental complexity and species diversity.
  • 31.
  • 32.
    32 Disturbance and Diversity Disturbance difficult to define as it involves departure from “average conditions.” – Average conditions may involve substantial variation.  Sousa defined disturbance: – Discrete, punctuated, killing, displacement, or damaging of one or more individuals that directly or indirectly creates an opportunity for new individuals to be established.
  • 33.
    33 Disturbance and Diversity White and Pickett defined disturbance: – Any relatively discrete event in time that disrupts ecosystem, community, or population structure and changes resources, substrate availability, or the physical environment. – Two major characteristics:  Frequency  Intensity
  • 34.
    34 Intermediate Disturbance Hypothesis Connell proposed disturbance is a prevalent feature that significantly influences community diversity. – Proposed both high and low levels of disturbance would reduce diversity. – Intermediate levels promote higher diversity. – Sufficient time between disturbances allows wide variety of species to colonize, but not long enough to allow competitive exclusion.
  • 35.
    35 Disturbance and Diversityin the Intertidal Zone
  • 36.
    Species interactions and communitystructure • The most important interactions in a community are: • Feeding relationships provide some of the most easily documented examples of interactions within community. • Food webFood web: a summary of the most the feeding interactions within a community, is one of the most basic and revealing descriptions of a community structure. 36
  • 37.
    Community Webs • AAfood webfood web summarizes the feeding relationshipsummarizes the feeding relationship in a communityin a community.. • Summerhayes and Elton studied feeding relations on Bear Island in High Arctic. – Primary producers were terrestrial plants and aquatic algae. – Fed on by several kinds of terrestrial and aquatic invertebrates. – Consumed by birds. – Attacked by arctic foxes. 37
  • 38.
  • 39.
    Food Web Complexity The level of food web complexity increases dramatically with more diverse communities.  Winemiller described feeding relations among tropical freshwater fish.  Represented food webs in various ways: – Only included common species. – Top-predator sink. – Excluded weakest trophic links. 39
  • 40.
  • 41.
    Strong Interactions andFood Web Structure • Paine suggested feeding activities of a few species may have a dominant influence on community structure. He called these important trophic relations strong interactions.strong interactions. • Suggested criterion for strong interaction is based on the degree of influence on community structure. 41
  • 42.
    Keystone Species • KeystonespeciesKeystone species: the species has the most significant influence on community structure. • The feeing activities of few keystone species may control the structure of communities. • If keystone species reduce likelihood of competitive exclusion, their activities would increase the number of species that could coexist in communities.( some predator may increase species diversity). 42
  • 43.
    Exotic Predators  Exoticpredator can collapse and simplify the structure of food web.  Exotic species have dramatic impacts on communities because they were outside the evolutionary experience of local prey populations. – Nile Perch (Lates nilotica) exotic fish predator in Lake Victoria. – Fish fauna dramatically reduced. 43