This document discusses bioequivalence and how it is assessed using statistical methods in R. It defines bioequivalence as the comparison of bioavailability between two formulations of the same active ingredient. Key points:
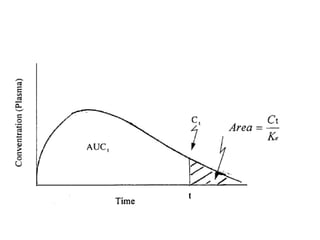
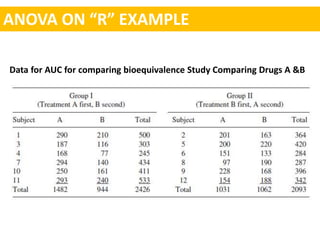
- Bioequivalence studies compare pharmacokinetic measures like AUC and Cmax between test and reference drugs.
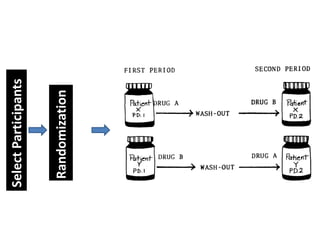
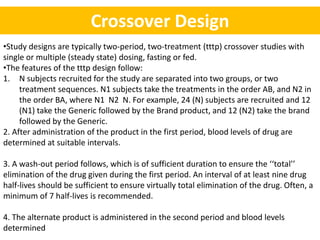
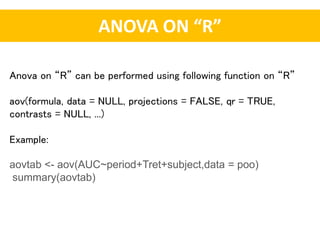
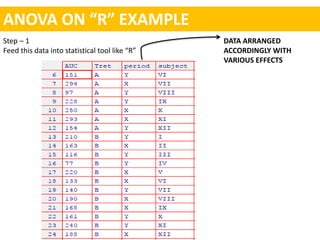
- A common crossover study design involves each subject receiving both drugs on different occasions.
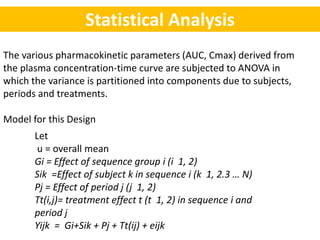
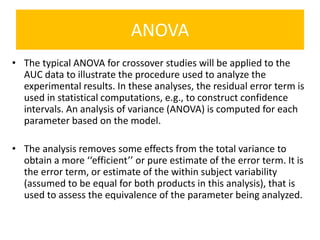
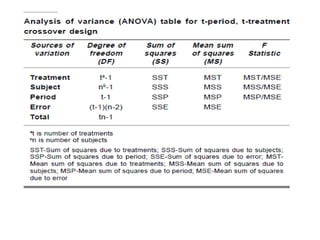
- Data are analyzed using ANOVA to separate out variance components and determine equivalence.
- The FDA typically uses a 80-125% range for the 90% CI of the ratio of means on log-transformed AUC and Cmax data to determine equivalence.
- An example is shown of constructing the 90


![Constructing 90 % confidence interval of log transformed data.
The difference of the logarithms is equivalent to the logarithm of the ratio
[i.e., log A-logB = log (A/B)].
Formula for calculating confidence interval = log (A/B) ± t-value√SE/(1/N1 + 1/N2)
The averages In values for the test and standard products are
A = 5.29751
B = 5.07778
A –B = 5.29751 – 5.0778 = 0 21973
SE(computed from anova table ) = 0.045
t- value for 90% confidence interval = 1.81
N1 = 12
N2 = 12
CI = log (A/B) ± t-value√SE/(1/N1 + 1/N2)
= 0.21973±1.81 √ 0.045/ 6
= 0.06298 to 0.37648](https://image.slidesharecdn.com/sopmidsem-180422024221/85/Bioequivalence-studies-A-statistical-approach-through-R-22-320.jpg)


![PERI-PROSTHETIC FRACTURE NAIL-PLATE CONSTRUCT [NPC].pptx](https://cdn.slidesharecdn.com/ss_thumbnails/drarunkumardrmohamedashrafperiprostheticfrasturenail-plateconstructnpc-260209164459-7e9d15a1-thumbnail.jpg?width=640&height=640&fit=bounds)

