Download as PDF, PPTX


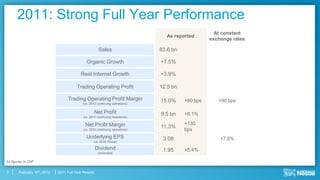
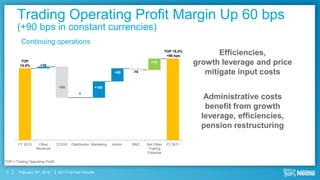
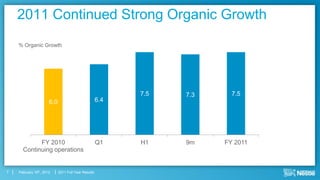
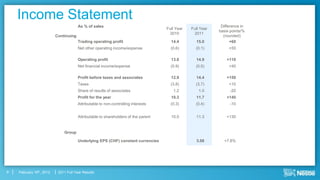
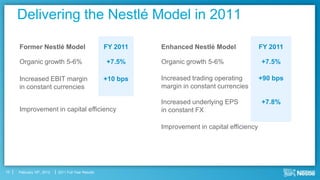


The document summarizes Nestle's 2011 full year results. Key points include: - Sales grew 7.5% organically to CHF 83.6 billion. - Trading operating profit margin increased 60 basis points to 15%. - Underlying earnings per share grew 7.8% in constant currencies. - All regions and most categories delivered growth, with emerging markets performing strongly.


