Bihar is a state in eastern India. It has a population of over 103 million, making it the 3rd most populous state. Bihar has experienced lagging social and economic development since the 1970s compared to other Indian states. However, improved governance has led to increased investment and economic growth in recent decades in areas like infrastructure, healthcare, education, and reducing crime. Bihar was an ancient center of power, learning, and culture, and was home to India's first empire, the Maurya Empire, as well as the religion of Buddhism.

![Page | 2
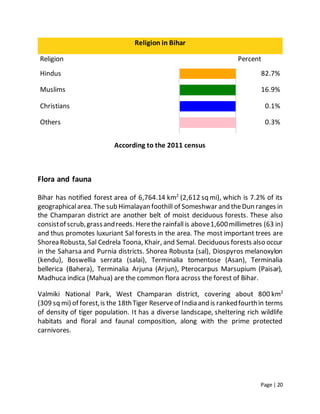
Executive Summary
The report gives a brief detail about Sweden, as a country, its basic
geography, the political, economic, socio- cultural, technological, environmental
and legal scenario of the state and would try to link it with the presentenergy and
power scenario of the State
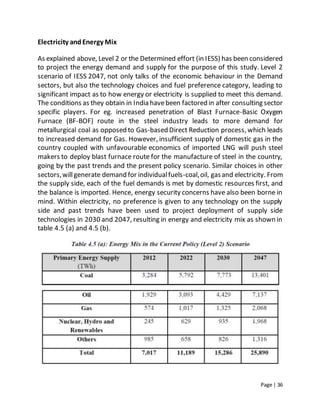
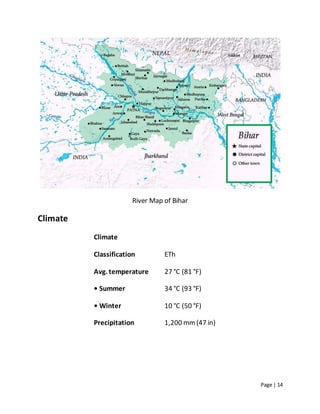
Bihar is a state in East India. It is the 13th-largest state of India, with an area of
94,163 km2
(36,357 sq mi). The third-largest state of India by population, it is
contiguous with Uttar Pradesh to its west, Nepal to the north, the northern part of
WestBengal to the east, with Jharkhand to the south. The Bihar plain is split by the
river Ganges which flows from west to east.
Bihar is a States and territories of India in North India. Itis the 12th largest state in
terms of geographical size at 38,202 sq mi (98,940 km2
) and 3rd largest by
population. Itis bounded by Uttar Pradesh to its west, Nepalto the north,Northern
part of West Bengal to the east and by Jharkhand to the south.
On November 15, 2000, southern Bihar was ceded to form the new state of
Jharkhand.Closeto 85%of thepopulation lives in villages. Additionally, almost58%
of Biharis are below the age of 25, giving Bihar the highest proportion of young
people compared to any ther state in India. The official languages of the state are
Hindi and Urdu.[4][5]
Other languages commonly used within the state include
Bhojpuri, Maithili, Magahi, Bajjika, and Angika (Maithili being the only one of these
to be publicly accepted by the government).
Inancient and classicalIndia,Bihar wasconsidereda centre of power,learning, and
culture.[13]
FromMagadha aroseIndia's firstempire, the Maurya empire, as well as
one of the world's most widely adhered-to religions, Buddhism.[14]
Magadha
empires, notably under the Maurya and Gupta dynasties, unified large parts of
South Asia under a central rule](https://image.slidesharecdn.com/roll39500054572bihar-171118063303/85/Bihar-Power-Report-2-320.jpg)
![Page | 5
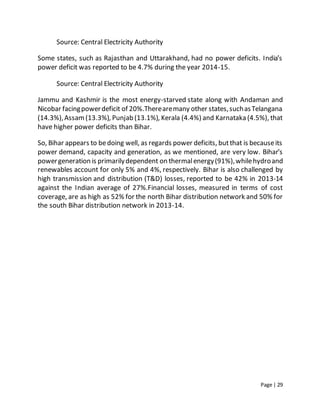
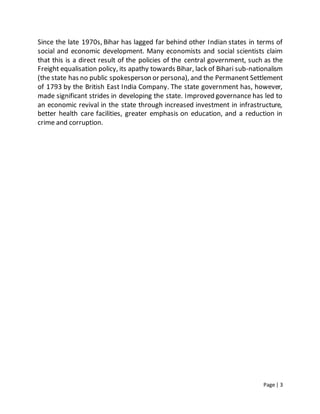
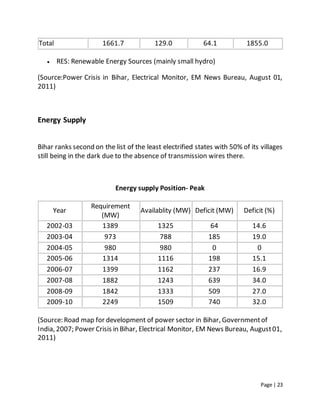
Introduction
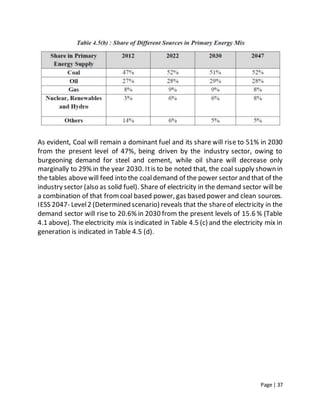
Coordinates (Patna): 25.37°N85.13°ECoordinates: 25.37°N 85.13°E
Country India
Region East India
Bihar Province
1 April 1936
Summary [show]
Capital Patna
0Largest city Patna
Districts 38
Government
• Governor Ram Nath Kovind
• Chief Minister Nitish Kumar
• Legislature
Bicameral
Legislative Council 75
Legislative Assembly 243
• Parliamentary
constituency
40
• High Court Patna High Court
Area†](https://image.slidesharecdn.com/roll39500054572bihar-171118063303/85/Bihar-Power-Report-5-320.jpg)
![Page | 6
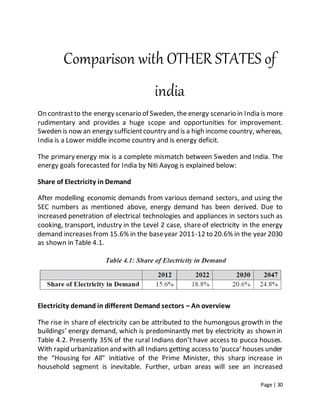
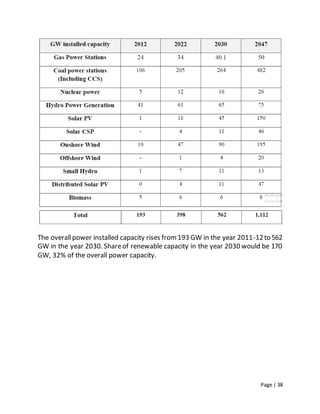
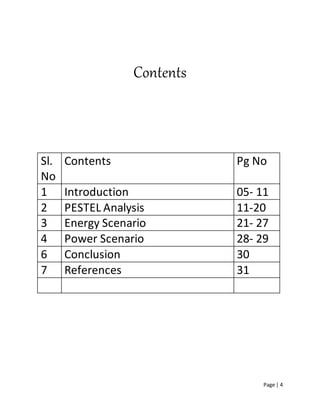
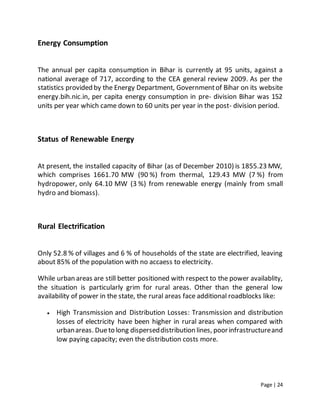
• Total 94,163 km2 (36,357 sq mi)
Area rank 13th
Population (2011)[1]
• Total 103,804,637
• Rank 3rd
• Density 1,102/km2 (2,850/sq mi)
Demonym(s) Bihari
Time zone IST (UTC+05:30)
UN/LOCODE INBR
ISO 3166 code IN-BR
Vehicle registration BR
HDI 0.447
HDI rank 16th (2010)
Literacy[3]
63.8% (total)
73.5% (male)
53.3% (female)
Official language Hindi
Additional official
language
Urdu](https://image.slidesharecdn.com/roll39500054572bihar-171118063303/85/Bihar-Power-Report-6-320.jpg)
![Page | 7
The report gives a brief detail about Sweden, as a country, its basic
geography, the political, economic, socio- cultural, technological, environmental
and legal scenario of the state and would try to link it with the presentenergy and
power scenario of the State.
Bihar is a state in East India. It is the 13th-largest state of India, with an area of
94,163 km2
(36,357 sq mi). The third-largest state of India by population, it is
contiguous with Uttar Pradesh to its west, Nepal to the north, the northern part of
WestBengal to the east, with Jharkhand to the south. The Bihar plain is split by the
river Ganges which flows from west to east.
On November 15, 2000, southern Bihar was ceded to form the new state of
Jharkhand.Closeto 85%of thepopulation lives in villages. Additionally, almost58%
of Biharis are below the age of 25, giving Bihar the highest proportion of young
people compared to any ther state in India. The official languages of the state are
Hindi and Urdu.Other languages commonly used within the state include Bhojpuri,
Maithili, Magahi, Bajjika, and Angika (Maithili being the only one of these to be
publicly accepted by the government).
Inancient and classicalIndia,Bihar wasconsidereda centre of power,learning, and
culture. From Magadha arose India's first empire, the Maurya empire, as well as
one of the world's mostwidely adhered-to religions, Buddhism. Magadha empires,
notably under the Maurya and Gupta dynasties, unified large parts of South Asia
under a central rule
Since the late 1970s, Bihar has lagged far behind other Indian states in terms of
social and economic development. Many economists and social scientists claim
that this is a direct result of the policies of the central government, such as the
Freight equalisation policy, its apathy towards Bihar, lack of Bihari sub-nationalism
(the state has no public spokesperson or persona), and the Permanent Settlement
of 1793 by the British East India Company. The state government has, however,
made significant strides in developing the state. Improved governance has led to
an economic revivalin the state through increased investment in infrastructure,[26]](https://image.slidesharecdn.com/roll39500054572bihar-171118063303/85/Bihar-Power-Report-7-320.jpg)
![Page | 10
Kalidasa's Sanskritplay Abhijñānaśākuntalam
Medieval
Buddhism in Magadha went into decline due to the invasion of Muhammad Bin
Bakhtiar Khilji, during which many of the viharas and the famed universities of
Nalanda and Vikramashilaweredestroyed,and thousandsof Buddhistmonkswere
massacred during 12th century.D. N. Jha suggests, instead, that these incidents
were the result of Buddhist-Brahmin skirmishes in a fight for supremacy. In 1540
the greatPathan chieftain, Sher ShahSuri, fromSasaram,Bihar, took overnorthern
India from the Mughals. He defeated the Mughal army of emperor Humayun and
drove the Mughals out of India. Sher Shah declared Delhi his capital.
The tenth and the last Guru of Sikhism, Guru Gobind Singh was born in Patna. After
the downfall of Mughal Empire, Bihar came under Nawabs of Bengal.
Colonial Era
After the Battle of Buxar (1764),theBritish EastIndiaCompanyobtained the diwani
rights (rights to administer, and collect revenue or tax) for Bihar, Bengal and
Odisha. The rich resources of fertile land, water and skilled labour had attracted
the foreign imperialists, particularly the Dutch and British, in the 18th century. A
number of agriculture-based industries had been started in Bihar by foreign
entrepreneurs.[40]
Bihar remained a part of the Bengal Presidency of British India
until 1912, when the province of Bihar and Orissa was carved out as a separate
province. Since2010, Bihar has celebrated its birthday as Bihar Diwas on 22 March.](https://image.slidesharecdn.com/roll39500054572bihar-171118063303/85/Bihar-Power-Report-10-320.jpg)
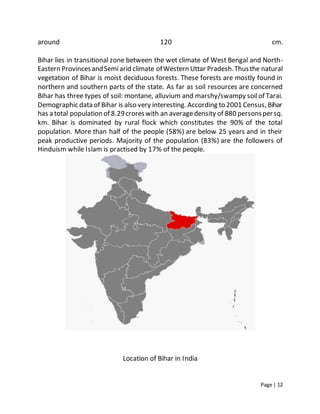
![Page | 16
Bihar, one has to prepare, which includes taking ample of drinking water to avoid
dehydration and related problems.
June to September – Rainy Season
Soon after the scorching sun hits the state, rainy season continues until mid
September. The beginning of this weather is when a stormarises from the Bay of
Bengal. Itis also a good time to visitBihar as crops mesmerizes your soulwith their
lush green appearance. The temperature remains moderate usually in this season.
For those who love to walk in rain, this is the best time to visit Bihar, as there is
ample of opportunity for them.
Political Scenario:
By 2004, 14 years after Lalu Prasad Yadav's victory, The Economist magazine said
that "Bihar [had] become a byword for the worst of India, of widespread and
inescapable poverty, of corruptpoliticians indistinguishable frommafia-dons they
patronise, caste-ridden socialorder that has retained the worstfeudalcruelties".In
2005, the World Bank believed that issues faced by the state were "enormous"
because of "persistent poverty, complex social stratification, unsatisfactory
infrastructureand weak governance"., therearetwo main political formations: the
National Democratic Alliance (NDA) which comprises Bharatiya Janata Party, Lok
Janashakti Party, Rashtriya Lok Samta Party and Hindustani AwamMorcha. JD(U)-
led coalition which includes RJD and Indian National Congress. There are many
other political formations. The Communist Party of India had a strong presence in
Bihar at one time, but is weakened now. The CPM and Forward Bloc have a minor
presence, along with the other extreme Left.
In contrastto prior governments, which emphasised divisionsof casteand religion,
Nitish Kumar'smanifesto wasbasedon economic development, curbson crimeand
corruption and greater social equality for all sections of society. This was the at the
time of election and immediately afterwards. Since 2010, the government has
confiscated the properties of corrupt officials and redeployed them as schools
buildings. Simultaneously they introduced Bihar Special Court Act to curb crime. It
has also legislated for a two-hour break on Fridays, including lunch, to enable
Muslimemployees to pray and thus cut down on post-lunch absenteeismby them.](https://image.slidesharecdn.com/roll39500054572bihar-171118063303/85/Bihar-Power-Report-16-320.jpg)
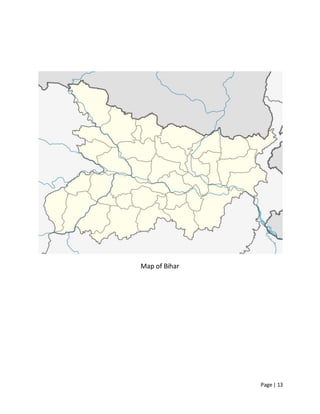
![Page | 19
The governor asked Manjhi to seek vote of confidence on 20 February 2015, the
firstday of budget session of assembly. BJP announced it would supportManjhi.[15]
On 20 February 2015, Manjhi resigned from the post of chief minister in the
morning before the vote. He said that the legislators who supported him were
threatened with death and the speaker of assembly did not allow a secret ballot,
so hechoseto resign.The assemblywasadjournedsinedie. Later Nitish Kumar was
invited by the Governor to formthe governmentand he took oath on 22 February
2015 along with 22 other ministers.
Demographics
After the 2011 Census, Bihar was the third most populous state of India with total
population of 104,099,452 (54,278,157 male and 49,821,295 female). Nearly 89%
of Bihar's population lived in rural areas. Almost 58% of Bihar's population was
below 25 yearsage, which is the highestin India.The densitywas 881.The sexratio
was919females per 1000males.Mostof Bihar'spopulation belongs to Indo-Aryan-
speaking ethnic groups along with few Dravidian-speaking and Austroasiatic-
speaking people mostly in Chhotanagpur Plateau (now part of Jharkhand). It also
attracted PunjabiHindu refugees during the Partition of British India in 1947. Bihar
has a total literacy rate of 63.82% (75.7% for males and 55.1% for females),
recording a growth of 20% in female literacy over the period of a decade.
As of the 2011 census, population density surpassed 1,000 per square kilometre,
making Bihar India's most densely-populated state, but still lower than West Java
or Banten of Indonesia.](https://image.slidesharecdn.com/roll39500054572bihar-171118063303/85/Bihar-Power-Report-19-320.jpg)
![Page | 21
Energy Scenario
Overview
Bihar is a States and territories of India in North India. Itis the 12th largest state in
terms of geographical size at 38,202 sq mi (98,940 km2
) and 3rd largest by
population. Itis bounded by Uttar Pradesh to its west, Nepalto the north,Northern
part of West Bengal to the east and by Jharkhand to the south.[1]
Status of the Power Sector
Situation of power availability in Bihar was never rosy, but with the separation of
Jharkhand in the year 2000, it became particularly critical beacuse most of the
power generation plants fell into the newly formed state. With Jharkhand, went
the bounty of natural resources and mines which minimised the chances of Bihar
generating its own electricity using coal. Currently, Bihar is dependent on National
Thermal Power Corporation Plants and Jharkhand Electricity Board for power
supply. But there is still a wide demand- supply gap that needs to be bridged, one
glaring proof of the same is the fact that Bihar's power systemhas a peak of about
1500 MW under the constrained demand scenario and the availablity is about 950
MW. Only 52.8 % of villages and 6 % of households of the state are electrified,
leaving about 85 % of the population with no access to electricity.](https://image.slidesharecdn.com/roll39500054572bihar-171118063303/85/Bihar-Power-Report-21-320.jpg)
![Page | 22
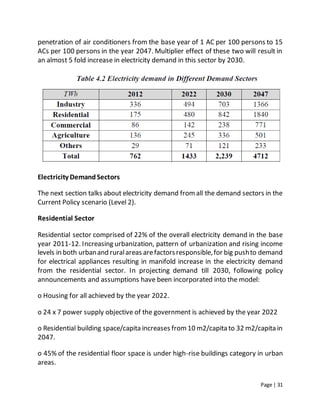
Current Electricity Scenario in Bihar
Attribute Value
State Installed Capacity 590 MW
of which thermal 540 MW
(Barauani) 320 MW
(Muzaffarpur) 220 MW
Hydro (Kosi) 50 MW
Shareof Chhattisgarh Stations 1379 MW
AT&C Losses 14.45%
Energy Shortage 16.4%
Peak Deficit 27.6%
Per Capita Consumption 93 kWh
National Consumption 650 kWh
(Source: 3rd North East& East Power Summit 2010, CEA and PFC)
Energy Capacity
Bihar gets an allocated shareof 1233MWof power fromthe centralsector projects
and draws an unallocated share of 28 MW. The state owned extisting power
stations generate only 584.6 MW. Looking at the table below, it is clear that
majority of this comes from the thermal power stations.[3]
Power Capacity in Bihar (As of December 2010;inMW)
Thermal Hydro RES* Total
Central 1131.7 129.4 0 1261.1
State 530.0 0 54.6 584.6
Private 0 0 9.5 9.5](https://image.slidesharecdn.com/roll39500054572bihar-171118063303/85/Bihar-Power-Report-22-320.jpg)
![Page | 27
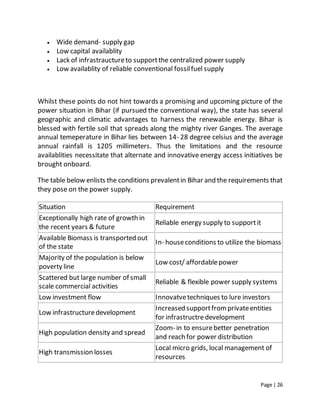
Keeping all these requirements in mind, one possible solution for Bihar seems to
be the decentralized electricity generation.This will proveparticularly beneficial for
remote areas where grid connectivity is not possible. The decentralized power
generation can make use of different renewable energy sources available in the
state. Since Bihar is an agriculture based economy, rural areas have readily
availablebiomass;hilly and coatsalareascould beutilized for windenergy andlarge
surfaces in the rural areas can be used for solar energy generation.[8]
Policy Framework, Laws & Regulations
Bihar Policy for Promotion of New & Renewable Energy Sources 2011
Renewable Energy Action Plan for Bihar; WISE, DFID; 2011
Bihar Policy for Promotion of New & Renewable Energy Sources 2009
Policy Guidelines for Private Sector Participation for Developing Non-
Conventional Energy Sources 2003.
Institutions Involved
Bihar State InvestmentPromotion Board: looks at the project proposals and
grants approvals for setting up renewable energy plants.
Bihar Renewable Energy Development Agency (BREDA): The projects are
evaluated and recommended upon by BREDA.
Bihar State Elecricity Board (BSEB): Post installation, the sale and
transmission of power are handled by the BSEB.
Bihar Electricity Regulatory Commission (BERC): comes into the picture to
decide on supply and pricing.](https://image.slidesharecdn.com/roll39500054572bihar-171118063303/85/Bihar-Power-Report-27-320.jpg)