Download to read offline


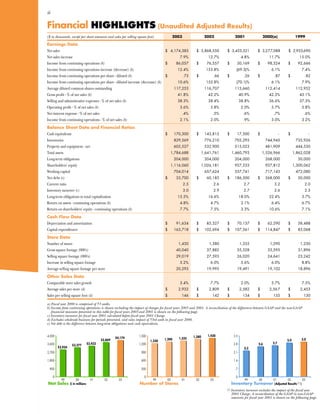


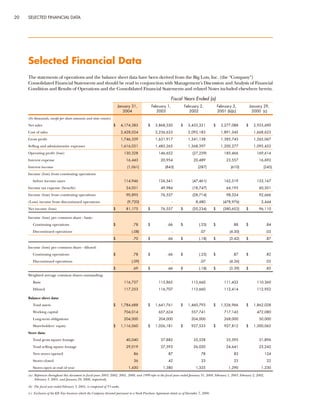
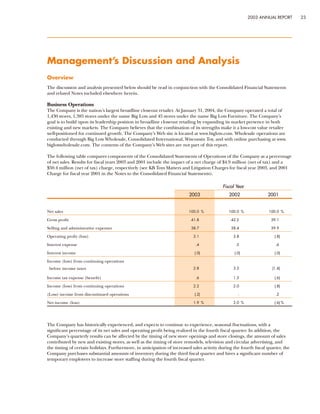


Big Lots is a retail company that offers brand-name merchandise at discounted prices. In 2003, Big Lots saw a 7.9% increase in net sales compared to 2002. Net income increased 12.4% while earnings per share rose 10.6%. The company operates over 1,400 stores across the United States and aims to provide customers with great deals through closeout products and bargains in a unique shopping environment.


