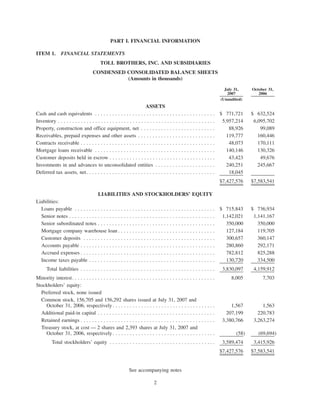
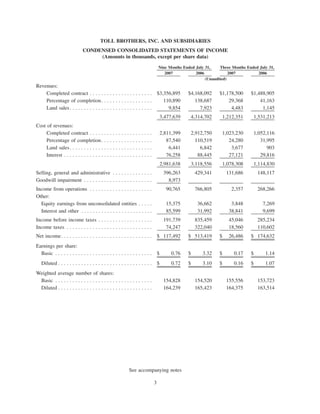
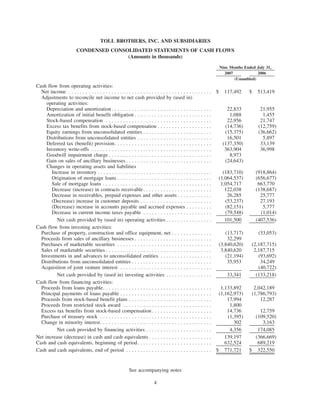
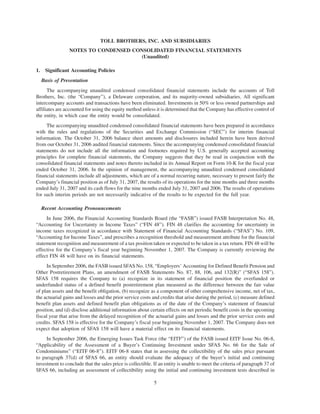
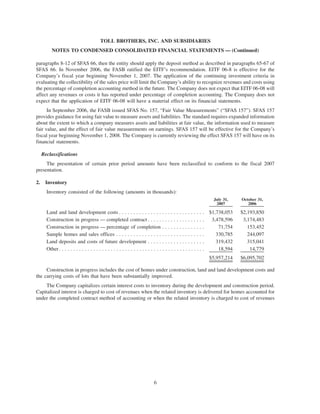
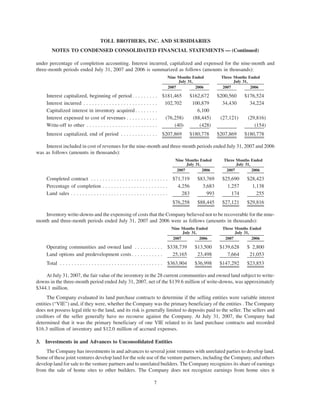
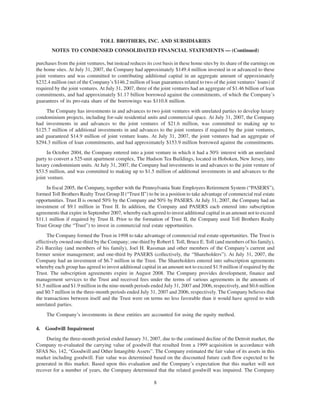
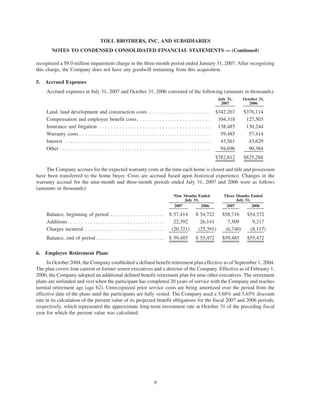
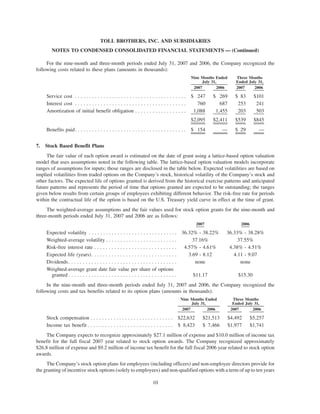
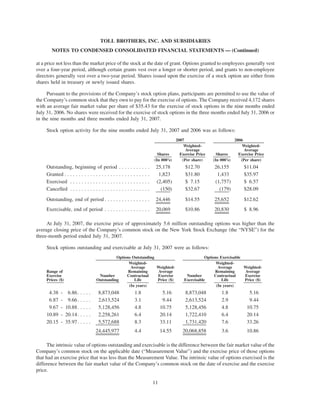
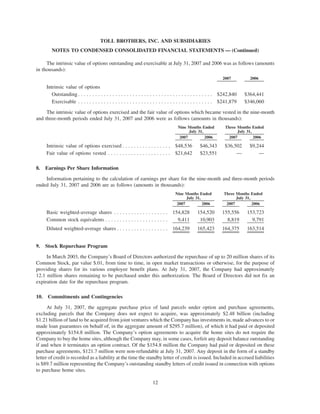
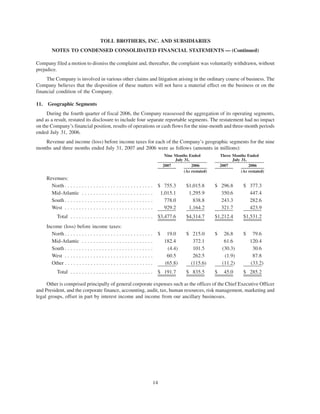
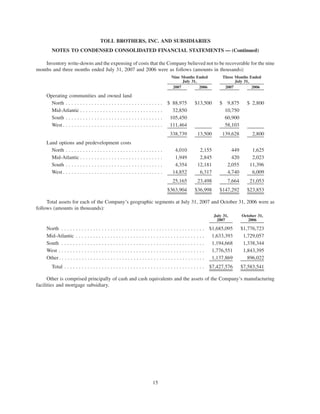
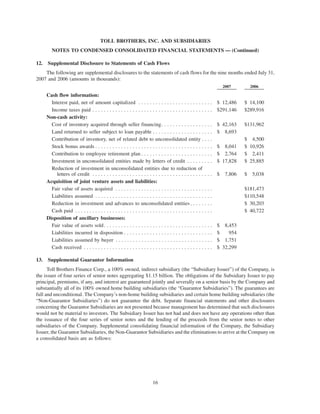
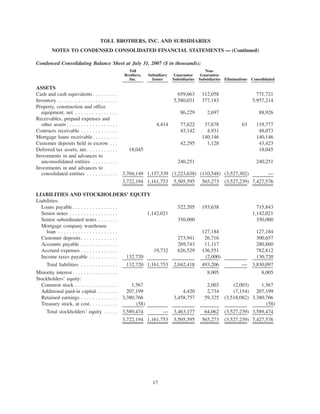
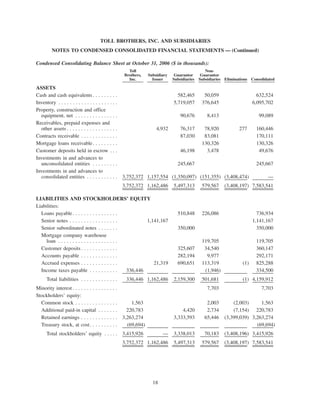
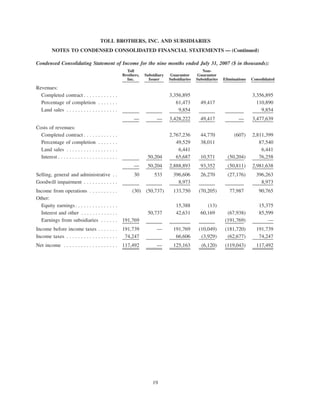
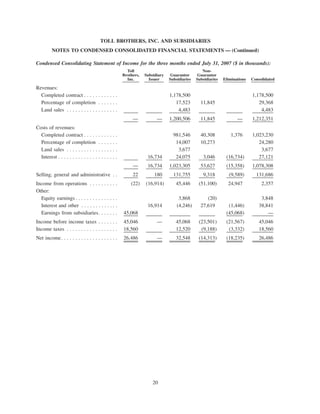
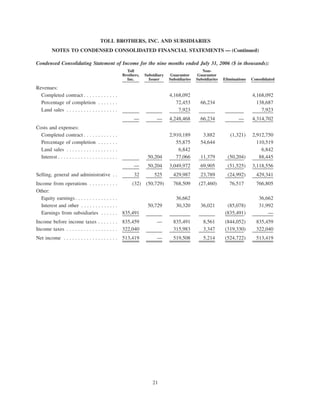
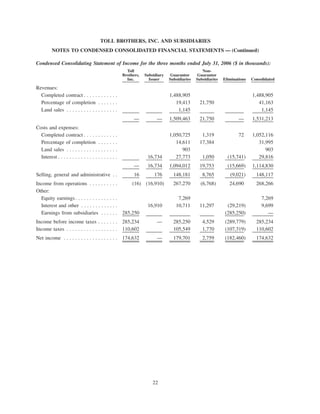
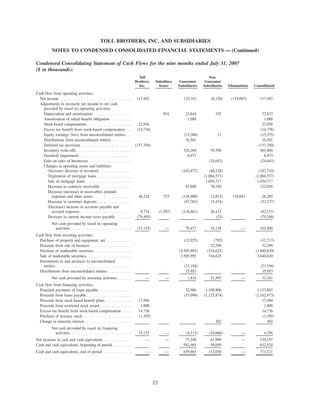
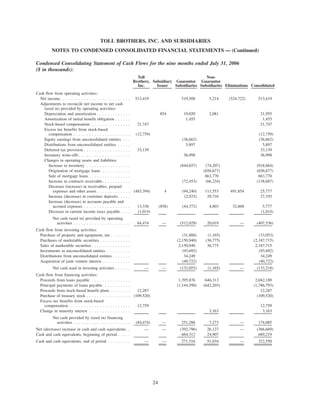
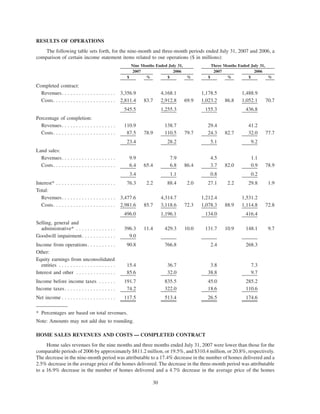
This document is Toll Brothers Inc.'s quarterly report filed with the SEC for the quarter ended July 31, 2007. It includes:
- Condensed consolidated balance sheets showing the company's assets (including $5.96 billion in inventory), liabilities (including $3.83 billion in total liabilities), and stockholders' equity as of July 31, 2007 and October 31, 2006.
- Notes to the condensed consolidated financial statements providing additional information about the company's accounting policies, commitments and contingencies, stock-based compensation, and earnings per share calculations.
- Management's discussion and analysis of the company's financial condition and results of operations for the quarter, including information on revenues, operating
This document is Toll Brothers' quarterly report filed with the SEC for the quarter ended April 30, 2007. It includes:
- Condensed consolidated financial statements including balance sheets, income statements, and cash flow statements for the periods ended April 30, 2007 and 2006.
- Notes to the financial statements providing additional information about the company's accounting policies, details of items in the financial statements, and other required disclosures.
- Management's discussion and analysis of the company's financial condition and results of operations for the periods presented, including discussions of revenue, expenses, liquidity, capital resources, and other key business metrics.
This document is Toll Brothers' quarterly report filed with the SEC for the quarter ending January 31, 2007. It includes condensed consolidated financial statements such as the balance sheet, income statement, and cash flow statement. It also provides notes to the financial statements and discussions of the company's financial condition, results of operations, market risk exposure, controls and procedures, legal proceedings, and other regulatory matters.
This document is a quarterly report filed by Toll Brothers, Inc. with the SEC for the quarter ended April 30, 2008. It includes:
- Condensed consolidated financial statements including balance sheets, statements of operations, and statements of cash flows for the periods ended April 30, 2008 and 2007.
- Notes to the condensed consolidated financial statements.
- Management's discussion and analysis of the company's financial condition and results of operations.
- Disclosure of the company's controls and procedures for financial reporting.
The report provides key financial data and analysis of Toll Brothers' performance for the quarter, including revenues, expenses, assets, liabilities, and cash flows. It gives investors information on
This document is a quarterly report filed with the SEC by Toll Brothers, Inc. for the quarter ending January 31, 2008. It includes:
- Condensed consolidated balance sheets showing the company's assets (including cash, inventory, and investments) and liabilities (including loans, notes, and accounts payable) as of January 31, 2008 and October 31, 2007.
- A statement indicating that the information contained in this report is the same as that presented on a February 27, 2008 earnings call and that no additional confirmation or updating of the information is being provided in this Form 10-Q filing.
This document is a quarterly report filed with the SEC by Toll Brothers, Inc. for the quarter ended January 31, 2009. It includes condensed consolidated financial statements for the company, including balance sheets, income statements, and cash flow statements. It also includes notes to the financial statements and sections for management's discussion of financial condition, market risk exposure, controls and procedures, legal proceedings, risks, and other information required by the SEC.
This document is Realogy Corporation's Form 10-Q quarterly report filed with the SEC. It summarizes Realogy's financial performance for the third quarter of 2008, including revenue, expenses, profits, and cash flows. Realogy reported declines in homesale transactions and revenue compared to the prior year. However, cost-cutting measures helped maintain operating income despite challenging market conditions. Realogy remains highly leveraged following its 2007 acquisition and faces ongoing risks from debt obligations and the downturn in housing.
This document is Toll Brothers Inc.'s quarterly report filed with the SEC for the quarter ending January 31, 2006. It includes condensed consolidated financial statements such as the balance sheet, income statement, and cash flow statement. The balance sheet shows total assets of $6.56 billion, including $5.53 billion in inventory. Total liabilities are $3.61 billion, including $1.14 billion in senior notes and $350 million in senior subordinated notes. The report provides Toll Brothers' financial position and performance for the quarter and is intended to meet SEC regulatory filing requirements.
This document is Realogy Corporation's annual report on Form 10-K for the fiscal year ended December 31, 2007 filed with the SEC. It provides information on Realogy's business operations, legal proceedings, financial statements, executive compensation and other required disclosures. Specifically, it summarizes the acquisition of Realogy by Domus Holdings Corp. in a $8.75 billion leveraged buyout in April 2007, financed through debt and equity contributions. It also contains forward-looking statements and risk factors that may affect Realogy's future financial performance.
This document is Tenet Healthcare Corporation's Form 10-Q quarterly report filed with the SEC for the quarter ended September 30, 2007. It includes condensed consolidated financial statements and notes. Some key details:
- Net operating revenues for the quarter were $2.2 billion, up 7% from the prior year quarter.
- Operating income was $70 million for the quarter compared to $28 million in the prior year.
- Loss from continuing operations, before discontinued operations and cumulative effect of change in accounting principle, was $35 million for the quarter compared to a $19 million loss in the prior year quarter.
This document is Realogy Corporation's quarterly report filed with the SEC for the quarter ended June 30, 2008. It includes condensed consolidated financial statements for the second quarter of 2008, the first quarter of 2008, and comparative periods in 2007. It also includes notes to the financial statements and sections for management's discussion of financial results, market risk disclosures, and certifications of internal controls. Realogy is a large residential real estate services company that was spun off from Cendant Corporation and acquired by Apollo Management in a leveraged buyout transaction. It operates real estate brokerages and franchises real estate brokerage brands.
This document is Tenet Healthcare Corporation's annual report on Form 10-K for the fiscal year ended December 31, 2005 filed with the Securities and Exchange Commission. It provides an overview of Tenet's business operations, financial performance, properties, legal proceedings, executive compensation and other information. Specifically, it discloses that Tenet operates 73 general hospitals across 13 states, primarily focused on urban and rural communities in California, Georgia, Florida, Louisiana, Missouri, North Carolina, Pennsylvania, South Carolina, Tennessee and Texas. It also notes that several of Tenet's hospitals in New Orleans suffered damage from Hurricane Katrina in late August 2005.
This document is Toll Brothers' Form 10-Q quarterly report filed with the SEC for the quarter ended July 31, 2005. The summary includes:
1) Toll Brothers reported revenues of $3.8 billion for the nine months ended July 31, 2005, with net income of $495.8 million.
2) As of July 31, 2005, Toll Brothers had $5.9 billion in total assets, $3.4 billion in total liabilities, and $2.5 billion in total stockholders' equity.
3) For the three months ended July 31, 2005, Toll Brothers reported revenues of $1.6 billion and net income of $215.5 million.
This document is Tenet Healthcare Corporation's Form 10-Q filing for the quarterly period ended March 31, 2007. It provides financial statements and notes for the company, including the condensed consolidated balance sheet, statement of operations, and statement of cash flows. Key details include that Tenet operates 62 general hospitals with over 15,000 beds across 12 states, and had net operating revenues of $2.279 billion for the quarter and net income of $75 million.
Tenet Healthcare Corporation operates 80 general hospitals across 13 states in the United States. In 2004, Tenet announced plans to divest 27 hospitals to focus resources on remaining core operations. By the end of 2004, Tenet had completed the divestiture of 18 hospitals and entered agreements to divest 4 more. Going forward, Tenet will focus on its remaining 69 general hospitals and related operations. Tenet aims to provide quality healthcare and adapt its strategies to changes in the regulatory and economic environment.
This document is a Form 10-Q quarterly report filed by Health Net, Inc. with the SEC for the quarter ended September 30, 2004. It includes Health Net's condensed consolidated financial statements, with notes, for the periods ended September 30, 2004 and December 31, 2003. The financial statements show that as of September 30, 2004, Health Net had total assets of $3.5 billion including over $600 million in cash and investments, and total liabilities of $2.2 billion including nearly $1 billion in reserves for claims. For the quarter ended September 30, 2004, Health Net reported total revenues of $2.9 billion including $2.4 billion in health plan services premiums and $526 million
This document is a Form 10-Q quarterly report filed by Realogy Corporation with the SEC for the quarter ended March 31, 2008. It includes a forward-looking statement noting that actual results could differ from projections due to various risk factors. The report provides financial statements for the quarter, including statements of operations, balance sheets, and cash flows. It also includes notes to the financial statements and sections on management's discussion of financial results, market risk factors, and controls and procedures.
This document is a Form 10-Q quarterly report filed by Tenet Healthcare Corporation with the SEC for the quarter ended March 31, 2008. It includes condensed consolidated financial statements and notes. The financial statements show that for the quarter ended March 31, 2008, Tenet had net operating revenues of $2.37 billion, an operating loss of $9 million, and a net loss of $31 million. Cash flows used in operating activities were $133 million for the quarter.
This document is Best Buy's quarterly report filed with the SEC for the quarter ended August 30, 2008. It includes Best Buy's condensed consolidated balance sheet, statement of earnings, statement of cash flows and notes to the financial statements. The balance sheet shows Best Buy's assets, liabilities and shareholders' equity. As of August 30, 2008 Best Buy had total assets of $16 billion including $5.4 billion of current assets and $4.1 billion in property and equipment. Total liabilities were $10.6 billion and shareholders' equity was $5.4 billion.
This document provides tips and strategies for effective social media marketing. It discusses measuring analytics from blogs, websites and social platforms. It recommends owning related domain names and social profiles, submitting sites to search engines, using brand names consistently in content, monitoring brands online, creating short informative videos for YouTube, and engaging audiences through discussions to build communities. Links are also provided to additional social media marketing resources.
La presentazione che lo staff GGDBologna ha prodotto in occasione della #GGDBologna7.
Siamo partite da alcuni importanti ricerche per fare il focus sul fenomeno del mom blogging e per capire tutto quello che ci ruota attorno.Enjoy it!
This document promotes studying tourism and languages at Colegio Mayor de Bolivar in Cartagena, Colombia. It provides examples of graduates from the program who have found success working in tourism-related fields. Kevin Kelly now works at a hotel serving important guests after studying at Colegio Mayor de Bolivar. Loreley Tibocha and Yumy Meza both work as flight attendants for Avianca airline. Isis Doris moved to the US to work in travel after starting her career in Cartagena. Graduates have also found jobs managing hotels and working for hotels in Panama. The document encourages the reader to study tourism and languages at Colegio Mayor de Bolivar to open doors to career opportunities in
This document provides a recipe for pasta sauce that is simple and tasty. The recipe calls for pennetta pasta, canned tomatoes, cream of milk, chopped bacon, onion, vodka, and olive oil. The onion and bacon are cooked in olive oil before adding the vodka, tomatoes, and cream of milk. Once the sauce is almost cooked, pennetta pasta that has been cooked al dente is added to the sauce and mixed together before being served topped with grated cheese.
This document is Toll Brothers' quarterly report filed with the SEC for the quarter ending January 31, 2007. It includes condensed consolidated financial statements such as the balance sheet, income statement, and cash flow statement. It also provides notes to the financial statements and discussions of the company's financial condition, results of operations, market risk exposure, controls and procedures, legal proceedings, and other regulatory matters.
This document is a quarterly report filed with the SEC by Toll Brothers, Inc. for the quarter ending January 31, 2008. It includes:
- Condensed consolidated balance sheets showing the company's assets (including cash, inventory, and investments) and liabilities (including loans, notes, and accounts payable) as of January 31, 2008 and October 31, 2007.
- A statement that the information contained in this report is the same as that presented on a February 27, 2008 earnings call and press release, and is not being reconfirmed or updated in this filing.
This document is a quarterly report filed with the SEC by Toll Brothers, Inc. for the quarter ending January 31, 2008. It includes:
- Condensed consolidated balance sheets showing the company's assets (including cash, inventory, and investments) and liabilities (including loans, notes, and accounts payable) as of January 31, 2008 and October 31, 2007.
- A statement that the information contained in this report is the same that was previously released in a press release and conference call on February 27, 2008 regarding the company's results for the quarter ending January 31, 2008, and is not being reconfirmed or updated.
This document is a quarterly report filed with the SEC by Toll Brothers, Inc. for the quarter ending January 31, 2008. It includes:
- Condensed consolidated balance sheets showing the company's assets (including cash, inventory, and investments) and liabilities (including loans, notes, and accounts payable) as of January 31, 2008 and October 31, 2007.
- A statement that the information contained in this report is the same as that presented on a February 27, 2008 earnings call and press release, and is not being reconfirmed or updated in this filing.
This document is a quarterly report filed with the SEC by Toll Brothers, Inc. for the quarter ending January 31, 2008. It includes:
- Condensed consolidated balance sheets showing the company's assets (including cash, inventory, and investments) and liabilities (including loans, notes, and accounts payable) as of January 31, 2008 and October 31, 2007.
- Condensed consolidated statements of operations and cash flows for the quarters ending January 31, 2008 and 2007.
- Notes to the condensed consolidated financial statements.
- Management's discussion and analysis of the company's financial condition and results of operations for the quarter.
So in summary, this document provides Toll Brothers
This document is Toll Brothers Inc.'s quarterly report filed with the SEC for the quarter ending January 31, 2006. It includes condensed consolidated financial statements such as the balance sheet, income statement, and cash flow statement. The balance sheet shows total assets of $6.56 billion including $5.53 billion in inventory. Total liabilities are $3.61 billion including $1.14 billion in senior notes and $350 million in senior subordinated notes. Stockholders' equity is $2.95 billion. The report provides Toll Brothers' financial position and operating results for the quarter.
This document is Toll Brothers Inc.'s quarterly report filed with the SEC for the quarter ending April 30, 2006. It includes the company's condensed consolidated financial statements, management's discussion and analysis of financial condition and results, and certifications of controls and procedures. Toll Brothers reports revenues, costs, assets, liabilities, cash flows, and other financial details for the quarter. It also discusses the company's performance, business outlook, risks, and other disclosures required by the SEC for public companies.
This document is Toll Brothers Inc.'s quarterly report filed with the SEC for the quarter ending April 30, 2006. It includes the company's condensed consolidated financial statements, management's discussion and analysis of financial condition and results, and certifications of controls and procedures. Toll Brothers reports increased revenues and net income compared to the prior year quarter. It also notes various risk factors that could impact future results.
This document is Realogy Corporation's quarterly report filed with the SEC for the quarter ended September 30, 2008. It includes a summary of key financial information for Realogy, including condensed consolidated statements of operations and balance sheets for the relevant periods. It also includes notes to the financial statements and sections on management's discussion of financial condition, market risk, controls and procedures, legal proceedings, risk factors, and exhibits. The report provides required financial disclosures and an overview of Realogy's performance, risks, and corporate governance matters for the period.
This document is Realogy Corporation's quarterly report on Form 10-Q for the quarter ended March 31, 2008 filed with the SEC. It includes Realogy's condensed consolidated financial statements for the first quarter of 2008, compared to the same period in 2007. It also includes management's discussion and analysis of the financial results and condition of the company. Realogy discloses that it has significant debt from its leveraged buyout in 2007, and that a continued downturn in the housing market could negatively impact its business and financial results. The report was filed to comply with SEC reporting requirements for public companies.
This document is Realogy Corporation's quarterly report filed with the SEC for the quarter ended June 30, 2008. It includes condensed consolidated financial statements for the second quarter of 2008, the first quarter of 2008, and comparative periods in 2007. It also includes notes to the financial statements and sections for management's discussion of financial results, market risk disclosures, and certifications of internal controls. Realogy is a large residential real estate services company that was spun off from Cendant Corporation and acquired by Apollo Management in a leveraged buyout transaction. It operates real estate brokerages and franchises real estate brokerage brands.
This document is Group 1 Automotive's annual report on Form 10-K for the fiscal year ending December 31, 2006. It provides an overview of the company's business, including that it owns and operates 143 franchises across 105 dealership locations in 14 states. It discusses the company's business strategy of leveraging its talented employees through an expanding dealership network. The report also covers risk factors, financial information, corporate leadership, and other regulatory disclosures.
This document is Group 1 Automotive's annual report on Form 10-K for the fiscal year ending December 31, 2006. It provides an overview of the company's business, including that it owns and operates 143 franchises across 105 dealership locations in 14 states. It discusses the company's business strategy of leveraging its talented employees through an expanding dealership network. The report also covers risk factors, financial information, controls and procedures, and incorporates other required SEC disclosures.
This document is Realogy Corporation's annual report on Form 10-K for the fiscal year ended December 31, 2007 filed with the SEC. It provides information on Realogy's business operations, legal proceedings, risk factors, financial statements and other disclosures. Specifically, it summarizes Realogy's acquisition by Apollo Management in a $8.75 billion leveraged buyout in April 2007 and the resulting changes to Realogy's ownership and capital structure. It also indicates that no market exists for Realogy's common stock and that it has not registered any securities under Section 12 of the Exchange Act.
This document is the 2004 Form 10-K annual report filed by Universal Health Services, Inc. with the SEC. It provides information on UHS's business operations, properties, legal proceedings, market for securities, selected financial data, management's discussion and analysis, changes in accountants, controls and procedures, directors and officers, executive compensation, security ownership, related transactions, and accounting fees. Specifically, it discloses that as of March 2005, UHS operated 44 acute care hospitals and 49 behavioral health centers across the US and internationally. It also notes the pending sale of two acute care hospitals in Puerto Rico subject to regulatory approval.
This document is the 2004 annual report filed with the Securities and Exchange Commission by Universal Health Services, Inc. It provides information on the company's business operations, properties, legal proceedings, executive officers and directors. Universal Health Services, Inc. operates acute care hospitals, behavioral health centers, surgical hospitals and ambulatory centers across the U.S., Puerto Rico and the U.S. Virgin Islands. The report includes a table of contents listing the topics covered in the filing, as well as statements noting that forward-looking statements are based on predictions and actual results may differ due to risk factors.
This document is Realogy Corporation's annual report on Form 10-K for the fiscal year ended December 31, 2008 filed with the SEC. It includes information such as an overview of the company's business and operations, audited financial statements, discussion of legal proceedings, risk factors, and other required disclosures. Specifically, it discusses Realogy's substantial leverage from its acquisition by Apollo Management, constraints on its liquidity, and various risks related to adverse conditions in the housing market that could negatively impact its financial condition and results of operations.
This document is Realogy Corporation's annual report on Form 10-K for the fiscal year ended December 31, 2008 filed with the SEC. It includes information such as an overview of the company's business and operations, legal proceedings, risk factors, financial statements, and other disclosures. Specifically, it discusses Realogy's substantial leverage from its acquisition by Apollo Management, constraints on its liquidity, and various risks related to adverse conditions in the housing market that could negatively impact its financial condition and results of operations.
- Tenet Healthcare Corporation operates 101 general hospitals in the US with 25,116 beds across 15 states, as well as some international and specialty facilities.
- In 2003, Tenet announced plans to divest or consolidate 14 hospitals and in 2004 announced plans to divest an additional 27 hospitals to focus resources on 69 core hospitals.
- Tenet's hospitals offer acute care services and many offer tertiary services like transplant programs, with the goal of providing quality healthcare and competing effectively.
This document is EchoStar Communications Corporation's annual report on Form 10-K for the fiscal year ended December 31, 2000 filed with the Securities and Exchange Commission. It summarizes EchoStar's business operations, including its DISH Network direct broadcast satellite television service, technologies division, and satellite services business unit. It provides an overview of the components and technology behind EchoStar's DISH Network service, including its programming offerings, equipment requirements, and conditional access system for encryption/security. Financial data and other required disclosures are also included as required by the SEC.
The interim report summarizes the company's financial performance in the first half of 2008. Key points include record profitability with an operating margin of 16.6% and net margin of 12.1%. Vehicle and service sales grew 15% and 30% respectively. Earnings per share increased 36% to SEK 12.52. The outlook predicts earnings in 2008 will be higher than 2007 due to continued strong demand outside of Europe.
1) Scania reported record earnings in the first half of 2008, with operating margin reaching 16.6% and net margin at 12.1%.
2) Scania is pursuing profitable growth through increasing vehicle and service sales. Revenue grew 15% while EBIT grew 30% in the first half of 2008.
3) Scania's vision is to reach annual production of 150,000 vehicles while maintaining a flexible cost structure and focus on customer productivity and uptime.
The interim report summarizes the company's performance in the first three quarters of 2008. Key highlights include operating margins reaching an all-time high of 15.8% and EBIT growth of 25%. Revenue and profitability increased due to higher vehicle and service volumes, price increases, and favorable product mix. However, order bookings for trucks have declined 51% in Western Europe and 34% in Central and Eastern Europe. While flexible production has helped, earnings forecasts for 2009 are not provided due to economic uncertainty. The service business continues growing with increased traffic and workshop utilization.
HQ Bank has experienced volume driven growth in its credit portfolio over the past 9 months of 2008. While the portfolio increased 8% in local currencies, bad debt provisions increased in several markets. The bank has a well balanced portfolio that is diversified across exposure levels, geographic areas, and products. It maintains a conservative refinancing policy and manages risks through matched funding and credit risk management.
1) Scania reported all-time high earnings in 2008 with operating income of SEK 12,512 million. However, deliveries declined 18% in Q4 as the company adjusted production rates due to decreased demand in Europe.
2) While the trucks and services segment grew profits through price increases, this was partially offset by negative impacts from lower deliveries, used vehicles, raw materials, and R&D spending.
3) Scania's flexible production system and focus on reducing inventory and postponing investments helped cash flow, but tied up capital increased with capacity investments. Outlook remains uncertain given rapid demand fall in Q4 2008 and high industry inventory levels.
The interim report summarizes the company's performance in the first three quarters of 2008. Key highlights include operating margins reaching an all-time high of 15.8% and EBIT growth of 25%. Vehicle deliveries increased 4% while service revenue grew due to the large installed base of vehicles. The outlook acknowledges earnings will be higher in 2008 than 2007 but provides no forecast for 2009 due to uncertainty.
- Scania's operating margin and net margin increased in the first nine months of 2008 compared to the same period in 2007. Net sales rose 11% while order bookings declined 29% due to lower demand in Europe.
- Earnings per share increased and the forecast for higher full-year 2008 earnings remains unchanged. However, due to lower order bookings and higher inventories, Scania will adjust production rates.
- Service revenue continued to show strong growth of 8%, while trucks deliveries increased 4% and various restructuring efforts are expected to generate annual cost savings of SEK 300 million from 2009.
1) Scania reported all-time high earnings in 2008 with operating income of SEK 12,512 million. However, deliveries declined 18% in Q4 as the company adjusted production rates due to decreased demand in Europe.
2) While the trucks and services segment grew profits through price increases, this was partially offset by negative impacts from lower deliveries, used vehicles, raw materials, and R&D spending.
3) Scania's flexible production system and focus on reducing inventory and postponing investments helped cash flow, but tied up capital increased with capacity investments. Outlook for 2009 is uncertain due to rapid demand fall in Q4 and high industry inventory levels.
This document is Scania's annual report for 2008. It discusses Scania's vision to be a leading company in its industry by creating value for customers, employees, shareholders, and society. The report outlines Scania's mission to supply high-quality vehicles and services for transporting goods and passengers in a sustainable way. It provides an overview of Scania's operations in trucks, buses, coaches, engines, and financial services. The financial reports indicate that Scania delivered 66,516 trucks, 7,277 buses and coaches, and 6,671 engines in 2008.
Our Chief Executive Officer is required to annually certify to the New York Stock Exchange that the company is in compliance with NYSE corporate governance listing standards or note any violations. On June 6, 2007, our Chief Executive Officer submitted this unqualified certification, indicating the company was in full compliance with NYSE standards as of that date.
Our Chief Executive Officer is required to annually certify to the New York Stock Exchange that the company is in compliance with NYSE corporate governance listing standards, though he may qualify the certification if needed. On June 6, 2007, our Chief Executive Officer submitted the certification with no qualification, indicating full compliance with NYSE standards as of that date.
The document outlines the corporate governance guidelines of Perini Corporation. It discusses (1) the composition and responsibilities of the Board of Directors, including director qualifications and independence, (2) the roles and responsibilities of Board committees, and (3) policies regarding Board performance evaluation, director orientation, management succession planning, and the company's code of business conduct. The guidelines are intended to assist the Board in exercising its duties to stakeholders.
The Perini Corporation Code of Business Conduct and Ethics outlines guidelines for ethical behavior. It applies to all directors, officers, and employees. The code establishes rules regarding conflicts of interest, procurement ethics, accounting practices, use of company property, environmental compliance, and insider trading. Any violations of the code are taken seriously and can result in disciplinary action up to dismissal.
The document outlines the Corporate Governance and Nominating Committee Charter for Perini Corporation. The purpose of the committee is to identify and evaluate potential board candidates and lead corporate governance efforts. The committee must consist of at least two independent directors appointed by the board. It has authority to retain outside advisors and meet at least twice per year. Regarding nominations, the committee evaluates candidates, recommends nominees, and assesses board independence. For corporate governance, the committee develops guidelines, reviews committee performance, and recommends criteria for director tenure.
The document is the Compensation Committee Charter for Perini Corporation. It outlines the committee's purpose of ensuring compensation programs attract and retain employees while representing fair value for shareholders. It details the committee's composition, duties, and responsibilities which include annually reviewing executive compensation programs, recommending director and CEO compensation, overseeing incentive plans, and preparing required compensation disclosures.
What Lessons Can New Investors Learn from Newman Leech’s Success?Newman Leech
Newman Leech's success in the real estate industry is based on key lessons and principles, offering practical advice for new investors and serving as a blueprint for building a successful career.
Poonawalla Fincorp’s Strategy to Achieve Industry-Leading NPA Metricsshruti1menon2
Poonawalla Fincorp Limited, under the leadership of Managing Director Abhay Bhutada, has achieved industry-leading Gross Non-Performing Assets (GNPA) below 1% and Net Non-Performing Assets (NNPA) below 0.5% as of May 31, 2024. This success is attributed to a strategic vision focusing on prudent credit policies, robust risk management, and digital transformation. Bhutada's leadership has driven the company to exceed its targets ahead of schedule, emphasizing rigorous credit assessment, advanced risk management, and enhanced collection efficiency. By prioritizing customer-centric solutions, leveraging digital innovation, and maintaining strong financial performance, Poonawalla Fincorp sets new benchmarks in the industry. With a continued focus on asset quality, digital enhancement, and exploring growth opportunities, the company is well-positioned for sustained success in the future.
An accounting information system (AIS) refers to tools and systems designed for the collection and display of accounting information so accountants and executives can make informed decisions.
Fabular Frames and the Four Ratio ProblemMajid Iqbal
Digital, interactive art showing the struggle of a society in providing for its present population while also saving planetary resources for future generations. Spread across several frames, the art is actually the rendering of real and speculative data. The stereographic projections change shape in response to prompts and provocations. Visitors interact with the model through speculative statements about how to increase savings across communities, regions, ecosystems and environments. Their fabulations combined with random noise, i.e. factors beyond control, have a dramatic effect on the societal transition. Things get better. Things get worse. The aim is to give visitors a new grasp and feel of the ongoing struggles in democracies around the world.
Stunning art in the small multiples format brings out the spatiotemporal nature of societal transitions, against backdrop issues such as energy, housing, waste, farmland and forest. In each frame we see hopeful and frightful interplays between spending and saving. Problems emerge when one of the two parts of the existential anaglyph rapidly shrinks like Arctic ice, as factors cross thresholds. Ecological wealth and intergenerational equity areFour at stake. Not enough spending could mean economic stress, social unrest and political conflict. Not enough saving and there will be climate breakdown and ‘bankruptcy’. So where does speculative design start and the gambling and betting end? Behind each fabular frame is a four ratio problem. Each ratio reflects the level of sacrifice and self-restraint a society is willing to accept, against promises of prosperity and freedom. Some values seem to stabilise a frame while others cause collapse. Get the ratios right and we can have it all. Get them wrong and things get more desperate.
In World Expo 2010 Shanghai – the most visited Expo in the World History
https://www.britannica.com/event/Expo-Shanghai-2010
China’s official organizer of the Expo, CCPIT (China Council for the Promotion of International Trade https://en.ccpit.org/) has chosen Dr. Alyce Su as the Cover Person with Cover Story, in the Expo’s official magazine distributed throughout the Expo, showcasing China’s New Generation of Leaders to the World.
Madhya Pradesh, the "Heart of India," boasts a rich tapestry of culture and heritage, from ancient dynasties to modern developments. Explore its land records, historical landmarks, and vibrant traditions. From agricultural expanses to urban growth, Madhya Pradesh offers a unique blend of the ancient and modern.
Budgeting as a Control Tool in Government Accounting in Nigeria
Being a Paper Presented at the Nigerian Maritime Administration and Safety Agency (NIMASA) Budget Office Staff at Sojourner Hotel, GRA, Ikeja Lagos on Saturday 8th June, 2024.
“Amidst Tempered Optimism” Main economic trends in May 2024 based on the results of the New Monthly Enterprises Survey, #NRES
On 12 June 2024 the Institute for Economic Research and Policy Consulting (IER) held an online event “Economic Trends from a Business Perspective (May 2024)”.
During the event, the results of the 25-th monthly survey of business executives “Ukrainian Business during the war”, which was conducted in May 2024, were presented.
The field stage of the 25-th wave lasted from May 20 to May 31, 2024. In May, 532 companies were surveyed.
The enterprise managers compared the work results in May 2024 with April, assessed the indicators at the time of the survey (May 2024), and gave forecasts for the next two, three, or six months, depending on the question. In certain issues (where indicated), the work results were compared with the pre-war period (before February 24, 2022).
✅ More survey results in the presentation.
✅ Video presentation: https://youtu.be/4ZvsSKd1MzE
1. UNITED STATES SECURITIES AND EXCHANGE COMMISSION
Washington, D.C. 20549
Form 10-Q
(Mark One)
¥ QUARTERLY REPORT PURSUANT TO SECTION 13 OR 15(d)
OF THE SECURITIES EXCHANGE ACT OF 1934
For the quarterly period ended July 31, 2007
or
n TRANSITION REPORT PURSUANT TO SECTION 13 OR 15(d)
OF THE SECURITIES EXCHANGE ACT OF 1934
For the transition period from to
Commission file number 1-9186
TOLL BROTHERS, INC.
(Exact name of registrant as specified in its charter)
Delaware 23-2416878
(State or other jurisdiction of (I.R.S. Employer
incorporation or organization) Identification No.)
250 Gibraltar Road, Horsham, Pennsylvania 19044
(Address of principal executive offices) (Zip Code)
(215) 938-8000
(Registrant’s telephone number, including area code)
Not applicable
(Former name, former address and former fiscal year, if changed since last report)
Indicate by check mark whether the registrant (1) has filed all reports required to be filed by Section 13 or 15(d)
of the Securities Exchange Act of 1934 during the preceding 12 months (or for such shorter period that the registrant
was required to file such reports), and (2) has been subject to such filing requirements for the past
90 days. Yes ¥ No n
Indicate by check mark whether the registrant is a large accelerated filer, an accelerated filer, or a non-
accelerated filer. See definition of “an accelerated filer and large accelerated filer” in Rule 12b-2 of the Exchange
Act. Check one):
Large accelerated filer ¥ Accelerated filer n Non-accelerated filer n
Indicate by check mark whether the Registrant is a shell company (as defined in Rule 12b-2 of the Exchange
Yes n No ¥
Act)
Indicate the number of shares outstanding of each of the issuer’s classes of common stock, as of the latest
practicable date:
At September 3, 2007, there were approximately 156,747,000 shares of Common Stock, $.01 par value,
outstanding.
3. STATEMENT ON FORWARD-LOOKING INFORMATION
Certain information included herein and in our other reports, SEC filings, verbal or written statements and
presentations is forward-looking within the meaning of the Private Securities Litigation Reform Act of 1995,
including, but not limited to, information related to our anticipated operating results, financial resources, changes in
revenues, changes in profitability, changes in margins, changes in accounting treatment, interest expense, land
related write-downs, effects of home buyer cancellations, growth and expansion, anticipated income to be realized
from our investments in unconsolidated entities, the ability to acquire land, the ability to gain governmental
approvals and to open new communities, the ability to sell homes and properties, the ability to deliver homes from
backlog, the expected average delivered prices of homes, the ability to secure materials and subcontractors, the
ability to produce the liquidity and capital necessary to expand and take advantage of future opportunities, and stock
market valuations. In some cases you can identify those so called forward-looking statements by words such as
“may,” “will,” “should,” “expect,” “plan,” “anticipate,” “believe,” “estimate,” “predict,” “potential,” “project,”
“intend,” “can,” “appear,” “could,” “might,” or “continue” or the negative of those words or other comparable
words. Such forward-looking information involves important risks and uncertainties that could significantly affect
actual results and cause them to differ materially from expectations expressed herein and in our other reports, SEC
filings, verbal or written statements and presentations. These risks and uncertainties include local, regional and
national economic conditions, the demand for homes, domestic and international political events, uncertainties
created by terrorist attacks, the effects of governmental regulation, the competitive environment in which we
operate, fluctuations in interest rates, changes in home prices, the availability and cost of land for future growth,
adverse market conditions that could result in substantial inventory write-downs, the availability of capital,
uncertainties and fluctuations in capital and securities markets, changes in tax laws and their interpretation, legal
proceedings, the availability of adequate insurance at reasonable cost, the ability of customers to obtain adequate
and affordable financing for the purchase of homes, the ability of home buyers to sell their existing homes, the
availability and cost of labor and materials, and weather conditions. Additional information concerning potential
factors that we believe could cause our actual results to differ materially from expected and historical results is
included in Item 1A “Risk Factors” of our Annual Report on Form 10-K for the fiscal year ended October 31, 2006
and Part II, Item 1A “Risk Factors” of this Form 10-Q.
If one or more of the assumptions underlying our forward-looking statements proves incorrect, then our actual
results, performance or achievements could differ materially from those expressed in, or implied by the forward-
looking statements contained in this report. Therefore, we caution you not to place undue reliance on our forward-
looking statements. This statement is provided as permitted by the Private Securities Litigation Reform Act of 1995.
When this report uses the words “we,” “us,” and “our,” they refer to Toll Brothers, Inc. and its subsidiaries,
unless the context otherwise requires. Reference herein to “fiscal 2007,” “fiscal 2006,” and “fiscal 2005,” refer to
our fiscal year ending October 31, 2007, and our fiscal years ended October 31, 2006 and October 31, 2005,
respectively.
1
7. TOLL BROTHERS, INC. AND SUBSIDIARIES
NOTES TO CONDENSED CONSOLIDATED FINANCIAL STATEMENTS
(Unaudited)
1. Significant Accounting Policies
Basis of Presentation
The accompanying unaudited condensed consolidated financial statements include the accounts of Toll
Brothers, Inc. (the “Company”), a Delaware corporation, and its majority-owned subsidiaries. All significant
intercompany accounts and transactions have been eliminated. Investments in 50% or less owned partnerships and
affiliates are accounted for using the equity method unless it is determined that the Company has effective control of
the entity, in which case the entity would be consolidated.
The accompanying unaudited condensed consolidated financial statements have been prepared in accordance
with the rules and regulations of the Securities and Exchange Commission (“SEC”) for interim financial
information. The October 31, 2006 balance sheet amounts and disclosures included herein have been derived
from our October 31, 2006 audited financial statements. Since the accompanying condensed consolidated financial
statements do not include all the information and footnotes required by U.S. generally accepted accounting
principles for complete financial statements, the Company suggests that they be read in conjunction with the
consolidated financial statements and notes thereto included in its Annual Report on Form 10-K for the fiscal year
ended October 31, 2006. In the opinion of management, the accompanying unaudited condensed consolidated
financial statements include all adjustments, which are of a normal recurring nature, necessary to present fairly the
Company’s financial position as of July 31, 2007, the results of its operations for the nine months and three months
ended July 31, 2007 and its cash flows for the nine months ended July 31, 2007 and 2006. The results of operations
for such interim periods are not necessarily indicative of the results to be expected for the full year.
Recent Accounting Pronouncements
In June 2006, the Financial Accounting Standards Board (the “FASB”) issued FASB Interpretation No. 48,
“Accounting for Uncertainty in Income Taxes” (“FIN 48”). FIN 48 clarifies the accounting for uncertainty in
income taxes recognized in accordance with Statement of Financial Accounting Standards (“SFAS”) No. 109,
“Accounting for Income Taxes”, and prescribes a recognition threshold and measurement attribute for the financial
statement recognition and measurement of a tax position taken or expected to be taken in a tax return. FIN 48 will be
effective for the Company’s fiscal year beginning November 1, 2007. The Company is currently reviewing the
effect FIN 48 will have on its financial statements.
In September 2006, the FASB issued SFAS No. 158, “Employers’ Accounting for Defined Benefit Pension and
Other Postretirement Plans, an amendment of FASB Statements No. 87, 88, 106, and 132(R)” (“SFAS 158”).
SFAS 158 requires the Company to (a) recognize in its statement of financial position the overfunded or
underfunded status of a defined benefit postretirement plan measured as the difference between the fair value
of plan assets and the benefit obligation, (b) recognize as a component of other comprehensive income, net of tax,
the actuarial gains and losses and the prior service costs and credits that arise during the period, (c) measure defined
benefit plan assets and defined benefit plan obligations as of the date of the Company’s statement of financial
position, and (d) disclose additional information about certain effects on net periodic benefit costs in the upcoming
fiscal year that arise from the delayed recognition of the actuarial gains and losses and the prior service costs and
credits. SFAS 158 is effective for the Company’s fiscal year beginning November 1, 2007. The Company does not
expect that adoption of SFAS 158 will have a material effect on its financial statements.
In September 2006, the Emerging Issues Task Force (the “EITF”) of the FASB issued EITF Issue No. 06-8,
“Applicability of the Assessment of a Buyer’s Continuing Investment under SFAS No. 66 for the Sale of
Condominiums” (“EITF 06-8”). EITF 06-8 states that in assessing the collectibility of the sales price pursuant
to paragraph 37(d) of SFAS 66, an entity should evaluate the adequacy of the buyer’s initial and continuing
investment to conclude that the sales price is collectible. If an entity is unable to meet the criteria of paragraph 37 of
SFAS 66, including an assessment of collectibility using the initial and continuing investment tests described in
5
8. TOLL BROTHERS, INC. AND SUBSIDIARIES
NOTES TO CONDENSED CONSOLIDATED FINANCIAL STATEMENTS — (Continued)
paragraphs 8-12 of SFAS 66, then the entity should apply the deposit method as described in paragraphs 65-67 of
SFAS 66. In November 2006, the FASB ratified the EITF’s recommendation. EITF 06-8 is effective for the
Company’s fiscal year beginning November 1, 2007. The application of the continuing investment criteria in
evaluating the collectibility of the sales price will limit the Company’s ability to recognize revenues and costs using
the percentage of completion accounting method in the future. The Company does not expect that EITF 06-08 will
affect any revenues or costs it has reported under percentage of completion accounting. The Company does not
expect that the application of EITF 06-08 will have a material effect on its financial statements.
In September 2006, the FASB issued SFAS No. 157, “Fair Value Measurements” (“SFAS 157”). SFAS 157
provides guidance for using fair value to measure assets and liabilities. The standard requires expanded information
about the extent to which a company measures assets and liabilities at fair value, the information used to measure
fair value, and the effect of fair value measurements on earnings. SFAS 157 will be effective for the Company’s
fiscal year beginning November 1, 2008. The Company is currently reviewing the effect SFAS 157 will have on its
financial statements.
Reclassifications
The presentation of certain prior period amounts have been reclassified to conform to the fiscal 2007
presentation.
2. Inventory
Inventory consisted of the following (amounts in thousands):
July 31, October 31,
2007 2006
Land and land development costs . . . . . . . . . . . . . . . . . . . . . . . . . . . . . . $1,738,053 $2,193,850
Construction in progress — completed contract . . . . . . . . . . . . . . . . . . . . 3,478,596 3,174,483
Construction in progress — percentage of completion . . . . . . . . . . . . . . . 71,754 153,452
Sample homes and sales offices . . . . . . . . . . . . . . . . . . . . . . . . . . . . . . . 330,785 244,097
Land deposits and costs of future development . . . . . . . . . . . . . . . . . . . . 319,432 315,041
Other . . . . . . . . . . . . . . . . . . . . . . . . . . . . . . . . . . . . . . . . . . . . . . . . . . . 18,594 14,779
$5,957,214 $6,095,702
Construction in progress includes the cost of homes under construction, land and land development costs and
the carrying costs of lots that have been substantially improved.
The Company capitalizes certain interest costs to inventory during the development and construction period.
Capitalized interest is charged to cost of revenues when the related inventory is delivered for homes accounted for
under the completed contract method of accounting or when the related inventory is charged to cost of revenues
6
9. TOLL BROTHERS, INC. AND SUBSIDIARIES
NOTES TO CONDENSED CONSOLIDATED FINANCIAL STATEMENTS — (Continued)
under percentage of completion accounting. Interest incurred, capitalized and expensed for the nine-month and
three-month periods ended July 31, 2007 and 2006 is summarized as follows (amounts in thousands):
Nine Months Ended Three Months Ended
July 31, July 31,
2007 2006 2007 2006
Interest capitalized, beginning of period . . . . . . . . . $181,465 $162,672 $200,560 $176,524
Interest incurred . . . . . . . . . . . . . . . . . . . . . . . . . . 102,702 100,879 34,430 34,224
Capitalized interest in inventory acquired . . . . . . . . 6,100
Interest expensed to cost of revenues . . . . . . . . . . . (76,258) (88,445) (27,121) (29,816)
Write-off to other . . . . . . . . . . . . . . . . . . . . . . . . . (40) (428) (154)
Interest capitalized, end of period . . . . . . . . . . . . . $207,869 $180,778 $207,869 $180,778
Interest included in cost of revenues for the nine-month and three-month periods ended July 31, 2007 and 2006
was as follows (amounts in thousands):
Nine Months Ended Three Months Ended
July 31, July 31,
2007 2006 2007 2006
Completed contract . . . . . . . . . . . . . . . . . . . . . . . . . . . $71,719 $83,769 $25,690 $28,423
Percentage of completion . . . . . . . . . . . . . . . . . . . . . . . 4,256 3,683 1,257 1,138
Land sales . . . . . . . . . . . . . . . . . . . . . . . . . . . . . . . . . . 283 993 174 255
$76,258 $88,445 $27,121 $29,816
Inventory write-downs and the expensing of costs that the Company believed not to be recoverable for the nine-
month and three-month periods ended July 31, 2007 and 2006 were as follows (amounts in thousands):
Nine Months Ended Three Months Ended
July 31, July 31,
2007 2006 2007 2006
Operating communities and owned land . . . . . . . . . . $338,739 $13,500 $139,628 $ 2,800
Land options and predevelopment costs . . . . . . . . . . . 25,165 23,498 7,664 21,053
Total . . . . . . . . . . . . . . . . . . . . . . . . . . . . . . . . . . . . $363,904 $36,998 $147,292 $23,853
At July 31, 2007, the fair value of the inventory in the 28 current communities and owned land subject to write-
downs in the three-month period ended July 31, 2007, net of the $139.6 million of write-downs, was approximately
$344.1 million.
The Company evaluated its land purchase contracts to determine if the selling entities were variable interest
entities (“VIE”) and, if they were, whether the Company was the primary beneficiary of the entities . The Company
does not possess legal title to the land, and its risk is generally limited to deposits paid to the seller. The sellers and
creditors of the seller generally have no recourse against the Company. At July 31, 2007, the Company had
determined that it was the primary beneficiary of one VIE related to its land purchase contracts and recorded
$16.3 million of inventory and $12.0 million of accrued expenses.
3. Investments in and Advances to Unconsolidated Entities
The Company has investments in and advances to several joint ventures with unrelated parties to develop land.
Some of these joint ventures develop land for the sole use of the venture partners, including the Company, and others
develop land for sale to the venture partners and to unrelated builders. The Company recognizes its share of earnings
from the sale of home sites to other builders. The Company does not recognize earnings from home sites it
7
10. TOLL BROTHERS, INC. AND SUBSIDIARIES
NOTES TO CONDENSED CONSOLIDATED FINANCIAL STATEMENTS — (Continued)
purchases from the joint ventures, but instead reduces its cost basis in these home sites by its share of the earnings on
the home sites. At July 31, 2007, the Company had approximately $149.4 million invested in or advanced to these
joint ventures and was committed to contributing additional capital in an aggregate amount of approximately
$232.4 million (net of the Company’s $146.2 million of loan guarantees related to two of the joint ventures’ loans) if
required by the joint ventures. At July 31, 2007, three of the joint ventures had an aggregate of $1.46 billion of loan
commitments, and had approximately $1.17 billion borrowed against the commitments, of which the Company’s
guarantees of its pro-rata share of the borrowings was $110.8 million.
The Company has investments in and advances to two joint ventures with unrelated parties to develop luxury
condominium projects, including for-sale residential units and commercial space. At July 31, 2007, the Company
had investments in and advances to the joint ventures of $21.6 million, was committed to making up to
$125.7 million of additional investments in and advances to the joint ventures if required by the joint ventures,
and guaranteed $14.9 million of joint venture loans. At July 31, 2007, the joint ventures had an aggregate of
$294.3 million of loan commitments, and had approximately $153.9 million borrowed against the commitments.
In October 2004, the Company entered into a joint venture in which it had a 50% interest with an unrelated
party to convert a 525-unit apartment complex, The Hudson Tea Buildings, located in Hoboken, New Jersey, into
luxury condominium units. At July 31, 2007, the Company had investments in and advances to the joint venture of
$53.5 million, and was committed to making up to $1.5 million of additional investments in and advances to the
joint venture.
In fiscal 2005, the Company, together with the Pennsylvania State Employees Retirement System (“PASERS”),
formed Toll Brothers Realty Trust Group II (“Trust II”) to be in a position to take advantage of commercial real estate
opportunities. Trust II is owned 50% by the Company and 50% by PASERS. At July 31, 2007, the Company had an
investment of $9.1 million in Trust II. In addition, the Company and PASERS each entered into subscription
agreements that expire in September 2007, whereby each agreed to invest additional capital in an amount not to exceed
$11.1 million if required by Trust II. Prior to the formation of Trust II, the Company used Toll Brothers Realty
Trust Group (the “Trust”) to invest in commercial real estate opportunities.
The Company formed the Trust in 1998 to take advantage of commercial real estate opportunities. The Trust is
effectively owned one-third by the Company; one-third by Robert I. Toll, Bruce E. Toll (and members of his family),
Zvi Barzilay (and members of his family), Joel H. Rassman and other members of the Company’s current and
former senior management; and one-third by PASERS (collectively, the “Shareholders”). At July 31, 2007, the
Company had an investment of $6.7 million in the Trust. The Shareholders entered into subscription agreements
whereby each group has agreed to invest additional capital in an amount not to exceed $1.9 million if required by the
Trust. The subscription agreements expire in August 2008. The Company provides development, finance and
management services to the Trust and received fees under the terms of various agreements in the amounts of
$1.5 million and $1.9 million in the nine-month periods ended July 31, 2007 and 2006, respectively, and $0.6 million
and $0.7 million in the three-month periods ended July 31, 2007 and 2006, respectively. The Company believes that
the transactions between itself and the Trust were on terms no less favorable than it would have agreed to with
unrelated parties.
The Company’s investments in these entities are accounted for using the equity method.
4. Goodwill Impairment
During the three-month period ended January 31, 2007, due to the continued decline of the Detroit market, the
Company re-evaluated the carrying value of goodwill that resulted from a 1999 acquisition in accordance with
SFAS No. 142, “Goodwill and Other Intangible Assets”. The Company estimated the fair value of its assets in this
market including goodwill. Fair value was determined based on the discounted future cash flow expected to be
generated in this market. Based upon this evaluation and the Company’s expectation that this market will not
recover for a number of years, the Company determined that the related goodwill was impaired. The Company
8
11. TOLL BROTHERS, INC. AND SUBSIDIARIES
NOTES TO CONDENSED CONSOLIDATED FINANCIAL STATEMENTS — (Continued)
recognized a $9.0 million impairment charge in the three-month period ended January 31, 2007. After recognizing
this charge, the Company does not have any goodwill remaining from this acquisition.
5. Accrued Expenses
Accrued expenses at July 31, 2007 and October 31, 2006 consisted of the following (amounts in thousands):
July 31, October 31,
2007 2006
Land, land development and construction costs . . . . . . . . . . . . . . . . . . . . . . $342,267 $376,114
Compensation and employee benefit costs. . . . . . . . . . . . . . . . . . . . . . . . . . 104,318 127,503
Insurance and litigation . . . . . . . . . . . . . . . . . . . . . . . . . . . . . . . . . . . . . . . 138,485 130,244
Warranty costs . . . . . . . . . . . . . . . . . . . . . . . . . . . . . . . . . . . . . . . . . . . . . . 59,485 57,414
Interest . . . . . . . . . . . . . . . . . . . . . . . . . . . . . . . . . . . . . . . . . . . . . . . . . . . 43,561 43,629
Other . . . . . . . . . . . . . . . . . . . . . . . . . . . . . . . . . . . . . . . . . . . . . . . . . . . . . 94,696 90,384
$782,812 $825,288
The Company accrues for the expected warranty costs at the time each home is closed and title and possession
have been transferred to the home buyer. Costs are accrued based upon historical experience. Changes in the
warranty accrual for the nine-month and three-month periods ended July 31, 2007 and 2006 were as follows
(amounts in thousands):
Nine Months Ended Three Months Ended
July 31, July 31,
2007 2006 2007 2006
Balance, beginning of period . . . . . . . . . . . . . . . . . . . $ 57,414 $ 54,722 $58,716 $54,372
Additions. . . . . . . . . . . . . . . . . . . . . . . . . . . . . . . . . . 22,392 26,141 7,509 9,217
Charges incurred . . . . . . . . . . . . . . . . . . . . . . . . . . . . (20,321) (25,391) (6,740) (8,117)
Balance, end of period . . . . . . . . . . . . . . . . . . . . . . . . $ 59,485 $ 55,472 $59,485 $55,472
6. Employee Retirement Plans
In October 2004, the Company established a defined benefit retirement plan effective as of September 1, 2004.
The plan covers four current or former senior executives and a director of the Company. Effective as of February 1,
2006, the Company adopted an additional defined benefit retirement plan for nine other executives. The retirement
plans are unfunded and vest when the participant has completed 20 years of service with the Company and reaches
normal retirement age (age 62). Unrecognized prior service costs are being amortized over the period from the
effective date of the plans until the participants are fully vested. The Company used a 5.68% and 5.65% discount
rate in its calculation of the present value of its projected benefit obligations for the fiscal 2007 and 2006 periods,
respectively, which represented the approximate long-term investment rate at October 31 of the preceding fiscal
year for which the present value was calculated.
9
12. TOLL BROTHERS, INC. AND SUBSIDIARIES
NOTES TO CONDENSED CONSOLIDATED FINANCIAL STATEMENTS — (Continued)
For the nine-month and three-month periods ended July 31, 2007 and 2006, the Company recognized the
following costs related to these plans (amounts in thousands):
Nine Months Ended Three Months
July 31, Ended July 31,
2007 2006 2007 2006
Service cost . . . . . . . . . . . . . . . . . . . . . . . . . . . . . . . . . . . . . . . $ 247 $ 269 $ 83 $101
Interest cost . . . . . . . . . . . . . . . . . . . . . . . . . . . . . . . . . . . . . . . 760 687 253 241
Amortization of initial benefit obligation . . . . . . . . . . . . . . . . . . 1,088 1,455 203 503
$2,095 $2,411 $539 $845
Benefits paid. . . . . . . . . . . . . . . . . . . . . . . . . . . . . . . . . . . . . . . $ 154 — $ 29 —
7. Stock Based Benefit Plans
The fair value of each option award is estimated on the date of grant using a lattice-based option valuation
model that uses assumptions noted in the following table. The lattice-based option valuation models incorporate
ranges of assumptions for inputs; those ranges are disclosed in the table below. Expected volatilities are based on
implied volatilities from traded options on the Company’s stock, historical volatility of the Company’s stock and
other factors. The expected life of options granted is derived from the historical exercise patterns and anticipated
future patterns and represents the period of time that options granted are expected to be outstanding; the ranges
given below results from certain groups of employees exhibiting different behavior. The risk-free rate for periods
within the contractual life of the option is based on the U.S. Treasury yield curve in effect at the time of grant.
The weighted-average assumptions and the fair values used for stock option grants for the nine-month and
three-month periods ended July 31, 2007 and 2006 are as follows:
2007 2006
Expected volatility . . . . . . . . . . . . . . . . . . . . . . . . . . . . . . . 36.32% - 38.22% 36.33% - 38.28%
Weighted-average volatility . . . . . . . . . . . . . . . . . . . . . . . . . 37.16% 37.55%
Risk-free interest rate . . . . . . . . . . . . . . . . . . . . . . . . . . . . . 4.57% - 4.61% 4.38% - 4.51%
Expected life (years) . . . . . . . . . . . . . . . . . . . . . . . . . . . . . . 3.69 - 8.12 4.11 - 9.07
Dividends . . . . . . . . . . . . . . . . . . . . . . . . . . . . . . . . . . . . . . none none
Weighted-average grant date fair value per share of options
granted . . . . . . . . . . . . . . . . . . . . . . . . . . . . . . . . . . . . . . $11.17 $15.30
In the nine-month and three-month periods ended July 31, 2007 and 2006, the Company recognized the
following costs and tax benefits related to its option plans (amounts in thousands):
Nine Months Ended Three Months
July 31, Ended July 31,
2007 2006 2007 2006
Stock compensation . . . . . . . . . . . . . . . . . . . . . . . . . . . . . $22,632 $21,513 $4,492 $5,257
Income tax benefit . . . . . . . . . . . . . . . . . . . . . . . . . . . . . . $ 8,423 $ 7,466 $1,977 $1,741
The Company expects to recognize approximately $27.1 million of expense and $10.0 million of income tax
benefit for the full fiscal 2007 year related to stock option awards. The Company recognized approximately
$26.8 million of expense and $9.2 million of income tax benefit for the full fiscal 2006 year related to stock option
awards.
The Company’s stock option plans for employees (including officers) and non-employee directors provide for
the granting of incentive stock options (solely to employees) and non-qualified options with a term of up to ten years
10
13. TOLL BROTHERS, INC. AND SUBSIDIARIES
NOTES TO CONDENSED CONSOLIDATED FINANCIAL STATEMENTS — (Continued)
at a price not less than the market price of the stock at the date of grant. Options granted to employees generally vest
over a four-year period, although certain grants vest over a longer or shorter period, and grants to non-employee
directors generally vest over a two-year period. Shares issued upon the exercise of a stock option are either from
shares held in treasury or newly issued shares.
Pursuant to the provisions of the Company’s stock option plans, participants are permitted to use the value of
the Company’s common stock that they own to pay for the exercise of options. The Company received 4,172 shares
with an average fair market value per share of $35.43 for the exercise of stock options in the nine months ended
July 31, 2006. No shares were received for the exercise of stock options in the three months ended July 31, 2006 or
in the nine months and three months ended July 31, 2007.
Stock option activity for the nine months ended July 31, 2007 and 2006 was as follows:
2007 2006
Weighted- Weighted-
Average Average
Shares Exercise Price Shares Exercise Price
(In 000’s) (Per share) (In 000’s) (Per share)
Outstanding, beginning of period . . . . . . . . . .. 25,178 $12.70 26,155 $11.04
Granted . . . . . . . . . . . . . . . . . . . . . . . . . . . . .. 1,823 $31.80 1,433 $35.97
Exercised . . . . . . . . . . . . . . . . . . . . . . . . . . .. (2,405) $ 7.15 (1,757) $ 6.57
Cancelled . . . . . . . . . . . . . . . . . . . . . . . . . . .. (150) $32.67 (179) $28.09
Outstanding, end of period . . . . . . . . . . . . . . . . 24,446 $14.55 25,652 $12.62
Exercisable, end of period . . . . . . . . . . . . . . . . 20,069 $10.86 20,830 $ 8.96
At July 31, 2007, the exercise price of approximately 5.6 million outstanding options was higher than the
average closing price of the Company’s common stock on the New York Stock Exchange (the “NYSE”) for the
three-month period ended July 31, 2007.
Stock options outstanding and exercisable at July 31, 2007 were as follows:
Options Outstanding Options Exercisable
Weighted- Weighted-
Average Weighted- Average Weighted-
Range of Remaining Average Remaining Average
Exercise Number Contractual Exercise Number Contractual Exercise
Prices ($) Outstanding Life Price ($) Exercisable Life Price ($)
(In years) (In years)
4.38 - 6.86 . . . . . 8,873,048 1.8 5.16 8,873,048 1.8 5.16
6.87 - 9.66 . . . . . 2,613,524 3.1 9.44 2,613,524 2.9 9.44
9.67 - 10.88 . . . . . 5,128,456 4.8 10.75 5,128,456 4.8 10.75
10.89 - 20.14 . . . . . 2,258,261 6.4 20.14 1,722,410 6.4 20.14
20.15 - 35.97 . . . . . 5,572,688 8.3 33.11 1,731,420 7.6 33.26
24,445,977 4.4 14.55 20,068,858 3.6 10.86
The intrinsic value of options outstanding and exercisable is the difference between the fair market value of the
Company’s common stock on the applicable date (“Measurement Value”) and the exercise price of those options
that had an exercise price that was less than the Measurement Value. The intrinsic value of options exercised is the
difference between the fair market value of the Company’s common stock on the date of exercise and the exercise
price.
11
14. TOLL BROTHERS, INC. AND SUBSIDIARIES
NOTES TO CONDENSED CONSOLIDATED FINANCIAL STATEMENTS — (Continued)
The intrinsic value of options outstanding and exercisable at July 31, 2007 and 2006 was as follows (amounts
in thousands):
2007 2006
Intrinsic value of options
Outstanding . . . . . . . . . . . . . . . . . . . . . . . . . . . . . . . . . . . . . . . . . . . . . . . $242,840 $364,441
Exercisable . . . . . . . . . . . . . . . . . . . . . . . . . . . . . . . . . . . . . . . . . . . . . . . $241,879 $346,060
The intrinsic value of options exercised and the fair value of options which became vested in the nine-month
and three-month periods ended July 31, 2007 and 2006 were as follows (amounts in thousands):
Nine Months Ended Three Months Ended
July 31, July 31,
2007 2006 2007 2006
Intrinsic value of options exercised . . . . . . . . . . . . . . . . . $48,536 $46,343 $36,502 $9,244
Fair value of options vested . . . . . . . . . . . . . . . . . . . . . . $21,642 $23,551 — —
8. Earnings Per Share Information
Information pertaining to the calculation of earnings per share for the nine-month and three-month periods
ended July 31, 2007 and 2006 are as follows (amounts in thousands):
Nine Months Ended Three Months Ended
July 31, July 31,
2007 2006 2007 2006
Basic weighted-average shares . . . . . . . . . . . . . . . . . . . 154,828 154,520 155,556 153,723
Common stock equivalents . . . . . . . . . . . . . . . . . . . . . . 9,411 10,903 8,819 9,791
Diluted weighted-average shares . . . . . . . . . . . . . . . . . . 164,239 165,423 164,375 163,514
9. Stock Repurchase Program
In March 2003, the Company’s Board of Directors authorized the repurchase of up to 20 million shares of its
Common Stock, par value $.01, from time to time, in open market transactions or otherwise, for the purpose of
providing shares for its various employee benefit plans. At July 31, 2007, the Company had approximately
12.1 million shares remaining to be purchased under this authorization. The Board of Directors did not fix an
expiration date for the repurchase program.
10. Commitments and Contingencies
At July 31, 2007, the aggregate purchase price of land parcels under option and purchase agreements,
excluding parcels that the Company does not expect to acquire, was approximately $2.48 billion (including
$1.21 billion of land to be acquired from joint ventures which the Company has investments in, made advances to or
made loan guarantees on behalf of, in the aggregate amount of $295.7 million), of which it had paid or deposited
approximately $154.8 million. The Company’s option agreements to acquire the home sites do not require the
Company to buy the home sites, although the Company may, in some cases, forfeit any deposit balance outstanding
if and when it terminates an option contract. Of the $154.8 million the Company had paid or deposited on these
purchase agreements, $121.7 million were non-refundable at July 31, 2007. Any deposit in the form of a standby
letter of credit is recorded as a liability at the time the standby letter of credit is issued. Included in accrued liabilities
is $89.7 million representing the Company’s outstanding standby letters of credit issued in connection with options
to purchase home sites.
12
15. TOLL BROTHERS, INC. AND SUBSIDIARIES
NOTES TO CONDENSED CONSOLIDATED FINANCIAL STATEMENTS — (Continued)
At July 31, 2007, the Company had outstanding surety bonds amounting to approximately $699.1 million,
related primarily to its obligations to various governmental entities to construct improvements in the Company’s
various communities. The Company estimates that approximately $264.1 million of work remains on these
improvements. The Company has an additional $141.5 million of surety bonds outstanding that guarantee other
obligations of the Company. The Company does not believe it is likely that any outstanding bonds will be drawn
upon.
At July 31, 2007, the Company had agreements of sale outstanding to deliver 4,997 homes with an aggregate
sales value of approximately $3.71 billion, of which the Company has recognized $48.1 million of revenues with
regard to a portion of such homes using the percentage of completion accounting method.
At July 31, 2007, the Company’s mortgage subsidiary was committed to fund approximately $1.27 billion of
mortgage loans. Approximately $318.2 million of these commitments, as well as $140.1 million of mortgage loans
receivable, have “locked in” interest rates. The mortgage subsidiary has commitments from recognized outside
mortgage financing institutions (“investors”) to acquire these locked-in loans and receivables. Our home buyers
have not “locked in” the interest rate on the remaining $947.3 million of committments; the Company believes that
currently there are adequate available resources in the primary and secondary mortgage markets to fund these
commitments.
The Company has a $1.89 billion credit facility consisting of a $1.56 billion unsecured revolving credit facility
and a $331.7 million term loan facility (collectively, the “Credit Facility”) with 35 banks, which extends to
March 17, 2011. At July 31, 2007, interest was payable on borrowings under the revolving credit facility at 0.475%
(subject to adjustment based upon the Company’s debt rating and leverage ratios) above the Eurodollar rate or at
other specified variable rates as selected by the Company from time to time. At July 31, 2007, the Company had no
outstanding borrowings against the revolving credit facility but had letters of credit of approximately $387.8 million
outstanding under it, of which the Company had recorded $89.7 million as liabilities under land purchase
agreements. Under the term loan facility, interest is payable at 0.50% (subject to adjustment based upon the
Company’s debt rating and leverage ratios) above the Eurodollar rate or at other specified variable rates as selected
by the Company from time to time. At July 31, 2007, interest was payable on the $331.7 million term loan at 5.82%.
Under the terms of the Credit Facility, the Company is not permitted to allow its maximum leverage ratio (as defined
in the agreement) to exceed 2.00 to 1.00 and was required to maintain a minimum tangible net worth (as defined in
the agreement) of approximately $2.41 billion at July 31, 2007. At July 31, 2007, the Company’s leverage ratio was
approximately 0.46 to 1.00 and its tangible net worth was approximately $3.56 billion. Based upon the minimum
tangible net worth requirement, the Company’s ability to pay dividends and repurchase its common stock was
limited to an aggregate amount of approximately $1.15 billion at July 31, 2007.
In January 2006, the Company received a request for information pursuant to Section 308 of the Clean Water
Act from Region 3 of the Environmental Protection Agency (the “EPA”) requesting information about storm water
discharge practices in connection with its homebuilding projects in the states that comprise EPA Region 3. To the
extent the EPA’s review were to lead the EPA to assert violations of state and/or federal regulatory requirements and
request injunctive relief and/or civil penalties, the Company would defend and attempt to resolve any such asserted
violations. At this time, the Company cannot predict the outcome of the EPA’s review.
The Company and several of its officers and directors have been named as defendants in a securities class
action (including an amended complaint) filed in the U.S. District Court for the Eastern District of Pennsylvania.
The plaintiffs filed this action on behalf of the purported class of purchasers of the Company’s common stock
between December 9, 2004 and November 8, 2005. The complaint alleges that the defendants violated
Sections 10(b), 20(a), and 20A of the Securities Exchange Act of 1934. The Company believes that this lawsuit
is without merit and intends to vigorously defend against it.
On May 21, 2007, a consumer class action was filed against the Company, its mortgage company subsidiary
and its title company subsidiary in the United States District Court for the Eastern District of Pennsylvania. The
13
16. TOLL BROTHERS, INC. AND SUBSIDIARIES
NOTES TO CONDENSED CONSOLIDATED FINANCIAL STATEMENTS — (Continued)
Company filed a motion to dismiss the complaint and, thereafter, the complaint was voluntarily withdrawn, without
prejudice.
The Company is involved in various other claims and litigation arising in the ordinary course of business. The
Company believes that the disposition of these matters will not have a material effect on the business or on the
financial condition of the Company.
11. Geographic Segments
During the fourth quarter of fiscal 2006, the Company reassessed the aggregation of its operating segments,
and as a result, restated its disclosure to include four separate reportable segments. The restatement had no impact
on the Company’s financial position, results of operations or cash flows for the nine-month and three-month periods
ended July 31, 2006.
Revenue and income (loss) before income taxes for each of the Company’s geographic segments for the nine
months and three months ended July 31, 2007 and 2006 were as follows (amounts in millions):
Nine Months Ended Three Months Ended
July 31, July 31,
2007 2006 2007 2006
(As restated) (As restated)
Revenues:
North . . . . . . . . . . . . . . . . . . . . . . . . . . . . . . . $ 755.3 $1,015.8 $ 296.8 $ 377.3
Mid-Atlantic . . . . . . . . . . . . . . . . . . . . . . . . . 1,015.1 1,295.9 350.6 447.4
South . . . . . . . . . . . . . . . . . . . . . . . . . . . . . . . 778.0 838.8 243.3 282.6
West . . . . . . . . . . . . . . . . . . . . . . . . . . . . . . . 929.2 1,164.2 321.7 423.9
Total . . . . . . . . . . . . . . . . . . . . . . . . . . . . . $3,477.6 $4,314.7 $1,212.4 $1,531.2
Income (loss) before income taxes:
North . . . . . . . . . . . . . . . . . . . . . . . . . . . . . . . $ 19.0 $ 215.0 $ 26.8 $ 79.6
Mid-Atlantic . . . . . . . . . . . . . . . . . . . . . . . . . 182.4 372.1 61.6 120.4
South . . . . . . . . . . . . . . . . . . . . . . . . . . . . . . . (4.4) 101.5 (30.3) 30.6
West . . . . . . . . . . . . . . . . . . . . . . . . . . . . . . . 60.5 262.5 (1.9) 87.8
Other . . . . . . . . . . . . . . . . . . . . . . . . . . . . . . . (65.8) (115.6) (11.2) (33.2)
Total . . . . . . . . . . . . . . . . . . . . . . . . . . . . . $ 191.7 $ 835.5 $ 45.0 $ 285.2
Other is comprised principally of general corporate expenses such as the offices of the Chief Executive Officer
and President, and the corporate finance, accounting, audit, tax, human resources, risk management, marketing and
legal groups, offset in part by interest income and income from our ancillary businesses.
14